International Journal of Scientific & Engineering Research, Volume 3, Issue 6, June-2012 1
ISSN 2229-5518
Keramatollah Akbari, Jafar Mahmoudi
Abstract — Computational fluid dynamics (CFD) is a powerful tool for predicting and visualizing radon content and indoor air quality and is cost effective in comparison with other methods such as full scale laboratory and gas trace techniques.
The intention of this article is to use CFD to simulate indoor radon distribution and ventilation effects.
In this study a mechanically balanced ventilation system and a continuous radon monitor (CRM) were used to measure the i ndoor ventilation rate and radon levels. In a numerical approach the FLUENT CFD package was used to simulate radon entry into the building and effects o n indoor air conditions. The effects of different ventilation rates, indoor temperature and relative humidity on indoor radon concentrations were investiga ted in a one family de- tached house in Stockholm. Results of numerical studies indicated that changes of ventilation rate, indoor temperature and moisture by means of ventila- tion systems have significant effects on indoor radon content. Ventilation rate was inversely proportional to indoor radon co ncentration. Minimum radon levels were estimated in the range of thermal comfort, i.e. at 21![]() and relative humidity between 50-70%.
and relative humidity between 50-70%.
The analytical solution was used to validate numeric results at 3 distinct air change rates. Comparisons between numerical an d analytical results showed good agreement but there was poor agreement between simulations and measurement results due to the short measuring period.
Index Terms — Numerical modeling, Radon mitigation, Balanced Ventilation, Residential buildings
—————————— ——————————
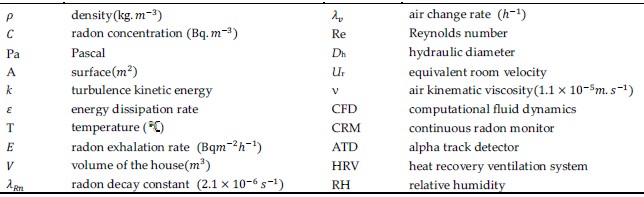
Nomenclature and abbreviations
Nderstanding indoor radon transport and distribution is a priority, and for this it is important to be able to predict indoor air quality and the exact value of radon level at different points and areas, especially in breathing zones
in residential buildings.
Indoor radon distribution and treatments have been studied
through measurements and full scale laboratory and tracer gas
models. These methods are rather expensive and time consum- ing. Analytical methods are also limited to varying
ventilation rates, and radon measurements are generally ex- pressed as average monthly or annual levels.
A numerical modeling approach using computational fluid
————————————————
![]() Keramatollah Akbari : TDI researcher at ACECR, Iran and Mälarda- len University, PhD student at School of Sustainable Development
Keramatollah Akbari : TDI researcher at ACECR, Iran and Mälarda- len University, PhD student at School of Sustainable Development
of Society and Technology, Västeras, Sweden. E-mail: keramatol- lah.akbari@mdh.se
![]() Jafar Mahmoudi: Mälardalen University, Lecturer at School of Sus-
Jafar Mahmoudi: Mälardalen University, Lecturer at School of Sus-
tainable Development of Society and Technology, Västeras, Sweden.
E-mail: jafar.mahmoudi@mdh.se
dynamics (CFD) techniques may be a powerful and cost- effective tool to study and predict indoor radon distribution.
Numerical models can be used to estimate the importance of specific factors for radon entry. These models also can pro- vide a cost-effective test bench for improved designs of radon prevention systems [1;2].
CFD techniques are based on solving the transport equa-
tions iteratively and are employed to solve equations involving velocity, temperature and species transport numerically in a finite volume. They describe the processes in the ventilated room, including the conservation of mass, energy, momentum and species such as radon [3; 4].
Numerous studies have used CFD to study the distribution of indoor air flow and radon concentration in two and three dimensions. Some of these studies are described in the follow- ing paragraphs.
Zhuo (Zhuo, 2000) used CFD to study the concentrations
and distributions of indoor radon in three dimensions. Accord- ing to the results of this simulation, the distribution of radon in a ventilated room is uniform except at locations near air dif-
IJSER © 2012
International Journal of Scientific & Engineering Research, Volume 3, Issue 6, June-2012 2
ISSN 2229-5518
fuser vents. He showed that the results of simulations of activi- ties and their distributions agreed well with experimental re- sults in a laboratory [5].
Feng and Persily (1995) performed computer simulations of airflow and radon transport in a large building using the multi-zone airflow and pollutant transport model CONTAM88. Th i s st u d y i n ve st i g a t e d ventilation system factors including the operation of exhaust fans and variations in outdoor air intake [6].
Wang and Ward ( 2000 ) used the CFD package FLUENT to
develop a model of multiple radon entry in a house with a
cellar. I n o r d e r to develop the model, they applied methods such as using a subroutine to specify the radon generation rate in the soil cells and designed appropriate boundary conditions [7]. The model was verified by a grid-independency test and convergence behavior analysis. The inter-model validation technique and comparison with analytical solutions were also used to validate the model.
Cohilis e t a l . ( 2 0 0 4 ) suggested the use of a numerical code based on the finite difference method. Based on the re- sults and the code validation, they concluded that this method was a powerful tool that could predict and evaluate the per- formance of subfloor ventilation strategies [8].
Rota et al. (1994) compared the results of numerical simula- tions and experiments. The results showed good agreement, but the simulation results showed elevated concentrations in the region with low ventilation rates compared to the experi- ments [9].
In this study a continuous radon monitor (CRM) and alpha track detectors (ATD) were used to measure indoor radon con- centrations. A one family detached house with a rotary heat exchanger ventilation system was used in a case study. Nu- merical methods, measurement and analytical calculations were used to estimate radon levels, as detailed in the following section.
The house consists of eight rooms with a total volume of
12×9×2.4 m3. Each room has its own vent except for Room 8, which shares a vent with Room 6. All doors are kept open. A rotary heat exchanger is placed in Room 4. The effect of the heat exchanger is ignored and an outlet vent is considered in Room 4 to play the role of the heat exchanger. Figure 1 shows the geometry of the house plan.
In the numerical approach the commercial CFD package in- cluding GAMBIT was used to define the geometry, and FLU- ENT 6.3 was used as the solver for calculations to simulate radon entry into the building and ventilation effects [10].
The selected 3D model was: species transport, pressure base
and steady state, k–ε turbulence, and the SIMPLE algorithm
was used to calculate and predict radon concentration at all grid locations numerically.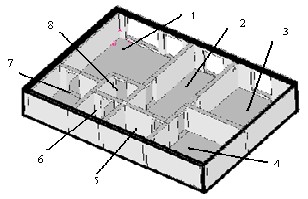
Fig.1. The geometry of the house plan
The model is meshed with 376238 hexahedral cells with 10 cm vertices in order to solve the conservation equations of var- ious fluid properties within each cell. These equations are flow, energy, turbulence, radon and humidity.
Three criteria were considered to confirm the model con-
vergence. The first criterion was the residuals of equations re- siduals could not change drastically through iterations and the residuals of all the conservation equations had to be less than 1
× 10–7.
The second criterion was that the concentration of radon in
one of the rooms (Room 1) could not change through itera- tions. The third criterion concerned the rate of radon passing through the outlet. As the model is solved for the steady state, all radon which is generated in the floor must also pass through the outlet, i.e. radon rate from the outlet must be equal to the radon generation rate. Specifically, radon rate through the outlet must be 2 bq/s and 3 bq/s for 1 Pa and 2 Pa pressure differences respectively. In order to avoid residual instability and oscillations, under relaxation factors were ad- justed to speed up the convergence.
The results of using 376238 and 752476 cells were compared to ensure that the grid cells were sufficiently small to ensure accurate results.
The model was solved for four different air change rates. Specifically, Ach=0.05, 0.25, 0.5 and 1.2. Temperature and rela- tive humidity were assumed to be fixed at 21°C and 30% re- spectively in these cases. The difference pressure was set at
1kPa.
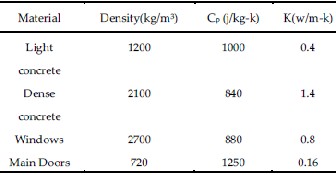
The materials used in the model are air, water vapor, radon as a fluid in a mixture and light concrete for the floor, dense con- crete for walls, windows material and main door as solid ma- terials. Internal doors are left open and external doors and windows are closed. Properties of the materials are as shown in Tables 1 and 2.
IJSER © 2012
International Journal of Scientific & Engineering Research, Volume 3, Issue 6, June-2012 3
ISSN 2229-5518
TABLE1
Properties of Fluids
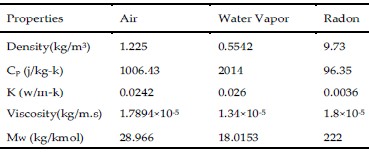
TABLE 2
Properties of Solids
The model is solved in order to investigate the effects of
various air change rates, temperatures, relative humilities and difference pressures. There are 15 states that must be solved to show the effects of the variables on radon concentration. Some of the various states of the variables are shown in Table 3.
Boundary conditions in the model are: 7 vents in rooms,
outer surfaces, floor zone, outlet, walls zones and room zones. Characteristics of these boundaries are as follows.
TABLE 3
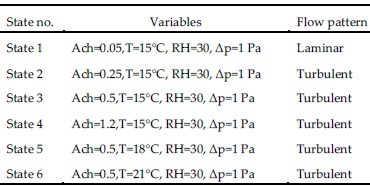
Some States for Simulations
The vent in each room is defined as the velocity inlet boun- dary. Specifications which must be defined for this type of
boundary are velocity, hydraulic diameter, temperature and mass fraction of radon and mass fraction of water vapor.
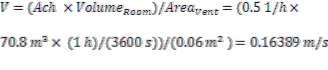
The area of each vent is 0.06 m2 and is the same for all rooms. Velocity can be obtained from the following expres-
The vent in each room is defined by the velocity inlet boundary. Specifications that must be defined for this type of![]()
boundary are velocity, hydraulic diameter, temperature, mass fraction of radon and mass fraction of water vapor.
sion. For example for Room 1 at 0.5 Ach:
IJSER © 2012
International Journal of Scientific & Engineering Research, Volume 3, Issue 6, June-2012 4
ISSN 2229-5518
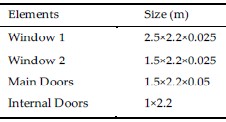
Similarly, for the other rooms, velocities in vents can be ob- tained. Walls are 0.3 m thick, and the sizes of other building elements are shown in Table 4.
Table 4
Sizes of Building Elements
Radon particles originate from the floor with the generation rate of 2.1×10⁻²¹kgm-3s-1 which can be given from the following equation: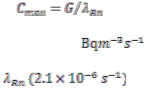
(1) Where G ( ) is the radon generation rate and is the radon decay constant. The unit
conversion is used to change Bq into kg as follows:
1 Bq = 1.75×10⁻¹⁹ kg (2)
Radon concentrations were measured continuously during winter and spring, both with a continuous radon meter (CRM)
and an alpha track detector ( These radon detectors w
Room 1.
The maximum error of radon measuring was ±10% accord- ing to manufacturing companies. The air change rates in the house were also measured by the heat recovery ventilation
(HRV) system.
Indoor radon content can be calculated as: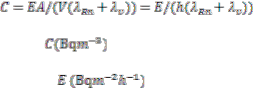
(3)
Where is indoor radon concentration at the steady state, is radon exhalation rate, ![]()
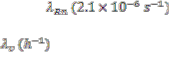
is the radon exhalation surface (in this study the house floor), ![]() is the volume of the house, is the radon decay constant and is the air change rate in
is the volume of the house, is the radon decay constant and is the air change rate in
the house and h=2.4 m is the height of the house.
For ![]() (Gote et al.,2008) and the given da- ta of the case study house, Equation (3) gives indoor radon levels for different ventilation rates (0, 0.25, 0.5 and 1).
(Gote et al.,2008) and the given da- ta of the case study house, Equation (3) gives indoor radon levels for different ventilation rates (0, 0.25, 0.5 and 1).
Graphical presentations of the three dimensional simula- tion data were prepared using FLUENT contours. These con- tours are a good tool for qualitative comparisons. From the FLUENT report, it is also possible to determine the numeric data for quantitative comparisons. This study investigated the effects of: 1. Ventilation rate, 2. Temperature, 3. Relative humidity, and 4. Pressure difference.
1.Ventilation rate:
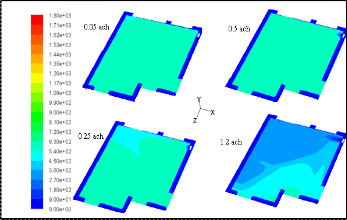
Contours of radon concentration in the house plan at posi- loor for various air change rates are
Fig. 2. Contours of radon concentration in the house plan (Room1) with air change rates 0.05-1.2 Ach
This figure shows qualitative comparisons of radon concen- trations at four different hourly air change rates ranging from
0.05 to 1.2 Ach.
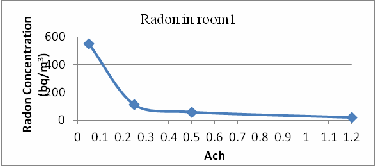
As evident from Figure 3, different ventilation rates have distinct effects on indoor concentration in Room 1. The quan- titative comparisons are plotted in Figure 4, which shows that
IJSER © 2012
International Journal of Scientific & Engineering Research, Volume 3, Issue 6, June-2012 5
ISSN 2229-5518
the radon concentration levels were inversely proportional to outdoor flow rate at steady state.
Numerical simulations were performed at different Rey- nolds numbers. The Reynolds number in the house was calcu- lated using Equation (4):
Re = Dh × Ur/ν (4)
where Dh is the hydraulic diameter of room and is defined
as: 2WH/(W + H) (W = width, H = height), Ur is the equivalent room velocity (flow rate/cross-sectional area) and ν![]() is the kinematic viscosity of air (3). The
is the kinematic viscosity of air (3). The
Reynolds numbers were 2 × 10⁴ and greater than 2 × 10⁵, cor- responding to ventilation rates of 0.05 and greater than 0.5
Ach.
In addition, as observed in Figure 2 different locations and
amount of the ventilation inlets affect the radon concentration.
2. Temperature:
Fig.3. Radon concentrations in Room1 versus air change rate
constant gas law. Thus, increasing temperature increases the
In order to investigate the effects of temperature changes on radon concentration, air change and relative humidity were fixed and indoor temperature was varied between 15 °C to 25
°C. Air change and relative humidity were maintained at 0.5
and 30% respectively. The temperature effects are shown qua-
litatively in Figure 4. Indoor radon levels were inversely pro-
portional to indoor temperature. This is because of the direct
correlation between temperature and pressure as stated by the
pressure, and since the indoor radon concentration is driven by pressure, the amount of radon driven into the room de- creases. From another perspective, increasing the house tem- perature increases indoor pressure and the outside acts a va- cuum cleaner and sucks away the indoor air. This phenome- non is referred to as the "stack effect" [11]. Figure 5 shows the contours of radon concentration at y=210 cm from the floor for various temperatures.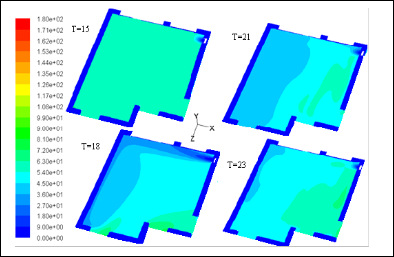
Fig. 4. Contours of radon concentration in Room 1 at different temperatures
IJSER © 2012
International Journal of Scientific & Engineering Research, Volume 3, Issue 6, June-2012 6
ISSN 2229-5518
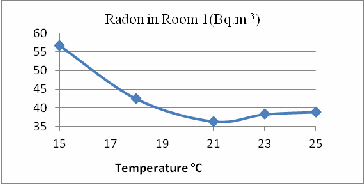
Fig.5. Radon concentrations in Room1 versus temperature
3. Relative humidity
The effect of varying relative humidity on radon concentra- tion in Room 1 is shown in Figure 6. Relative humidity is va- ried between 30 to 80% and temperature and air change are maintained at 18ºC and 0.25 respectively.
This figure indicates that radon concentration decreases from RH 30% to 70%, and increases when RH rises from above
70%.
This is because increasing humidity from zero to a defined
quantity below 50% increases the pressure gradient in air. This increases the driving force that draws the radon out of the ground. However, higher R H l e v e l s result in d e n s er air, and radon is unable to rise to high altitudes. Increased moisture in air also decreases diffusion coefficient and hence reduces the diffusion length of radon, which reduces transfer of radon to areas of low radon concentration.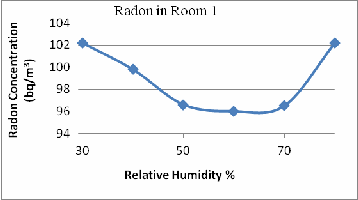
Fig.6. Radon concentrations in Room1 versus relative humidity
4. Pressure difference

The model was solved for 1 Pa and 2 Pa difference pres- sures. Radon entry rate varies with pressure difference. Pre- vious work in the field has established entry rates of 2 Bq/s and 3 Bq/s for pressure differences of 1 Pa and 2 Pa respective- ly [12].
Air change rate, temperature and relative humidity are maintained at 0.25, 18 ºC and 40% respectively.
Contours of radon concentration in a plane at y=210 cm
from the floor are shown in Figure 7, and clearly show that
pressure difference affects indoor radon levels.
International Journal of Scientific & Engineering Research, Volume 3, Issue 6, June-2012 7
ISSN 2229-5518
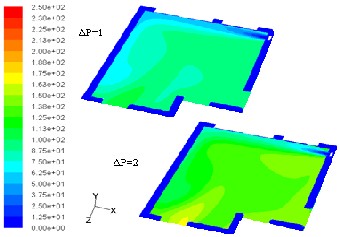
Fig. 7. Contour of radon concentration for Δp=1Pa and 2 Pa
ure shows that measured radon levels were inversely pro- portional to air exchange rate.
In general radon detectors measure the average level of indoor radon. The average results of measurements are shown in Table 5. In order to show the impact of ventilation rate on radon level, radon concentrations were measured at three different ventilation rates. Fig. 8 shows the results at three different air change rates, measured with a CRM. The fig-
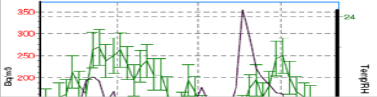
Continuous radon measurements using a CRM also con- firmed that in the indoor temperature range, fluctuating radon levels in the house have a strong indirect correlation with temperature (Figure 9).
TABLE 5
Measured indoor radon levels (Bq.m-3)
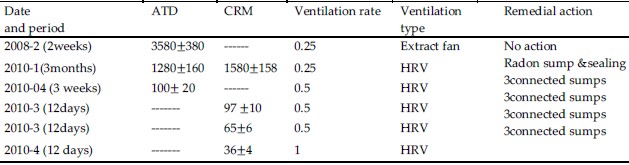
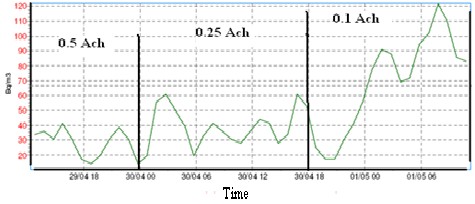
Fig.8. Measured radon level measurements versus ventilation rate
International Journal of Scientific & Engineering Research, Volume 3, Issue 6, June-2012 8
ISSN 2229-5518
Fig.9. Radon level (green) versus temperature (black)
As previously mentioned, Equation (12) was used for analyti- cal calculation and air change rates were set at 0.25, 0.5, and
1.2 h-1. The results are shown in Table 6.
4 Model Validation
Model validation was performed using analytical solution. The numeric differences between numerical simulation and analytical calculation results are shown in Table 6.
For quantitative comparisons, the percentage difference be-
tween the results of estimation by FLUENT and the analytical
calculations were computed at each ventilation rate. The max- imum difference was found to be below 10%. Measurement data were not suitable for comparison, because the measuring period was too short to obtain an acceptable average radon level.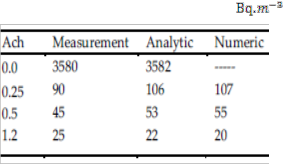
TABLE 6
Indoor radon concentrations result in
The models were developed in FLUENT with simulated radon entry through the floor into a one family house in three di- mensional models. The results support the hypothesis that indoor radon concentrations are indoor temperature and moisture dependent.
The verification of the model and its performance indicate
that radon entry to the house and the effects of temperature
and moisture have been well defined physically and numeri-
cally. The performance and sensitivity of the model was con- firmed by varying input parameters and boundary conditions. The effects of different parameters of indoor air such as venti- lation rate, indoor-outdoor pressure difference, indoor tem-
perature and relative humidity on indoor radon concentra- tions were investigated. The value of mass flow rate at the air inlet outlet affected the distribution patterns of indoor radon, both qualitatively and quantitatively.
Discrepancies were found here between CFD simulation,
numerical calculations and measurement data. These may
have resulted from insufficiently detailed representation of
boundary conditions and inaccuracies of measured data due
to the short measurement period.
In conclusion, CFD is a powerful research tool for predict- ing the factors that influence indoor radon distribution. How- ever, further improvement of the accuracy of the quantitative estimations of radon concentration will require more detailed consideration of turbulence, near wall effects, grid refinement near the vents, and development of a robust validation me- thod.
[1] C. E. Andersen, ¨Numerical modeling of radon-222 entry into houses:
an outline of techniques and results,¨ the science of total environment,
2001, Vols. 272: 33-42.
[2] F.Wang, I. C. Ward, ¨Radon entry, migration and reduction in houses with cellars,¨ Vols. 37 , 1153 – 1165,2002.
[3] H.B. Awbi, Ventilation of building, 2003.
[4] C.O.Loureiro, “Simulation of the steady-state transport of radonfrom soil into houses with basement under constant negativepressure.”Report no. LBL-24378. Lawrence Berkeley Laboratory, Berkeley, CA., 1987.
[5] W.Zhuo, et al. ¨Simulation of the concentrations and distributions of indoor radon and thoron,¨ 2000.
[6] J. B.Fang, A. K. Persily, ¨Computer Simulations of Airflow and Radon Transport in Four Large Buildings,¨ Building and Fire Research Laboratory, 1995.
[7] F.Wang, and I. C. Ward, ¨Development of a radon entry model for a house with a cellar,¨ Vol. 35 , 615-631,2000,.
[8] P.Cohilis, P.Wouters, and D.L'Heureux, ¨Prediction of The Performance of Various Strategies of Subfloor Ventilation as Remedial Action For Radon Problems.¨ 2004.
[9] R,Rota, et al.¨Ventilated enclosure with obstacles: experiments and
CFD simulations.¨ Cincinnati, OH: NIOH. pp. 181–6. : s.n., 1994. In Proceedings of the 4th International Symposium on Ventilation for Contaminant Control. Vol. 1.
[10] FLUENT Incorporated. FLUENT.¨User's Guide Version 6.3. Linux
Format,¨ Cavendish Court,Lebanon, NH 03766, USA: s.l. FLUENT, 2005. [11] R. L. Hoffmann, ¨Radon contamination of residential structure, an overview of factors influence infiltration rates.¨ s.l. Illinois Central
College, 1997.
[12] M.Goto et al. ¨Estimation of Global Radon Exhalation Rate
IJSER © 2012
International Journal of Scientific & Engineering Research, Volume 3, Issue 6, June-2012 9
ISSN 2229-5518
Distribution,· 2008.
IJSER ©2012