International Journal of Scientific & Engineering Research, Volume 5, Issue 3, March-2014 1000
ISSN 2229-5518
Novel method for classification of Artificial and
Natural images
Nikkoo Khalsa, Dr. Vijay T. Ingole
Abstract: The classification of images based on semantic description is a demanding and imperative problem in image retrieval system. Solitary easy features are extracted from the raw images data in order to exploit the dissimilarity of colour pattern and spatial co-relation of pixels in Artificial and Natural images. These features have poor precision if used alone but when considered collectively, it forms a more complex and accurate global classifier with enhanced precision. This paper describes novel method for classification of Artificial and Natural images with greater precision and low error rate.
Keywords: Artificial image, Natural image, Different Colour ratio, Saturation Average, SGLD, Gray Histogram
—————————— —————————
1 INTRODUCTION
THE rationale of an image classification system is to separate images into different classes. An ideal system should be able to discern various images with no hesitation just like an human being. Unfortunately, sometimes the categorization task is hard and indistinct even for a human. This makes the problem even more challenging. In this paper, a novel classifier is developed. The two classes involved in the classification are Natural and Artificial images.
Given an image, the classifier extracts and
investigates some of the most relevant features of the image and combines them in order to generate an opinion. The manually labelled images dataset has been created downloading random images from the internet [2]. The images have been selected with the aim of having a rich and considerable dataset and it has been tried to avoid redundant data. Images compressed with a lossy method such as JPEG have some of their features transformed. Because of this modification of the pictures, performances of some of the classifiers differ from the ideal case and thus, the error rate is higher in compressed images.
For example, images are usually compressed and resized in the web environment. Due to the interpolation used in the resizing process, the number of unique colours could greatly increase. So the performance of the feature using the number of colours would degrade significantly.
When we think of the main differences between
————————————————
• Nikkoo Khalsa is currently pursuing PhD in electronics engineering , SGB Amravati University, India.
• Dr. Vijay T. Ingole is a renowned academician and currently working as Professor Emeritus in PRM Institute of Technology & Research, Badnera- Amravati. India.
photographs and graphics, we can see that something very simple comes into our mind: graphics are typically generated using a limited number of colours and usually containing only a few areas of uniform colours. Moreover, highly saturated colours are more likely to be used. Sharp edges also are typical feature characterizing Artificial images that can be used by an image classifier. It is possible to easily spot these characteristics in maps charts, logos and cartoons. On the other hand, very often a photograph depicts real life objects and subjects. These have usually textures, smooth angles and larger variety of colours but less saturated pixels. Because of the way a photograph is acquired and the way a camera works, natural pictures also results in being more noisy [3].
For a human being, distinguishing between a
photograph and a graphic image is almost always an easy
task [8]. It is often just matter of a glance. Unfortunately it is
not for a computer. Noisiness, sharpness of the edges and
saturation must be derived from the raw data available. These features must be then combined together in order to build a solid classifier since if used individually, they can lead to poor or even wrong results.
Summarized steps in order to classify an image are
• Extract different features that give an individual classification.
• Combine them together using a classification method in order to boost the performance of the single classifier.
Compare the output and assign the image to a category.
2 IMAGE PARAMETERS
The main step in order to classify an image is to extract numerical features from the raw data. These common features will be then combined in different ways to form an efficient classifier system. The parameters extracted are:
Entropy
IJSER © 2014 http://www.ijser.org
International Journal of Scientific & Engineering Research, Volume 5, Issue 3, March-2014 1001
ISSN 2229-5518
In order to make meaningful classifier, it is necessary to know the properties of the image. One property is the image entropy; a highly correlated picture will have low entropy. For example a very low frequency, highly correlated image will be compressed well by many different techniques; it is more the image property and not the compression algorithm that gives the good compression rates. If an image has G grey-levels and the probability of grey-level k is P(k) the entropy H2 is
G −1
H 2 = ∑ P(k ) log2 [P(K )]
K =0
Information redundancy, r, is r = b - H2
Where b is the smallest number of bits for which the
image quantization levels can be represented [4].
Information redundancy can only be evaluated if a good
estimate of image entropy is available, but this is not usually
the case because some statistical information is not known. An estimate of H2 can be obtained from a grey-level histogram. If h(k) is the frequency of grey-level k in an image f, and image size is M x N then an estimate of P(k) can be made:

P (K ) = h(k )
MN
Therefore,
G −1
H e = − ∑ P (K ) log 2[P (k )]andr = b − H e
K =0
The Compression ratio K = b / He
Information redundancy is more in natural images while artificial images have low entropy. The experimental results show that images having entropy above 5 can be classified as Natural otherwise Artificial.
Colour: Colour transitions from pixel to pixel have different models in natural and artificial. Natural images depict objects of the real world, and in such a context, it is not common to find regions of constant colour because objects tend to be shaded and have texture [6]. In addition, during the process of taking a photograph, some noise is added to the subject and that causes neighbour pixels to have different RGB values (even when they are supposed to have the same colour).
It is possible to exploit these simple features related
to colours by extracting and analyzing the following
features.
Number of Different Colours
Natural images often have more colour combinations than artificial images. This is because Artificial images tend to have large uniform regions with the same colour. On the Web in particular, graphics with few colour are more popular because they can be compressed in a better way.
The number of different colours of an image is
extracted but it cannot be directly used as metric since the raw number is also dependent on size of the image. Therefore a more accurate metric is used: the rate between the number of different colours and the number of total pixels. A scan of the pixels matrix is performed in order to count different colours. This value is then divided by the total number of pixels.
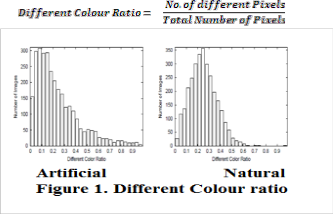
Experimental results show that if the Different Colour ratio is greater than 0.1, the image is classified as natural otherwise artificial.
SATURATION AVERAGE
Natural images depict objects of the real world and highly saturated objects are not very common. Certain
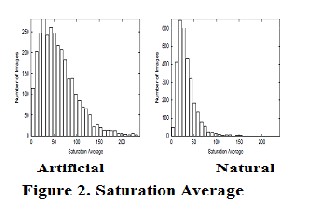
colours are much more likely to appear in artificial images than in Natural ones. For example, cartoons, maps, charts and logos often have large regions covered with highly saturated colours. Those colours are much less frequent in natural images. Some natural images though can have a big saturated area. Given RGB values, the saturation level of a pixel is defined as the greatest absolute difference of values between red green and blue.
Saturation = max [abs(red − green), abs(red − blue), abs(green − blue)]
The average value of the saturation of all pixels in an image is calculated. If it results between 12 and 47, the image
IJSER © 2014 http://www.ijser.org
International Journal of Scientific & Engineering Research, Volume 5, Issue 3, March-2014 1002
ISSN 2229-5518
is classified as natural; otherwise it is classified as artificial.
SPACE CORRELATION
The color analysis gives some good methods for the categorization of images. Though, it does not take in account the spatial correlation of pixels. Different methods have been tested in this paper in order to exploit the different sharpness of the edges and noisiness in pictures.
Sharp transactions in real life objects are not common. In
natural images, edges are often faded and blend in with the
background or with other objects. As opposed to this, objects in artificial images, tend to have very sharp edges [12].
As noisy nature of photographs has been assumed, in a natural image even pixels that are in the same colored area may have a different RGB value.
SPATIAL GRAY-LEVEL DEPENDENCE
Since a simple specific feature for sharpness does not exist, a Spatial Gray-Level Dependence (SGLD henceforth) Histogram has been used. The structure used for analyzing SGLD is a two-dimensional histogram. If a pair of pixels is part of a flat coloured area having the same brightness, an entry nearby the diagonal of the SGLD matrix is incremented [14]. On the other hand, if the pair is on an edge, the two pixels will have a significant difference in brightness if the edge is sharp but they will have similar brightness if the edge is not sharp. The incremented entry is therefore far from the diagonal in the first case and
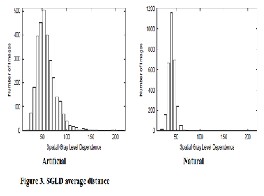
somewhere in the area between the diagonal and the outer corner of the diagram in the second case.
In order to extract this feature, the preliminary step is to
transform the colour space of the in to gray scale. The value
of brightness for every pixel is then available. The brightness
is defined as the average of the red, green and blue colour
components of an image.
Given a pixel, it is paired with all its 8 neighbours. This
means that top-left, top, top-right, left, right, bottom-left,
bottom and bottom-right neighbour are considered. For
each pair (pixel, neighbour) the brightness βp, βn is
extracted and the value in position (βp, βn) is incremented.
At the end of this step, the SGLD matrix is populated with
the information about the brightness similarity of all contiguous pairs of pixels. Then average SGLD distance is calculated. If the average SGLD distance is less than 90, the image is considered as natural otherwise categorized as artificial. Figure 3 shows the curve between SGLD average distance and no. of images.
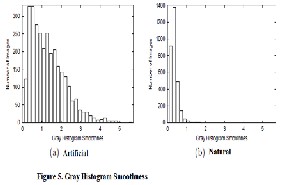
GRAY HISTOGRAM
The gray histogram is the gray scale version of the color histogram. It symbolizes the distribution of colors in an image, derived by counting the number of pixels of each of all gray intensity [17]. The analysis of this histogram can give an inference of the distribution of area having the same color/brightness. In figure 4 it is possible to see the typical difference between a natural picture histogram and a artificial one. The natural histogram example, figure 4, shows an overall smooth trend. The peaks (if any) are not really sharp. This means that the picture has an uniform brightness. In the artificial histogram example figure 4, there are some high and narrow peaks due to the fact that in the picture there are lot of areas having the same brightness.
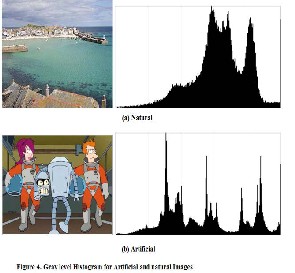
The method used to build the histogram array is simple. For each pixel in the image, the value of the array at the index corresponding to the pixel brightness (0 to 255) is incremented by 1. The histogram is then normalized by dividing the value of all bins by the number of pixels. Once the histogram is done, a value estimating the smoothness is calculated. This value is lower for natural images having a smooth gray histogram and higher for artificial images having an histogram with more spikes. If the smoothness is less than 0.2, image is categorized as natural, otherwise treated as artificial.
IJSER © 2014 http://www.ijser.org
International Journal of Scientific & Engineering Research, Volume 5, Issue 3, March-2014 1003
I
3 METHOD OF CLASSIFICATION
These single features demonstrate promising performance with low computational cost. Since each classifier has its own weakness and strengths, better performances can be achieved using more than one feature together.
This Classifier analyzes each of the mentioned
parameter to create an opinion. The error rate is significantly
REFERENCE
[1] Mislav GrgiC, Mario Ravnjak, Branka Zovko-Cihlar, “Filter Comparison in Wavelet Transform of Still Images”, Industrial Electronics, 1999. Proceedings of the IEEE International Symposium on Volume 1, 12-16 July 1999
Page(s):105 - 110 vol.1.
[2] Robert W. Buccigrossi and Eero P. Simoncelli.“Image
classification via Joint Statistical Characterization”, IEEE
transactions on image processing, vol. 8, no. 12, pp 1688-
1691, December 1999.
[3] Karthik Krishnan, Michael W. Marcellin, Ali Bilgin,
and Mariappan S. Nadar, “Efficient Transmission of
Compressed Data for Remote Volume Visualization”, IEEE
transactions on medical imaging, vol. 25, no. 9, pp1189-1199, September 2006.
[4] Adrian Munteanu, Jan Cornelis, and Paul Cristea, “Wavelet-Based Lossless Compression of Coronary Angiographic Images”, IEEE transactions on medical
imaging, vol. 18, no. 3, pp 272-281, March 1999.
[5] Menegaz, G., L. Grewe and J.P. Thiran, 2000.
Multirate Coding of 3D Medical Data. In proceedings 2000
International Conference on Image Processing, IEEE, 3: 656-
659.
reduced up to 0.1 as compared to the error rates of individual parameter taken separately.
4 CONCLUSION
Each single parameter described has been tested and tweaked changing thresholds and input parameters so that its accuracy is as high as possible. Then the aggregate classifier was tested in order to evaluate the global performance of the system on the data set. Some base classifiers have been implemented and tweaked for the maximum individual accuracy. Single features are combined together using different algorithms with different performances.
A common dataset of manually labeled
natural/synthetic images has been used as test set. This set
has been lately resized to perform the same tests on resized images.
In the best case, the performances achieved are on par or slightly better than previous works.
[6] Galli, A.W., G.T. Heydt and P.F. Ribeiro,
1996.Exploring the Power of Wavelet Analysis. IEEE Computer Application in Power, pp: 37-41.
[7] Sarah Betz, Nirav Bhagat, Paul Murhy & Maureen Stengler, “Wavelet Based Image Compression –Analysis of Results”, ELEC 301 Final Project.
[8] Aleks Jakulin “Base Line JPEG and JPEG2000
Aircrafts Illustrated”, Visicron, 2002.
[9] Paul Watta, Brijesh Desaie, Norman Dannug,
Mohamad Hassoun, “ Image Compression using
Backprop”, IEEE, 1996.
[10] Sergio D. Servetto, Kannan Ramchandran, Michael T. Orchard, “Image Coding Based on a Morphological Representation of Wavelet Data,” IEEE Transaction on Image Processing, 8, No.9, pp.1161-1174, 1999.
[11] Crosswinds,” An Introduction to Image
Classification„,
http://www.crosswinds.net/~sskr/imagecmp/index.htm
(current May 10, 2001)
[12] “Comparative study of Wavelet Families for
Biomedical Image Compression” by Saurav Goyal Master of
Engineering in Electronics Instrumentation and Control
Engineering at Thapar University, Patiala.
[13] ”Still Image Compression Using Wavelet
Transform” by Choo Li Tan School of information
Technology and Electrical Engineering for the degree of
Bachelor of Engineering (Honours) 19th October 2001
[14] DeVore RA, Jawerth BD, Lucier BJ. Image compression through wavelet transforms coding. IEEE Trans. Inf. Theory 1992; 2:719- 746.
[15] Shapiro JM. Embedded image coding using zerotrees of wavelet coefficients. IEEE Tran. SP 1993;
12344562.
IJSER © 2014 http://www.ijser.org
International Journal of Scientific & Engineering Research, Volume 5, Issue 3, March-2014
ISSN 2229-5518
[16] Daubechies I. Orthonormal bases of compactly supported wavelets. Com. App. Math. 1988; 41:909-996.
[17] V. Athitsos, M.J. Swain, and C. Frankel.
Distinguishing photographs and graphics on the world wide web. Proceedings of the IEEE Workshop on Content Based Access of Image and Video Libraries, pages 10-17,
1997.
1004
I£ER 2014 http://WWW.ISer.org