International Journal of Scientific & Engineering Research, Volume 3, Issue 9, September-2012 1
ISSN 2229-5518
Novel Feature Fusion Method of Object
Recognition Using Wavelet Transform
V.Subbaroyan, Dr.Selvakumar Raja
Abstract— In this paper we propose a novel approach to recognize multiple view objects, considering features from frequency as well as spatial domains. A colour descriptor based on HSV histogram is used to obtain the spatial features using the colour moments. The frequency features are obtained using Discrete Wavelet Transform (DWT). The two features are then combined to get a feature s et that describes the object more accurately. The extracted features are used as an input to the K Nearest Neighbor (K-NN) for classification. The evaluation of the system is carried on using COIL database and the performance of the proposed system is studied by varying the training set sizes. The study also includes the effect of noise and occlusion. Experimental results show that the proposed method of object identification is more accurate.
Index Terms— Colour moments, Object recognition, Gradient, Histogram, KNN Classifier, Texture, Wavelet transform
—————————— ——————————
In computer vision, object recognition is the task of finding a given object in an image or video sequence. Humans can easi- ly identify an object from its image, even if the object is only partly visible or even if it appears different when the image is captured at different angles. This task is still a challenge for computer vision systems in general. It is important that the set of features extracted from the training image is robust to changes in image scale, noise, illumination and local geometric distortion, for accurate and reliable object recognition.
In order to realize this task, more features could be ex- tracted from the image and the obtained features could be compared with the features available in the data base. To im- prove the accuracy in recognizing an object, different methods based on Gradient, Histogram or Texture could be used.
For a service robot, accurate object recognition is very es- sential. The robot can initially imitate human behavior [4] and then improve through continuous contact with the environ- ment. Complex systems that involve object grasping [1], [6] and manipulation [7] with appropriate feedback may be ne- cessary for task learning by instruction [5]. If the kinematics of robot arm/hand system [9] is the same as for the human, a one-to-one mapping approach may be considered. This is, however, seldom the case.
The problems arising are not only related to the mapping between different kinematics chains for the arm/hand systems but also to the quality of the object pose evaluation [10] pro- vided by the vision system. Hence object recognition is of pa- ramount importance in the case of service robots.
————————————————
V.Subbaroyan is currently pursuing Ph D research program in Eelctronics
& Communication Engineering in Sathyabama University, India, PH-
919677239827. E-mail: v_subbaroyan@yahoo.com
Dr.Selvakumar Raja is currently working as professor in the department of
Computer Science Engineering, at Arunai College of Engineering, Thiru-
vannamali, India, PH-919840091489. E-mail: selvakumarrja@yahoo.com
Although generic object recognition and classification have been one of the goals of computer vision scientists since its beginnings, there are still a number of major obstacles for achieving this goal. However, in terms of the identification of known objects in different poses considering novel viewing conditions, significant progress has been made recently. The two main approaches to the problem are look and shape/model based methods [16]. Appearance based ap- proaches [10], [3] represent an object in terms of several object views, commonly raw brightness images. By acquiring a set of object images or suggestive views an appearance based object model is constructed.
Fourier descriptors [13] are used to produce a set of norma- lized coefficients which are invariant under affine transforma- tions. The method is demonstrated on silhouettes of aircraft. Since the shapes of airplanes are more or less planar when seen from large distances, they give rise to affine transforma- tions when rotated in 3D. Hence, the method is ideal for this specific task.
Syntactic matching of curves [15] has also been used for ob-
ject recognition. Curve is represented by an ordered list of
shape primitives, and syntactic matching between two curves is performed by energetic programming. The syntactic match-
ing is only used to align the curves and then proximity match- ing is used to measure the similarity between the shapes. This method [14] can be applied to open curves.
Many studies have been made for object recognition based on feature descriptors. The most important feature descriptors [8] are Invariant features, Hu’s moments [17], Zernike’s mo- ments [18] and Fourier-Mellin transform features [12], [13] , local descriptor SIFT [19] and local Zernike with Majority Vot- ing approach LZMV [20]. Some feature descriptors have been developed recently using Grey Level Co-occurrence Matrix [21]. Multi-resolution analysis has recently been proposed as new method for feature extraction and image representation. In the proposed method the Discrete Wavelet Transform (DWT) approach has been tried as a tool for the multi-
IJSER © 2012
International Journal of Scientific & Engineering Research Volume 3, Issue 9, September-2012 2
ISSN 2229-5518
resolution analysis and it has been applied to texture analysis and classification. After reviewing related work [21] for the recognition of objects, three robust approaches based on gra- dient, histogram and texture along with DWT are proposed for object recognition.
The proposed method for object recognition is based on spa- tial and frequency domain features that represent the objects. The proposed gradient and histogram methods are based on spatial domain features and the texture based method is based on frequency domain features.
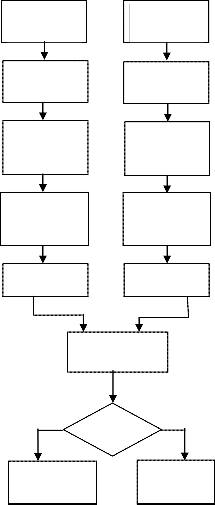
The proposed gradient based method uses Sobel edge empha- sizing filter. The block diagram of proposed gradient based
proximation of the gradient of the image intensity function. The Sobel operator is based on convolving the image with a small, separable, and integer valued filter in horizontal and vertical direction and is therefore relatively inexpensive in terms of computations.
Mathematically, the gradient of a two-variable function (here the image intensity function) at each image point is a 2D vector with the components given by the derivatives in the horizontal and vertical directions. That is, the result of the So- bel operator at an image point which is in a region of constant image intensity is a zero vector. At a point on an edge it is a vector which points from darker to brighter values. The opera- tor uses two 3×3 kernels which are convolved. The horizontal and vertical derivative approximations are computed using (1) and (2) respectively.
method is shown in Fig. 1
1 2
G 0 0
1 2
1
0 * A
1
(1)
Query Image
(Q)
Read intensity
Input Image
(I)
Read intensity
1 0
G 2 0
1 0
1
2 * A
1
(2)
values (Query)
Convert from
RGB to Grayscale
values (DB)
Convert from
RGB to Grayscale
where * denotes the 2-dimensional convolution operation and
A denotes the image. The x-coordinate is here defined as
increasing in the "right" direction, and the y-coordinate is de-
fined as increasing in the ―down" direction. At each point in
the image, the resulting gradient approximations can be
combined to give the gradient magnitude, using (3)
Create predefined
Create predefined
![]()
G Gx
G y
(3)
2-D filter
2-D filter
Using this information, the gradient's direction θ is calculated by using (4)
tan 1 G y
(4)
Filtering Filtering
![]()
Gx
Similar Object
2-D correlation
Co-efficient
Is C > Th
Non-similar
Object
For example, θ is 0 for a vertical edge which is darker on the left side. Finally 2D correlation coefficients are computed for the images in the database. If the correlation coefficients C between the two images are more than a predefined threshold Th, then the two images are identical or they represent similar objects. The one with the highest recognition is recognized as the most similar object.
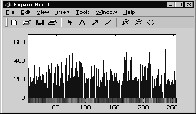
The proposed histogram based method is built using global colour histogram and quadratic distance metric. Global color histogram is used to extract the color features of images.
The colour histogram of two images Q and I are shown in
Fig. 1. Block Diagram of Gradient based method
The given input image is converted into gray scale image. The main stage in the gradient based method is the creation of a correlation kernel. The Sobel operator is used for edge detec- tion. It is a discrete differentiation operator, computing an ap-
fig. 2 and fig.3. It can be seen from the color histograms of two images Q and I, that the color patterns observed in the color bar are totally different. In the Minkowski method as shown in fig. 4, comparison is made only between the same bins of the two colour histograms.
IJSER © 2012
International Journal of Scientific & Engineering Research Volume 3, Issue 9, September-2012 3
ISSN 2229-5518
The middle term is the Similarity Matrix A which helps to find the quadratic distance between two colour images pre- cisely. The similarity matrix is obtained through a complex formula given by (6).
v
![]()
v 2 s Cosh s Cosh 2 s Sinh s Sinh 2 12
Fig. 2. Colour Histogran of Image Q
Aq ,i
1 q i![]()
q q i i
5
q q i
i
(6)
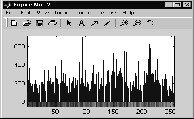
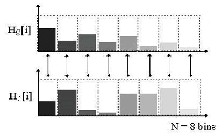
Fig. 3. Colour Histogran of Image I
Fig. 4. Minkowsky Distance Metric
A better method is to use the Quadratic Distance metric. In this method, the colour images are first converted to HSV sys- tem and the hue values are compared. It then compares one colour bin of HQ with all the colour bins of HI to find out the similarity, as shown in fig. 5.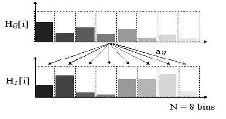
Fig. 5. Quadratic Distance Metric
The quadratic distance between the two images is cal- culated using (5)
Where A is the Similarity Matrix for images q and i
vq is the value of the pixel of the Query image q
vi is the value of the pixel of the Database image i
sq is the saturation of the pixel of the Query image q
si is the saturation of the pixel of the Database image i hq is the Hue of the pixel of the Query image and q
hi is the Hue of the pixel of the Database image i
The process of comparison is continued until all the color bins of HQ have been compared. Finally, we get an N x N ma- trix, where N represents the number of bins.
If two images are exactly similar, then the Similarity Matrix becomes the Identity Matrix with diagonal of the consisting of only ones while all other elements have value zero, as shown in fig. 6. In this case the quadratic distance obtained will be zero.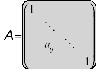
Fig. 6. Identity Matrix
For images which are not exactly similar, the final result d(q,i) represents the color distance between the two images. The closer the distance is to zero, the closer the images are in color similarity. Farther the distance from zero, the images are less similar.
The pyramid-structured wavelet transform is used for this proposed texture based recognition method. Its name comes from the fact that it recursively decomposes sub signals in the low frequency channels. It is mostly significant for textures in an object with dominant frequency channels.
Using the pyramid-structured wavelet transform, the ob- ject image is decomposed into four sub-bands, in low-low, low-high, high-low and high-high sub-bands, as shown in
d 2 q, i (H
H i ) A(H q
H )t
(5)
Figure 7. This is the first level decomposition of the Wavelet.
This equation gives the square of the distance and hence square root of the value obtained gives the quadratic distance. The first term on the right hand side is the difference between two color histograms or more precisely the difference in the number of pixels in each bin. This term is obviously a vector since it consists of one row. The number of columns in this vector is the number of bins in a histogram. The third term is the transpose of that vector.
LL | HL |
LH | HH |
Fig. 7. Discrete Wavelet Transform decomposition
IJSER © 2012
International Journal of Scientific & Engineering Research Volume 3, Issue 9, September-2012 4
ISSN 2229-5518
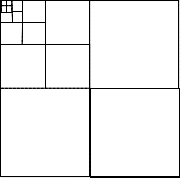
The low-low sub-band of the first level is then decomposed further in the same way to get the second level of the Wavelet Transform. The same procedure is continued for getting fur- ther levels of Wavelet Transformation. Five level Wavelet Transform is shown in fig. 8.
LL HL
LH HH
Fig. 8. 5 level Discrete Wavelet Transform decomposition
The proposed system is built based on DWT of the image and the colour moments of the image.
In the proposed Feature Fusion based method, two level Wavelet transform is used to get the frequency features of an object from its image. In addition, spatial features are obtained from the three colour moments for each of the three basic co- lours. The features obtained from both the approaches are then fused or appended together to get a single set of features.
Three central color moments are used as features along with the wavelet energies. They are Mean, Standard Deviation and Skewness. Moments are calculated for R, G and B color channels of the image separately. Hence, an image is characte- rized by 3 moments for each of the 3 color channels and totally there are 9 moments for each object. The color moments are represented as follows:
Mean, the average color value in the image is calculated using
(9).
N 1
In the proposed Texture based method, five level Wavelet Transform is used. After getting the Low-Low sub-bands of the five levels, the energy (E) of the sub-band is extracted us- ing (7)
Where![]()
X i X i , j
j 1
i is the colour channel (1 – 3 for R,G,B)![]()
is the Mean value of the image for the ith colour
i
(9)![]()
1 M N
j is image number![]()
![]()
E ![]() xi, j
xi, j
MN i 1 j 1
(7)
N is the total number of images in the Database![]()
is the Mean value of the image for the ith colour
Where M and N are the dimensions of the image, and x is the
X i , j
for the Nth image
intensity of the pixel located at row i and column j in the sub-
band.
For five level DWT, there will be [(5 x3) + 1] = 16 sub-bands
Standard Deviation, the square root of the variance of the dis- tribution, is obtained using (10).
in all. Using (7), the energy level of the sub-bands is calculated. These energy level values are stored in a database and further used in the recognition stage by using Euclidean
i
1 N 2
N j 1
(10)
distance algorithm. The recognition algorithm is as follows:
1. Decompose the query image
2. Get the energies of all sub-bands using (7)
3. Euclidean distance (Di) between the energy of the Query image (Q) and the energy of the ith image in the database, is
calculated using (8).
Where σi is the Standard Deviation value of the image for the ith colour channel
Skewness, a measure of the degree in the distribution and it is obtained using (11).![]()
1 X X 3
s 3
(11)
Di
xk
2
yi ,k
(8)
i
j 1
i , j i
k 1
k is the number of sub-bands (16 for 5 level DWT)
xk is the energy of image Q at sub-band k
i is the total number of images in the Database
yi,k is the energy of image i in the Database at sub-band k
4. Increment i and repeat from step 3.
Using the above algorithm the query image is searched in the image database. The Euclidean Distance is calculated be- tween the query image and every image in the database. This
Where si is the Skewness of the ith colour
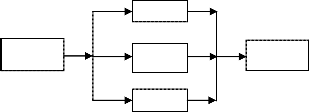
The Block diagram of the proposed system for getting the frequency and colour moments of an object from its image are shown in fig. 9 and fig. 10 respectively.
The proposed system is built based on DWT of the image and the colour moments. The block diagram of the proposed object recognition system is shown in fig. 11.
process is repeated until query image is compared with all the images in the database. Upon completion of the Euclidean distance algorithm, an array of Euclidean distances are obtained and then sorted. The image in the data base which
Input Color Image
2 Level Wavelet Transform
Subband
Extraction
Energy
Value
Freq. Features
has the least Euclidian distance is then recognized as the most similar image.
Fig. 9. Block diagram of the system for getting frequency features
IJSER © 2012
International Journal of Scientific & Engineering Research Volume 3, Issue 9, September-2012 5
ISSN 2229-5518
Input Color
Image
Mean
Standard deviation
Skewness
Spatial
Feature Set
For object recognition, each feature of the Query image is compared with all the features of every image in the database, using Euclidian algorithm mentioned earlier.
In Object recognition, the k-nearest neighbor algorithm (K- NN) is a method for recognizing objects based on closest train- ing examples in the feature space. K-NN is a type of instance-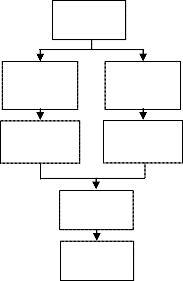
Fig. 10. Block diagram of the system for getting colour moments for a particular colour channel
Input color
Image
based learning where the function is only approximated local- ly and all computation is deferred until classification. In K- NN, an object is classified by a majority vote of its neighbors, with the object being assigned to the class most common amongst its k nearest neighbors (k is a positive integer, typi- cally small). If k = 1, then the object is simply assigned to the class of its nearest neighbor. The neighbors are taken from a set of objects for which the correct classification is known. This
Two level
Wavelet
Transformation
Separate the
Colour Channels (R, G & B)
can be thought of as the training set for the algorithm, though no explicit training step is required.
The block diagram of the proposed Object Recognition
Energy
Calculations
Color Moments for each color channel
Unknown
Separate
Feature
KNN
Recognized
image
channel
Feature
Fusion
Feature
Vector
Feature
Vector
Fig. 11.Block diagram of the proposed system for getting the features
The input object image is first decomposed by using the DWT for 2 levels. The energy of all the sub-bands of the input colour image is used as feature vectors individually. The ener- gy is calculated by using (12)
1 R C
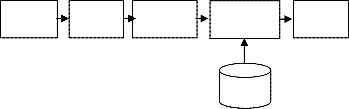
Fig. 12. Block diagram of the Classification stage
The K-NN classifier compares the features of the Query im- age with the features of the different images already classified and stored in the data base. It calculates the Euclidian distance between the feature values and classifies the query object to one of the classes in the database based on the similarity.
In this section, the experimental results and their implica-![]()
Ek
![]()
![]() xk i, j
xk i, j
(12)
tion are discussed. The performance of the proposed systems
Where
RC i 1
j 1
is carried on using two databases namely our own database and the COIL database. The performance metric used to eva-
k is the total number of side-bands (7 for 2 – DWT) Ek is the Energy at the kth sub-band of the image xk(i,j) is the pixel value of the kth sub-band
R is the height of the sub-band and
C is the width of the sub-band
The total number of features obtained is 16, out of which the first 7 correspond to the 2 level DWT or the frequency fea- ture and the next 9 correspond to the 9 colour moments or to the spatial features. The obtained features are then fused or appended and stored in a single row with 16 features for each image of an object. The obtained feature vector values are di- vided by the maximum value of the element in that row. In this way every component of the feature vector is normalized to the range [0:1].
luate the proposed systems is recognition rate in percentage.
To evaluate the performance of the proposed object recog-
nition system, many computer simulations and experiments with objects from our own database were taken first. Next, the
proposed system was checked with the COIL database.
The system is implemented in MATLAB version 7.6. The training and tests are run on a standard PC (1.66 GHz INTEL processor, 1 GB of RAM) running under Windows XP. Fig. 13 shows the test image from our database and fig. 14 shows test images from the COIL Database. Our own database consists of objects having uniform color properties such as cups, cut- lery, fruits etc with different orientation. This database is used to evaluate the performance of the proposed gradient, histo- gram and texture based method. The recognition rate of the three proposed methods are tabulated and shown in Table 1
IJSER © 2012
International Journal of Scientific & Engineering Research Volume 3, Issue 9, September-2012 6
ISSN 2229-5518
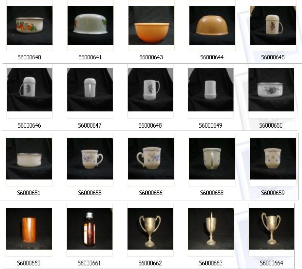
Fig. 13 Test Images from our database

Fig. 14 Test Images from COIL database
Table 1. Performance of the proposed system using our own database
The number of samples per object given for training is va- ried from 75% (54 views per object) to 2.5% (2 views per ob- ject). The recognition rate in percentage is tabulated for each of the training dataset. Table 2 shows the performance of the proposed system using COIL database with uniform back- ground, with and without normalization, along with the exist- ing Gray Level Co-occurrence Matrix (GLCM) dataset. The corresponding graphical representation is shown in fig. 16. The legends used for the graphical representation is given in fig. 15.
Table 2. Performance of the proposed system using
COIL database with uniform background
Number of train- ing samples per object | Recognition rate (%) with uniform background | |||
Number of train- ing samples per object | Existing Method | Proposed Method | ||
Number of train- ing samples per object | GLCM +Edge histogram | GLCM colour moments | Wavelet + colour moments (without nor- malization) | Wavelet + colour moments (with norma- lization) |
75 | 99.56 | 95.28 | 97.92 | 98.24 |
50 | 99.11 | 95.11 | 96.76 | 97.61 |
25 | 98.83 | 91.33 | 96.29 | 99.72 |
20 | 98.40 | 91.18 | 95.38 | 99.72 |
10 | 97.08 | 85.83 | 92.58 | 99.35 |
4 | 92.79 | 77.09 | 88.89 | 98.29 |
2 | 84.74 | 56.54 | 72.69 | 94.90 |
![]()
![]() Proposed Method (with Normalization) GLCM + Edge Histogram
Proposed Method (with Normalization) GLCM + Edge Histogram
Proposed Method (without Normalization)
GLCM + Colour Moments
Fig. 15 Legends used for the graphical representation
The proposed method is then tested on Columbia Object Image Library Dataset (COIL-100) available online. A CCD color camera with a 25mm lens was fixed to a rigid stand about 1feet from its base. A motorized turntable was placed about 2 feet from the base of the stand. The turntable was ro-
100
90
80
70
60
50
2 4 10 20 25 50 75
Training samples per object
tated through 360 degrees and 72 images were taken per ob-
ject; one at every 5 degrees of rotation. The size of image in the
database is 128 x 128 and the number of objects in the data base is 100.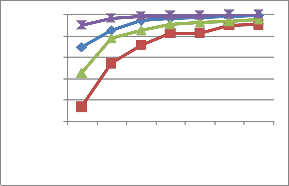
Fig. 16 Graphical representation of recognition rate obtained from the
proposed system with COIL database and with uniform background
The sensitivity of the proposed method to noisy data is also tested by introducing Gaussian noise to the sample images
IJSER © 2012
International Journal of Scientific & Engineering Research Volume 3, Issue 9, September-2012 7
ISSN 2229-5518
before the classification. The same test is conducted for the images with a noise of 10% Standard Deviation. The obtained result is shown in Table 3 and the graphical representation is shown in fig. 17.
Table 3 Performance of the proposed system using COIL
database with noise of SD = 10%
100
90
80
70
60
50
40
30
20
2 4 10 20 25 50 75
Training samples per object
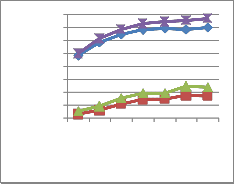
Fig. 18 Graphical representation of recognition rate obtained from the proposed system with COIL database and with noise of SD 20%
100
90
80
70
60
50
40
30
20
2 4 10 20 25 50 75
Training samples per object
The experiment is also extended further to see whether ob- jects are recognized properly by the proposed method, when they are partly occluded. 12.5% and 20% of occlusion are cho- sen here. The recognition rate is obtained by using K-NN clas- sifier and the results are shown in Table 5 and Table 6 for
12.5% and 20% occlusion respectively. The graphical represen- tation is shown in fig. 19 and fig.20 respectively.
Table 5 Performance of the proposed system using COIL
database with partial occlusion of 12.5%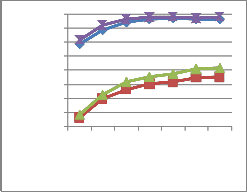
Fig. 17 Graphical representation of recognition rate obtained from the proposed system with COIL database and with noise of SD 10%
To have a better study of the impact of noise on the images, the above tests are carried out for noise with Standard devia- tion 20%. Table 4 and fig. 18 show the obtained results and the graphical representation respectively.
Table 4 Performance of the proposed system using COIL
database with noise of SD = 20%
Table 6 Performance of the proposed system using COIL
database with partial occlusion of 20%
Number of training samples per object | Recognition rate (%) with partial occlusion of 20 % | |||
Number of training samples per object | GLCM +Edge histogram | GLCM colour moments | Wavelet + colour moments (without normalization) | Wavelet + colour moments (with normalization) |
75 | 96.72 | 38.39 | 43.02 | 99.50 |
50 | 96.75 | 38.39 | 41.86 | 98.83 |
25 | 95.59 | 36.28 | 41.56 | 98.09 |
20 | 95.14 | 39.61 | 41.35 | 96.88 |
IJSER © 2012
International Journal of Scientific & Engineering Research Volume 3, Issue 9, September-2012 8
ISSN 2229-5518
10 | 93.59 | 39.06 | 41.00 | 95.53 |
4 | 88.93 | 32.96 | 36.46 | 92.43 |
100
80
60
40
20
2 4 10 20 25 50 75
Training samples per object
After getting the results, a comparative study of the proposed system is made with the existing methods such as Global Zernike, Local Zernike, Local Hu, Local Fourier-Melin, LZMV, SIFT and Maja Rudinac methods.
Four parameters have been taken for comparison. First the comparative analysis is made for images with uni- form background. Next comparison is made for the proposed system with the exixting methods for images with noise of standard deviation 10%. It is repeated for images with noise of standard deviation 20%. Finally another comparison is made for the proposed system with the existing system for images with an occlusion of 12.5%.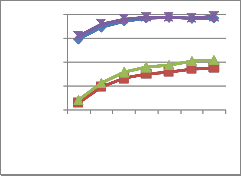
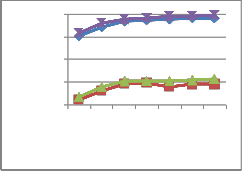
Fig. 19 Graphical representation of recognition rate obtained from the proposed system with COIL database and with occlusion 12.5%
100
80
60
40
20
Table 5.7 shows the comparative analysis. The graph- ical representation of the comparative analysis is given by Figure 21.
One more comparative analysis is made with regard to the training sizes. The result of the comparative analysis for training sizes of 10%, 20%, 25%, 50% and 75% are tabulated in Table 5.8. The graphical representation of the comparison is shown in Figure 22.
2 4 10 20 25 50 75
Training samples per object
Fig.20 Graphical representation of recognition rate obtained from the proposed system with COIL database and with occlusion 20%
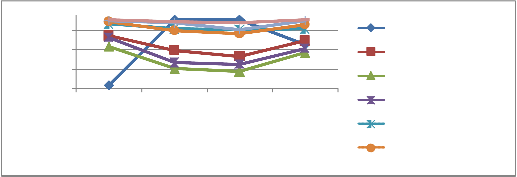
Table 7 Comparative analysis of the proposed system using COIL database with different conditions
Type of Analysis | Comparative analysis | |||||||
Type of Analysis | Global Zer- nike | Local Zer- nike | Local Hu | Local Fourier Me- lin | LZMV | SIFT | Maja Rudinac | Proposed method |
Uniform Back- ground | 31.8 | 83.1 | 72.13 | 81.50 | 95.66 | 98.12 | 99.56 | 98.24 |
Noise = 10 | 100 | 68.3 | 48.92 | 55.17 | 90.6 | 88.89 | 96.72 | 98.11 |
Noise = 20 | 100 | 62.2 | 45.74 | 53.82 | 90.2 | 85.46 | 90.06 | 97.17 |
Occlusion | 74.7 | 77.9 | 65.47 | 70.45 | 90.4 | 95.13 | 99.17 | 99.98 |
89
69
49
29
Uniform
Background
Noise = 10 Noise = 20 Occlusion
Global Zernike Local Zernike Local Hu
Local Fourier Melin
LZMV
SIFT
IJSER © 2012
International Journal of Scientific & Engineering Research Volume 3, Issue 9, September-2012 9
ISSN 2229-5518
Fig 21 Graphical representation of comparative analysis of the proposed feature fusion method with different conditions
Table 5.8 Comparative analysis of the proposed system using COIL database with varying training size
Training Size | Comparative analysis | |||||||
Training Size | Global Zer- nike | Local Zer- nike | Local Hu | Local Fourier- Melin | LZMV | SIFT | Maja Rudinac | Proposed method |
10% | 60.21 | 80.94 | 55.85 | 62.18 | 86.57 | 53.2 | 97.08 | 99.35 |
20% | 62.58 | 87.31 | 60.44 | 65.58 | 91.75 | 96.5 | 98.4 | 99.72 |
25% | 68.90 | 94.00 | 70.56 | 81.71 | 95.9 | 100 | 98.83 | 99.72 |
50% | 84.60 | 94.10 | 74.23 | 85.7 | 98.2 | 100 | 99.11 | 99.57 |
75% | 91.90 | 97.70 | 80.24 | 89.56 | 99.1 | 100 | 99.56 | 99.82 |
100
90
80
70
60
50
10% 20% 25% 50% 75%
Global Zernike Local Zernike Local Hu
Local Fourier Melin
LZMV SIFT
Local Fourier Melin2
Proposed method
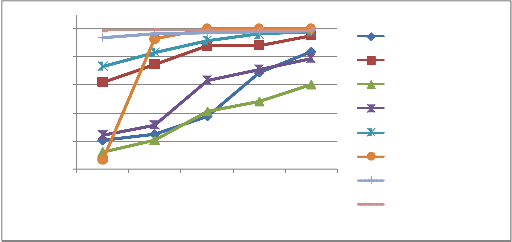
Fig. 22 Graphical representation of comparative analysis of the proposed feature fusion method with varying training samples per object
The proposed method attempts to develop a new technique for object recognition. Object recognition systems based on spatial and frequency domain features are presented. The gradient and histogram methods for object recognition based on spatial domain features recognize the objects in an image, independent of their shape, orientation accurately, but not for the images with less colour variation. The texture me- thod using Wavelet Transform based on frequency domain features recognize objects with colour variance and those with intricate patterns. Experimental results show that the gradient and histogram methods are successful in recognizing the ob- jects and the successful recognition rate is 93.3%. The success- ful rate of the texture based method based on DWT is still bet- ter and it is 96.6%.
In this paper, we have proposed a novel method for the recognition of multiple view object, based on DWT and by fusing the spatial and frequency features together. This method provides a better recognition rate. It is found that the spatial features is
very powerful feature as it includes the local information and embedding these features with the frequency features produces excellent performance in object recognition. The proposed me- thod is quite robust to changes in noise and occlusion. The recog- nition rate is quite high even when there is substantial noise and occlusion.
[1] Bicchi A. and Kumar V., ―Robotic grasping and contact: A re- view,‖ in Proceedings of the IEEE International Conference on Robotics and Automation, ICRA’00, 2000, pp. 348–353.
[2] Nelson R. and Selinger A., ―A cubist approach to object recog-
nition,‖ in ICCV’98, 1998, pp.614–621.
[3] Bjorkman M. and Kragic D., ―Combination of foveal and peri- pheral vision for object recognition and pose estimation,‖ Pro- ceedings. IEEE International Conference on Robotics and Auto- mation, ICRA’04, vol. 5, pp. 5135 – 5140, 2004.
IJSER © 2012
International Journal of Scientific & Engineering Research Volume 3, Issue 9, September-2012 10
ISSN 2229-5518
[4] Kaiser M. and Dillman R., ―Building elementary robot skills from human demonstration,‖ Proceedings of the IEEE Interna- tional Conference on Robotics and Automation, v. 3, pp. 2700–
2705, 1996.
[5] Chen J. and Zelinsky A., ―Programming by demonstration: removing suboptimal actions in a partially known configuration space,‖ Proceedings of the IEEE Intl. Conf. on Robotics and Au- tomation (ICRA ’01), vol. 4, pp. 4096–4103, 2001.
[6] Ekvall S. and Kragic D., ―Interactive grasp learning based on human demonstration,‖ in Proc. IEEE/RSJ International Confe- rence on Robotics and automation, ICRA’04, 2004.
[7] Petersson L., Jensfelt P., Tell D., Strandberg M., Kragic D., and Christensen H. I., ―Systems integration for real-world manipula- tion tasks,‖in IEEE International Conference on Robotics and Automation, ICRA 2002, vol. 3, 2002, pp. 2500 – 2505.
[8] Chaumette F., ―Image moments: a general and useful set of
features for visual servoing,‖ IEEE Trans. on Robotics, vol. 20 (4),
2004.
[9] Taylor G. and Kleeman L., ―Grasping unknown objects with a humanoid robot,‖ Australiasian Conference on Robotics and Au- tomation, 2002.
[10] Ekvall F. H. S. and Kragic D., ―Object recognition and pose estimation for robotic manipulation using color co-occurrence histograms,‖ in Proc. IEEE/RSJ International Conference Intelli- gent Robots and Systems, IROS’ 03, 2003.
[11] Selinger A. and Nelson R, ―A perceptual grouping hierarchy for appearance - based 3d object recognition,‖ CVIU, vol. 76, no. 1, pp. 83– 92, October 1999.
[12] Derrode and F. Ghorbel (2001), ―Robust and efficient Fouri- er-Mellin transform approximations for invariant grey-level im- age description and reconstruction‖, In Computer Vision and Image Understanding, 83(1):57-78
[13] Arbter K., Snyder W. E., Burkhardt H., and Hirzinger G.,
―Application of affine-invariant Fourier descriptors to recognition
of 3-d objects.‖ IEEE Trans. Pattern Anal. Mach. Intell., vol.12, no.
7, pp. 640–647, 1990.
[14] Singh R. and Papanikolopoulos N., ―Planar shape recognition by shape morphing.‖ Pattern Recognition, vol. 33, no. 10, pp.
1683–1699, 2000.
[15] Gdalyahu Y. and Weinshall D., ―Flexible syntactic matching of curves and its application to automatic hierarchical classifica- tion of silhouettes.‖ IEEE Trans. Pattern Anal. Mach. Intell., vol.
21, no. 12, pp. 1312–1328, 1999.
[16] Christopoulos Vassilios N. and Schrater Paul,‖ Handling shape and contact location uncertainty in grasping two- dimensional planar objects‖ Proceedings of the 2007 IEEE/RSJ International Conference on Intelligent Robots and Systems, San Diego, CA, USA, Oct 29 - Nov 2, 2007.
[17] M.K. Hu (1962), ―Visual pattern recognition by moment inva-
riants‖, In Proc. IEEE Transactions on Information Theory, 8:179-
187
[18] A. Khotanzad and Y. Hua Hong (1990), ―Invariant image rec- ognition by Zernike moments‖, In Proc. IEEE Transaction on Pat- tern Analysis and Machine Intelligence, 12(5):489-497.
[19] D. Lowe (2004), ―Distinctive image features from scale- invariant key-points‖, In International Journal for Computer Vi- sion, 60(2):91-110
[20] J. Friedman (1996), ―Another approach to polychotomous classification‖, Technical report, Department of Statistics, Stanford University
[21] J. Friedman (2010), ―A fast and Robust descriptor for multiple views object recognition‖, International Conference on Control, Automation, Robotics and Vision, ICARVC, 2010, Singapore, pp2166 - 2171
IJSER © 2012