International Journal of Scientific & Engineering Research, Volume 6, Issue 5, May-2015 1754
ISSN 2229-5518
Natural Approach towards Mitigating Noise Pollution: A Case
Study of Covenant University
Marvel L. Akinyemi, Moses E. Emetere and Iyanuoluwa E. Ogunrinola
Physics Department, Covenant University, Canaan land, Ota, Nigeria
Abstract
The study of science has out-grown mere speculation. Scientifical procedure was adopted to verify if trees should be planted close to the noise source rather than the area to be protected. Six locations were selected in Ota, Nigeria. Data set obtained from the digital sound level meter was used to model the noise levels. The first location, the power generator behind the university chapel had trees around and the overall noise reduction was 12.5dB. The overall noise reduction in the second location was
47.12dB. Reduction from other locations was between 16dB to 25dB. Hence, if wind dynamics is excluded, trees should be planted close to the noise source rather than the area to be protected.
Keywords: noise pollution, trees, sound level, simulations, Matlab
Introduction
Noise pollution is referred to as acoustic smog i.e. the accumulation of different kinds of unplesant sounds. Like community noise, environmental noise pollution is a form of air pollution which is associated to physiological effects that threatens health and well-being (Lisa et al., 2007). Noise pollution is expected to increase due to continuous growth of air, road, and railway traffic which are one of the main sources of urban environmental noise. The use of natural control means has been investigated to control noise pollution. For example, the reduction of noise in urban cities with the aid of trees had been established (Dietrich et al., 2003). Trees have been found to play a very significant role in the control of noise pollution. Research has also shown that trees can cut down noise by five to ten decibels thereby reducing noise by fifty percent. This feat was achieved via tree species, trunk diameter, and number of trees per unit area, leaf area, bark, and the ground (Dietrich et al., 2003). Trees muffle urban noise almost as effectively as stone walls. They are better at absorbing high- frequency sounds, which are most bothersome to human ears, than they are at absorbing low frequency sounds. Trunks and branches play a very important role in sound scattering due to their
solid nature. Scattering is directly proportional to frequency i.e. there is increased scattering with
IJSER © 2015 http://www.ijser.org
International Journal of Scientific & Engineering Research, Volume 6, Issue 5, May-2015 1755
ISSN 2229-5518
increased frequency and this becomes relevant especially when the wavelength draws close to the size of the scatterers. When planting trees as noise buffers, the distance from the noise source and likewise the distance from the area to be protected are very vital. The trees should be planted close to the noise source rather than the area to be protected this is because when trees are planted close to the noise source, a very large percentage of noise will be blocked out before it spreads out to the surroundings. This assumption has not been verified scientifically. Hence the objective of this paper is to investigate likely scenarios to affirm or rebuff the assumptions illustrated above.
Data Acquisition
The area chosen for study is Covenant university, a private institution located in ota, Ogun state Nigeria. This study is to determine the effect of trees on noise pollution. The sources of noise pollution under study are the power generating sets (about five of them), student chapel, vehicular, student cafeterias, sport centers, lecture halls, and hostels. Covenant University is located in Ota, Ogun state. Ogun state is located in the south western zone of Nigeria, situated between Latitude
6.2°N and 7.8°N and Longitude 3.0oE and 5.0°E. The climate of Covenant University is therefore the
same with that of Ogun state where it is located. Covenant University is rich with a variety of trees especially those suited for the environmental climate. Flowers are also grown in all locations for environmental beautification (as shown in figure 1). A total of six locations were selected for this research (as mentioned above). The equipment used is a digital sound level meter (mannix testing and measurements model - DSM8922). The equipments measuring range 30 to 130 dB and a resolution of
0.1 dB. DSM8922 has a frequency range of 31.5 Hz to 8KHz which conforms to the EN 50081-
1/1992 and EN 50082-1/1997 standards. DSM8922 is electromagnetically compatible with high safety precision. Noise measurements were carried out 50m away from noise source and every 5m towards the noise source and the measurements were taken in the afternoon (2:00-3:00pm) during the peak of the days’ work in order to get the maximum noise from the various selected locations. The basic precautions taken to ensure accuracy includes ensuring that the digital sound level meter was held at a distance not less than 1m away from any reflecting object and at a height of 1.2m above the
ground in accordance with the European Union (EU) Directive 86/188/EEC.
IJSER © 2015 http://www.ijser.org
International Journal of Scientific & Engineering Research, Volume 6, Issue 5, May-2015 1756
ISSN 2229-5518
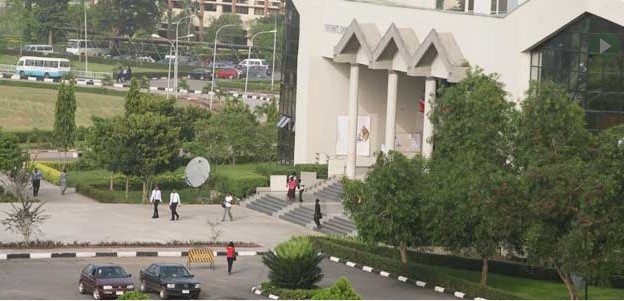
Figure 1: View of the university chapel
There were two areas of measurement: the open area (without trees to interrupt noise being measured), then the ‘tree’ area. The ‘tree’ area which was few meters away from the zero point. In the
‘tree’ area, the first point which was the zero point was a few meters from the trees under observation, the second point was 5m away from the zero point (not 5m away from the trees), and the third was
10m away from the zero point and so on up to 30m from the zero point. Measurements were taken at these points and recorded. Ten observations were carried out at each point.
Noise pollution indices
We adopted the Gaussian positional technique to calculate the noise pollution of each location. Here, we adopted various positions ranging from P 1 to P50 which was obtained directly from sampled data. Like the Gaussian percentile technique (Rajiv et al., 2012), the noise climate (NC) was obtained. The
NC can be used to determine the Equivalent Continuous Noise Level (𝐿𝑒𝑞 ) and Noise Pollution Level
(𝐿𝑛𝑝 ).
𝑁𝐶 = 𝐿𝑚𝑎𝑥 − 𝐿𝑚𝑖𝑛 [1]
IJSER © 2015 http://www.ijser.org
International Journal of Scientific & Engineering Research, Volume 6, Issue 5, May-2015 1757
ISSN 2229-5518
𝐿𝑒𝑞 = 𝐿𝑥 + �

(𝑁𝐶)2 � [2]
60
𝐿𝑛𝑝 = 𝐿𝑒𝑞 + 𝑁𝐶 [3]
Here, 𝐿𝑥 are the various positions obtained directly from sampled data. The equivalent noise level can
be used to obtain both the day time and night time noise levels (Olayinka, 2008). However, we
adopted the formular to capture the reflectivity or absorbance of the trees as buffer.

𝐿 = log �1
2
��10
𝛽𝐿𝑀
�10� + �10
𝛽𝐿𝐴
�10��� [4]
where 𝐿𝐷 is the Day time noise level, 𝐿𝑀 is the equivalent sound pressure for the morning measurement, 𝐿𝐴 is the equivalent sound pressure level for the afternoon measurement, 𝛽 is the buffer
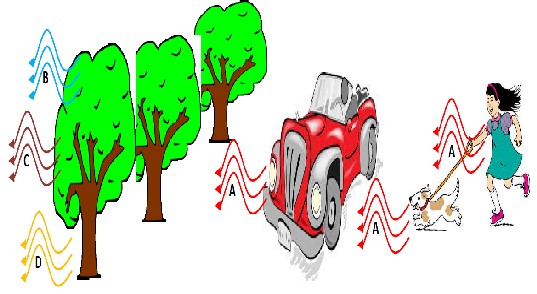
factor which may be exponential cosine or sine in nature. We consider three cases as illustrated in the figure below, points B,C & D are the points which shows the nature of the buffer factor. For example, point C is the cosine effect of the buffer factor, point B is the sine effect of the buffer factor and point D is the exponential effect of the buffer factor.
Figure 2: Buffer factor effects expected from figure 1 i.e. when trees are closer to the building than the source of noise
IJSER © 2015 http://www.ijser.org
International Journal of Scientific & Engineering Research, Volume 6, Issue 5, May-2015 1758
ISSN 2229-5518
Results and Discussion
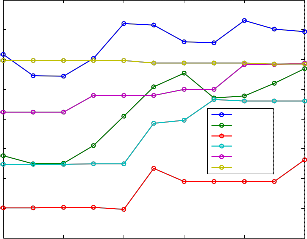
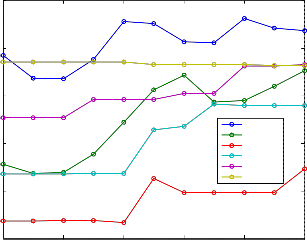
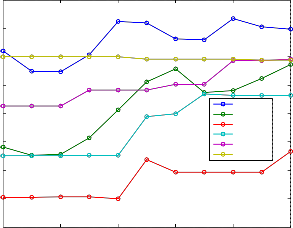
The six locations considered were location 1 is the power generators, location 2 is , location 3 is hand- held mower machines (for cutting grass), location 4 is students activities, Location 5 is vehicular and location 6 is public address system. In descending order, the noise levels for each location are location
1, location 6, location 5, location 2, location 4, and location 3. The buffer effects for three cases illustrated in figure 2 i.e. point B is the cosine effect of the buffer factor, point C is the sine effect of the buffer factor and point D is the exponential effect of the buffer factor are expressed in equation 4.
𝛽𝐿𝑀
Three assumptions were made i.e. 10
�10 is negligible, the angular displacement is pi/3 and no loss
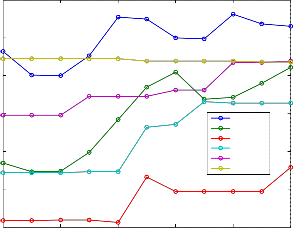
of energy between the source and the location. Figure 3a expressed the cosine decay while Figure 3b shows the sine decay of signal. Both buffer factors represent a scenario when the tree is close to the building. Figure 4a is the exponential decay which represents when the tree is far from its location/source. Figure 4b represents a scenario-when the buffer factor is unity i.e. if no tree exists between the building and location/source. Hence, figure 4b is the control of the whole experiment. When the buffer factor is cosine influenced i.e. at point C, the tree trunk and leaves helps reduce the noise better than when the leaves are involved only i.e. point B. When the location is far from the building the buffer factor (exponential decay) are influenced by the wind speed (Emetere & Akinyemi,
2013) which may escalate the noise pollution as shown in figure 4a.
60 100
50
80
40
60
30
location 1 40
20
location 2
location 3
10 location 4 20
location 5
location 6
0
0
location 1 location 2 location 3 location 4 location 5 location 6
-10
-20
0 10 20 30 40 50
Position from noise (m)
-20
0 10 20 30 40 50
Position from noise (m)
Figure 3a: Cosine effect of the buffer factor Figure 3b: Sine effect of the buffer factor
IJSER © 2015 http://www.ijser.org
International Journal of Scientific & Engineering Research, Volume 6, Issue 5, May-2015 1759
ISSN 2229-5518
200
120
100
150
80
100
50
0
location 1 location 2 location 3 location 4 location 5 location 6
60
40
20
0
-20
location 1 location 2 location 3 location 4 location 5 location 6
-50
0 10 20 30 40 50
Position from noise (m)
-40
0 10 20 30 40 50
Position from noise (m)
Figure 4a: Exponential effect of the buffer factor Figure 4b: Exponential effect of the buffer factor
Conclusion
As shown in figure 3a, 3b & 4a, vegetation influences both the physical properties of sounds and the ways in which people perceive, evaluate, and respond to sound in different urban settings. The wind dynamics of the around the location may dictate an unusual occurrence i.e. whether the trees are closer to the building or the source. The first location, the power generator behind the university chapel had trees around and the overall noise reduction was 12.5dB. The overall noise reduction in the second location was 47.12dB. Reduction from other locations was between 16dB to 25dB. Hence, if wind dynamics is excluded, trees should be planted close to the noise source rather than the area to be protected.
REFERENCES
Dietrich Heimann.(2003), Numerical simulations of wind and sound propagation through an idealised stand of trees, Acta Acustica united with Acustica, 89 (5) 779-788
Lisa Goines, Louis Hagler, (2007), Noise Pollution: A Modern Plague, South Med
J. 2007;100(3):287-294
IJSER © 2015 http://www.ijser.org
International Journal of Scientific & Engineering Research, Volume 6, Issue 5, May-2015 1760
ISSN 2229-5518
Moses E Emetere and M.L Akinyemi (2013). Modeling Of Generic Air Pollution Dispersion Analysis
From Cement Factory. Analele Universitatii din Oradea–Seria Geografie 231123-628, pp. 181-189
Rajiv B. Hunashal, Yogesh B. Patil, (2012 ), Assessment of noise pollution indices in the city of
Kolhapur, India, Procedia - Social and Behavioral Sciences 37, 448 – 457
O. S. Olayinka, S. A. Abdullahi, (2008), A statistical analysis of the day-time and night-time noise levels in Ilorin Metropolis, Nigeria, Trends in Applied Sciences Research, 3(3), 253-266
IJSER © 2015 http://www.ijser.org