International Journal of Scientific & Engineering Research, Volume 3, Issue 2, February-2012 1
ISSN 2229-5518
Morphology of YSZ Thin Films on Ag Substrate
Shirley Tiong Palisoc, Rose Ann Tegio, Michelle Natividad, Simon Gerard Mendiola
Benjamin Tuason, Kevin Kaw and Stephen Tadios
Abstract— Different concentrations of yttria stabilized zirconia (YSZ) grown on silver (Si) substrate was investigated in this paper. Suspension containing 10wt%, 30wt% and 50wt% YSZ were fabricated using the spin coating technique on silver keeping all other parameters constant such as the coating parameters and sintering temperature. The surface morphology and thickness of the films were investigated using scanning electron microscopy (SEM). Results showed porous YSZ films which become less porous as the concentration of YSZ increases. Th e thickness of the films was also affected by the YSZ concentration. As the concentration increases, the thickness of the films also increases. The crystal structure of the fabricated films was also determined using X-ray Diffraction (XRD) and Raman Spectroscopy. Both techniques revealed a cubic fluorite structure independent of the concentration of YSZ.
Index Terms— YSZ, spin-coating, thin film, Raman spectroscopy, x-ray diffraction(XRD), scanning electron microscopy (SEM)
—————————— ——————————
1 INTRODUCTION
orld population continues to grow with an annual rate of 1.2% [1]. As a consequence, it is expected for
the total consumption of marketed energy to rise by 44% from 2006 – 2030 due to the increasing demand for energy services making way for other power generation technologies to arise [2]. However, environmental concerns should also be considered. Technology, therefore, should be able to meet the demands of the growing population with less environmental impact and more efficient use of vital energy resources. One such energy source is the solid oxide fuel cell (SOFC) [3]. A solid oxide fuel cell is an electrochemical device that converts chemical energy into electrical energy [4]. Much development is focused now on SOFCs because of its high efficiency in converting a wide variety of fuels. It is also environment friendly with low emissions of NOx and dust and since it has no moving parts and the cells are non-vibrating, noise is also eliminated [5].
Yttria stabilized zirconia (YSZ) is usually used as the electrolyte of SOFCs because of its ion conductivity, mechanical stability and good chemical compatibility. However, at operating temperatures below 800oC, the conductivity of YSZ is not high enough to lessen the
————————————————
Shirley Tiong Palisoc, Ph.D. in Materials Science is a professor at the Department of Physics, De La Salle University – Manila, Philippines E-mail: shirley.palisoc@dlsu.edu.ph
Rose Ann Tegio is a junior officer at PNB –Manila, Philippines
E-mail: michelle.natividad@dlsu.edu.ph
Michelle Natividad, Ph.D. in Physics is an assistant professor at the
Department of Physics, De La Salle University – Manila, Philippines
E-mail: michelle.natividad@dlsu.edu.ph
Simon Mendiola is a Test Engineer at Hitachi Philippines
E-mail: sg_mendiola@yahoo.com
Benjamin B. Tuason is a senior student at the De La Salle University –
Manila, Philippines
E-mail: benjamintuason@yahoo.com
Kevin Y. Kaw is a senior student at the De La Salle University – Manila,
Philippines
E-mail: kevinkaw08@yahoo.com
Stephen G. Tadios is a senior student at the De La Salle University –
Manila, Philippines
E-mail: benjamintuason@yahoo.com
resistive losses. To solve the problem, it is desirable to fabricate either thinner (<5.0μm) or more conductive films generating a power density of 400mW/cm2 to 1500mW/cm2 [6].
Previous studies have reported several techniques in fabricating YSZ thin films [7-10]. In this study, spin coating technique is utilized because of the simplicity of its method and the cheapness of its operational cost as compared to the other techniques mentioned. This study also seeks to determine the optimal condition in fabricating the films by varying the YSZ concentration and the type of substrate.
Different concentrations of YSZ namely 10wt%,
30wt% and 50wt% are used to produce thin films on silver
(Ag). The YSZ concentration is varied to provide baseline information on how the sample behaves within such concentration range. The sample films are characterized in terms of their surface morphology and thickness through Scanning Electron Microscopy and crystal structure through X-Ray Diffraction.
2 EXPERIMENTAL PROCEDURE
2.1 Fabrication of YSZ thin films
Commercial yttria stabilized zirconia (YSZ8-U1, fuelcellmaterials.com) and ethanol (95% ethyl alcohol, Aced Laboratory) with weight ratios of 10YSZ:90ethanol, 30YSZ:70ethanol and 50YSZ:50ethanol were mixed to form a suspension. To ensure the consistency of the suspension, a Sonicator Ultrasonic Processor (Misonix) was used. The suspension was mixed for three hours with 60% output amplitude
/intensity. It was then deposited on the silver substrate using the Spincoat G3P-8 spin coater. The substrate with YSZ layer was baked in a furnace (Thermolyne type 48000)
IJSER © 2012 http://www.ijser.org
International Journal of Scientific & Engineering Research, Volume 3, Issue 2, February-2012 2
ISSN 2229-5518
at a temperature of 300 oC for three minutes until all of the
solvent evaporates. In this paper, the substrate was only coated once with the YSZ suspension. The substrate with the YSZ layer was then sintered at 650 oC for four hours in the furnace.
2.2 Characterization
Using Scanning Electron Microscopy (SEM) (Jeol
5310), the surface morphology and the thickness of the films were investigated. The crystal structure of the fabricated films was determined using X’Pert PRO PANalytical X-ray Diffractometer (XRD) with CuK-α radiation. Raman spectroscopy was also utilized in this study. R3000 Raman spectrometer with 785nm laser was used to acquire the Raman spectra of the films. Based on the Raman spectrum, the crystal structure of the sample was obtained and was compared to the XRD result.
3 RESULTS AND DISCUSSION
3.1 Surface morphology
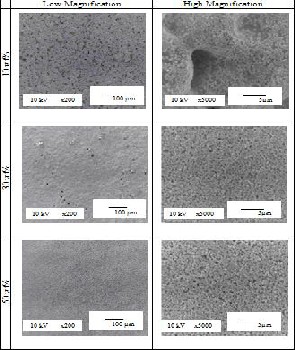
Shown in Fig. 1 are the SEM images of the surface of the films fabricated on Silver substrate using three different concentrations of YSZ namely 10 wt%, 30 wt% and 50 wt%. Porosity of the films was evident based on the results. A discontinuous film was produced using the 10 wt% YSZ concentration. This is because silver is rough. The YSZ particles just followed the contour of the silver
Fig. 1. SEM images of the surface of the films with different
concentrations of YSZ on Silver substrate.
substrate preventing the particles to adhere to each other thus, a discontinuous film was produced. In the low magnification image (x200) for the 10 wt% YSZ, the YSZ particles cannot be seen. The YSZ particles can only be seen at higher magnification (around x5000 or higher). On the other hand, films were produced using 30 wt% and 50 wt% YSZ. The films also became less porous as the concentration of YSZ increases since more particles will fill in the pores. However, pin holes can be seen at the low magnification image (x200) for 30 wt% YSZ which maybe either due to air bubbles or foreign particles that made contact with the film during the entire experimentation.
The porosity of the films is due to the fact that YSZ
powders do not dissolve in ethanol. The function of ethanol as the suspension medium is to suspend and disperse the particles, not to dissolve them.
3.2 Film thickness
Shown in Fig. 2 are the SEM images of the 30wt% and 50wt% YSZ films fabricated on silver substrate. As explained from the previous section, a discontinuous film was produced for the 10 wt% YSZ since the particles just followed the contour of the substrate. Relatively thicker films with thickness of 19.6µm (average) and 28.1µm (average) were attained for the 30 wt% and 50 wt% YSZ respectively. The relationship between the thickness and the YSZ concentration was still the same. As the concentration of YSZ increases, the thickness of the films also increases.
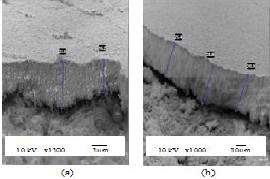
Fig. 2. SEM images showing the thickness of the films with (a) 30 wt% YSZ and (b) 50 wt% YSZ fabricated on Silver substrate.
Listed in Table I are the film thicknesses of the
IJSER © 2012 http://www.ijser.org
International Journal of Scientific & Engineering Research, Volume 3, Issue 2, February-2012 3
ISSN 2229-5518
different concentrations. Since the suspension with 10 wt%
YSZ was runny or less viscous, it was easily spun out of the substrate thus, making the film thinner. On the other hand, the suspension with 50 wt% YSZ is very viscous thus was not easily spun out of the substrate during the spin-coating process making the film thicker.
3.3 Crystal structure
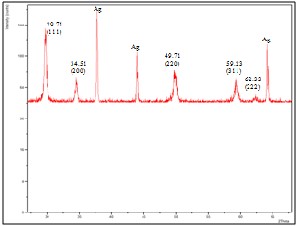
Fig. 3. XRD patterns of films with 10wt% YSZ fabricated on silver substrate
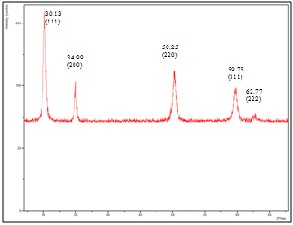
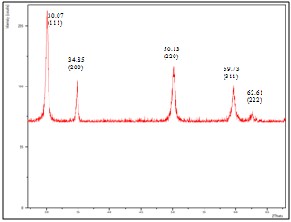
Fig. 4. XRD patterns of films with 30wt% YSZ fabricated on silver substrate
Fig. 5. XRD patterns of films with 50wt% YSZ fabricated on silver substrate
1) X-ray diffraction results
The crystal structure of fabricated YSZ thin films
was determined by x-ray diffraction. Figure 3 shows the x- ray diffraction pattern for 10wt% YSZ film fabricated on silver substrate. Silver peaks were observed in the XRD patterns of 10wt% YSZ film fabricated on silver substrate. This can be attributed to the discontinuity and the thinness of the YSZ film produced. Although there are silver peaks present, YSZ peaks can still be observed. Figures 4 and 5 are the XRD patterns for 30wt% and 50wt% YSZ films fabricated on silver substrate respectively. No silver peaks present for both figures which signifies that the substrate was completely covered by YSZ. The position of the peaks did not change significantly which indicates that the films fabricated on silver substrate have a cubic fluorite structure regardless of YSZ concentration which coincides with the result obtained by Priyatham and Bauri [11].
Listed on Table II are the position of the peaks and the corresponding intensities for the films fabricated on silver substrate which supported the assumption that the intensity of the peaks increases as the concentration of YSZ increases. This is mainly because the XRD intensity is proportional to the amount of material [12]. More YSZ particles are present in the 30 wt% YSZ film and much more in 50 wt% YSZ film hence, the reason for the increase in the intensity of the peaks.
In X-ray diffraction technique, the position of the
peaks indicates the crystal structure of the material while the intensity of the peaks depends on the material distribution in the structure [13]. Therefore, in determining the crystal structure of YSZ films, the focus is on the peak position.
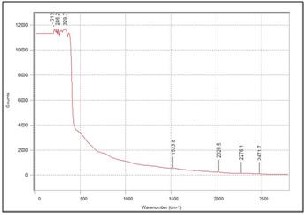
Fig. 6. Raman spectra of films with 10wt% YSZ fabricated on silver substrate
IJSER © 2012 http://www.ijser.org
International Journal of Scientific & Engineering Research, Volume 3, Issue 2, February-2012 4
ISSN 2229-5518
X-ray diffraction analysis revealed that all the sample films obtained in this study, exhibit a cubic fluorite structure and that the crystal structure does not depend on the concentration of YSZ.
2) Raman spectroscopy results
To verify the XRD results, another test was done
which was the Raman spectroscopy. The attained Raman spectra were compared to the results obtained by Ghosh et al. [14] and Cheng and Liu [15].
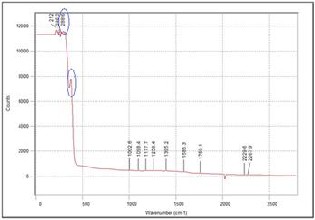
Fig. 7. Raman spectra of films with 30wt% YSZ fabricated on silver substrate
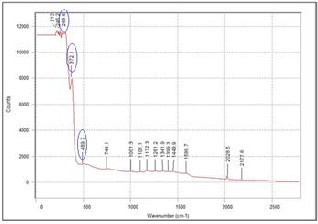
Fig. 8. Raman spectra of films with 50wt% YSZ fabricated on silver substrate
The Raman spectra for films with 10wt%, 30 wt%
and 50wt% YSZ fabricated on silver are shown in Fig. 6-8
respectively. For the film with 10wt% YSZ, the signals were
too weak that the characteristic peaks were not visible. This can be attributed to the very thin and discontinuous film obtained for the particular YSZ concentration (10wt%). On the other hand, the characteristic peaks were present for the films with 30wt% and 50wt% YSZ. The intensity of the peaks also increases as the concentration of YSZ increases.
Results obtained from Raman Spectroscopy verified the XRD results. All the sample films have a cubic fluorite structure. The intensity of the peaks increases as the concentration of YSZ increases, in agreement with Umbach and Hines [16].
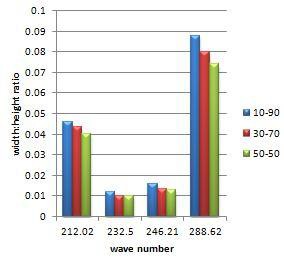
Fig. 9. Width to height ratio of Raman peaks of 10%wt,
30%wt and 70%wt YSZ films on silver substrate
TABLE I THICKNESS OF FILMS (in µm)
10 wt% YSZ | 30 wt% YSZ | 50 wt% YSZ |
n/a | 19.6 | 28.1 |
TABLE II
POSITION OF THE XRD PEAKS AND THEIR CORRESPONDING INTENSITY
IJSER © 2012 http://www.ijser.org
International Journal of Scientific & Engineering Research, Volume 3, Issue 2, February-2012 5
ISSN 2229-5518
TABLE III
Width to height ratio of Raman peaks of 10%wt, 30%wt and 70%wt YSZ films on silver substrate
10 wt% YSZ | 30 wt% YSZ | 50 wt% YSZ |
Wave no. | Width to height | Wave no. | Width to height | Wave no. | Width to height |
212.02 | 0.045747 | 212.02 | 0.043385 | 212.02 | 0.040323 |
232.50 | 0.011888 | 232.50 | 0.010016 | 232.50 | 0.009778 |
246.21 | 0.015991 | 246.21 | 0.013157 | 246.21 | 0.012659 |
59.23 | 0.087462 | 59.23 | 0.079846 | 59.23 | 0.073893 |
4 CONCLUSIONS
SEM images of the surface of the fabricated films showed that the films are porous. The porosity depends on the concentration of YSZ used in fabricating the films. Greater concentration means more amount of YSZ that can cover up the pores and thereby lessening the porosity of the films. However, a discontinuous film was produced on the silver substrate using 10 wt% YSZ because of the severe roughness of the substrate. The YSZ particles just followed the contour of the silver substrate preventing the particles to adhere to each other hence, a discontinuous film was formed.
Viscosity of the suspension used was the main factor in determining the thickness of the films. Films with 10wt% YSZ are relatively thinner compared to the films with 30wt% YSZ and much thinner as compared to films with 50wt% YSZ.
X-ray diffraction patterns show that the crystal structure of the fabricated YSZ thin films is cubic fluorite which coincides with the result obtained by Priyatham and Bauri [11]. A cubic fluorite structure indicates that the films are stable. The intensity of the peaks gets higher as the concentration of YSZ gets larger.
Similar results were observed from the Raman patterns of the fabricated films. The intensity of the peaks gets higher as the concentration of YSZ increases. Raman spectra of the films obtained in this study contained the characteristic peaks of cubic fluorite structure YSZ which agree with the results obtained by Ghosh et al. and Cheng & Liu[15]. Raman spectra of the
films above 1000 cm-1 were also observed in this study.
REFERENCES
[1] Statistics Division of the Department of Economic and Social
Affairs of the United Nations Secretariat, Population and Vital
Statistics Report, 2009, Series A61 (2)
[2] Energy Information Administration, International Energy Outlook
2009, pp. 17, 2009
[3] A. Boudghene Stambouli and E. Traversa, “Solid oxide fuel cells (SOFCs): a review of an environmentally clean and efficient source of energy”, Renewable and Sustainable Energy Reviews, 6(5), pp. 433-455, 2002
[4] S. C. Singhal, “Zirconia Electrolyte-based Solid Oxude Fuel
Cells”, Encyclopedia of Materials: Science and Tehcnology, pp. 9898-
9902, 2001
[5] X. Xu, S. Huang, and D. Peng, “YSZ thin films deposited by spin- coating for IT-SOFCs”, Ceramics International, 31, pp. 1061-1064,
2005
[6] K. Chen et al., “Fabrication and performance of anode-supported
YSZ films by slurry spin coating”, Solid State Ionics, 177, pp.3455-
3460, 2007
[7] Z. Ogumi et al., “Preparation of thin yttria-stablized zirconia
films by vapor phase electrolytic deposition”, Solid State Ionics,
58(3-4), pp. 345-350, 1992
[8] G. Laukaitis et al., “YSZ thin films deposited by e-beam technique”, Thin Solid Film, 515(2), pp. 678-682, 2006
[9] M.F. Garcia-Sanchez et al., “Nanostructured YSZ thin films for
solid oxide fuel cells deposited by ultrasonic spray pyrolysis”,
Solid State Ionic, 179 (7-8), pp. 243-249, 2008
[10] B. Hobein et al., “DC Sputtering of yttria-stabilized zirconia films for solid oxide fuel cell applications”, Journal of the European Ceramic Society, 21 (10-11), pp. 1843-1846, 2001
[11] T. Priyatham and R. Bauri, “Synthesis and characterization of
nanocrystalline Ni–YSZ cermet anode for SOFC”, Materials
Characterization 61 (54-58), 2010
[12] P. S. Lee , et al., “In situ XRD analysis of Ni(Pt)/Si(100) reactions in low temperature regime ≤ 400oC”, Solid State Comunications,
128, pp. 325-328, 2003
[13] J.R. Connolly, “Introduction Quantitative X-Ray Diffraction
Methods”, 2010
[14] A. Ghosh et al., “Nanocrystalline zirconia-yttria system-a Raman
study”, Materials Letters, 60, pp. 1170-1173, 2006
[15] Z. Cheng and M. Liu, “Characterization of sulphur poisoning of
Ni-YSZ anodes for solid oxide fuel cells using in situ Raman
microspectroscopy”, Solid State Ionics, 178, pp. 925-935, 2007 [16] C.C. Umback and M.A. Hines, “Applications of Raman
Spectroscopy”,http://www.ccmr.cornell.edu/igert/modular/docs/ Appl_of_Raman_Spectroscopy, 2009
IJSER © 2012 http://www.ijser.org