International Journal of Scientific & Engineering Research Volume 4, Issue 1, January-2013 1
ISSN 2229-5518
Modification in P/F ratio techniques due to change in assumptions
Manjul Mayank Pandey, Dr Rupam Tiwari.
Abstract— This paper makes some modifications in P/F ratio technique, due to changes in assumptions, to estimate total fertility rate (TFR). P/F ratio method giv- en by William Brass is pioneer and mostly used. But this method assumes no de- cline in fertility in recent past. But the assumption of no decline in fertility in recent past ,is not correct. Due to change in socio-economic condition of women, im- provement in educational level and awareness in women, use of contraceptive and development in society, As evidence that fertility decline in India has been taking place. Thus, estimates of TFR by P/F ratio technique requires, some modifications. Also the assumption that fertility follows linear trend by William Brass and second degree polynomial by Coale-Trussel are not correct. Fertility follows neither linear trend nor second degree polynomial, but it follows logistic curve. So, fitted logistic curve is used for estimating average parity equivalents F’(i) by interpolation.But MMP used P/F’ ratio in place of P/ F ratio, whereF’(i) is average parity equivalent, estimated by fitted logistic curve.It becomes comparable with the average parities calculated from the data on children ever born.
MMP used population analysis spread sheets (PAS), which was developed by U.S. Bureau of the Census, International Programme Center with some modifi- cations to estimate TFRs.In modified software F’(i), average parity equivalent by fitted logistic curve is used in place of F(i).To estimate TFR by modified software , we copy the values of ASFR and CEB for age group 15-19,20-24,25-29,30-
34,35-39,40-44 and45-49.,from data sheet of ASFR and CEB and paste it in the modified Software(Excel sheet).TheSoftware,automatically,estimates values of TFR .
Index Terms— Age specific fertility rate (ASFR), Average parity of the women in a particular
age group(P) , Average parity equivalent (F(i)), fitted logistic curve, Children ever born
(CEB), Current fertility or children born last year (CBLY), Cumulated fertility <r (i), and trend
line in time series data.
—————————— • ————————
IJSER © 2013 http://www.ijser.org
International Journal of Scientific & Engineering Research Volume 4, Issue 1, January-2013 2
ISSN 2229-5518
Introduction This paper makes some modifica- tions in P/F ratio technique to estimate total fertili- ty rate (TFR),due to changes in assumptions . William Brass technique of TFR is based on as- sumptions that the reference period error is inde- pendent of age. It means,the reported age pat- tern of fertility is correct but not upto the level. The reported CEB by the younger women is ac- curate and fertility has remained constant in the past. P/F ratio method given by William Brass is pioneer and mostly used. But this method as- sumes no decline in fertility in recent past. But the assumption of no decline in fertility in recent past, is not correct. Due to change in socio-economic condition of women, improvement in educational level and awareness in women, use of contracep- tive and development in society, As evidence that fertility decline in India has been taking place. Thus, estimates of TFR by P/F ratio technique requires, some modifications.
Also the assumption that fertility follows linear (second degree polynomial ) trend by William Brass(by Coale-Trussel ) is not correct. Fertility follows neither linear trend nor second degree polynomial, but it follows logistic curve. So,fitted logistic curve is used for estimating the
born (CEB) and current fertility or the number of children born last year (CBLY) is used. When women are grouped according to some variable such as age or duration of marriage, the average number of children ever born by the age group, also known as their average parity, can be com- puted by dividing the total number of children born to the total number of women in the age group. The result is a measure of the average life time fertility experience of the survivors of a birth or marriage cohort.
The current fertility data suffers mostly from ref- erence period error. The CEB data on the other hand does not involve time element in it and hence is free from such type of error. The refer- ence period (say one year) may be either under reported or over reported. It means , instead of reporting the births of an average 12 months, it may be reported either more than 12 months or less than 12 months.The CEB data on the other hand does not involve time element in it and hence free from such type of error.
Logistic Curve: This is a particular form of com-
plex types of growth curve. A symmetric logistic curve is also known as Pearl-Reed Curve is giv- en by equation.
K
average parity equivalents F(i) by interpolation.
The quality of estimates of TFR also
U t=
1 + exp
( a + bt )

, b<0 ……………(1)
depends upon quality of data. Census data con- tains non-sampling error. But it can be used ap- propriately to compute the adjusted estimates. To
estimate TFR, data on number of children ever
where a, b and K are constants and Ut is the value of time series at time t .
The principle of least square cannot be
applied to fit the logistic curve (1) because the
IJSER © 2013 http://www.ijser.org
International Journal of Scientific & Engineering Research Volume 4, Issue 1, January-2013 3
ISSN 2229-5518
number of parameters viz. a , b and K are more than number of variables t and Ut. .The method of three selected points is used for fitting the logistic curve. We estimate the parameters K, a, b of the logistic curve from the given data and putting val- ues of these parameters in equation (1) We get fitted logistic curve .Thus we use this logistic curve for estimating average parity, equivalents F’(i) (instead of F(i)) from the given data of an average age-group. Coale-Trussel used second degree fitted polynomial to estimate F(i) ,the av- erage parity equivalents from the given data of an age group.
The main objective of this Paper is to give effective technique to estimate TFR,due to change in assumptions and changes in socio- economic conditions of women, improvement in educational level and awareness in women, use of contraceptive and development in society. The estimates of TFR by modified technique (MMP modified P/F’ ratio technique) is compared with estimates of TFR by William Brass P/F ratio technique, and by Gompertz model of TFR , for consistent result from the same data .
2. Data Source and quality of data
In demographic usage, the term ‘fertility’ relates to the number of live births, to a woman in her life time fertility experience upto the moment at which data is collected.
Traditionally, demographic estimation has been based on data collected by Censuses and
by vital registration system. If data collected by
these methods (sources) is perfect, demographic parameters could be calculated directly from the data reported and there would be no need for in- direct estimation. But unfortunately, however, in many countries,due to different type of errors, the estimates obtained directly from the data are severely flawed, keeping in this view, demo- graphers have developed a set of techniques that allow their indirect estimation. So the immediate need is to search for such question which can be answered with reasonable accuracy and that provide enough information about a certain de- mographic phenomenon to permit the indirect es- timation. Quality of estimates also depends upon quality of data.
In 2001and 2011 Census of India, four questions relating to fertility were canvassed. These were:
I. Age at marriage.
II. Number of children surviving.
III. Number of children ever born (CEB).
IV. Whether any child was born during the last year (CBLY).
First, question was asked from all ever married persons male as well as female, the second and third, questions were asked for all ever married women, while the last one (IVth) question was canvassed in case of currently married women. Currently married women means,those women, whose husband is alive. The number of children ever born to a particular ever married woman is
an aggregate measure of her life time fertility ex-
IJSER © 2013 http://www.ijser.org
International Journal of Scientific & Engineering Research Volume 4, Issue 1, January-2013 4
ISSN 2229-5518
perience upto the moment at which the data is collected. When women are grouped according to some variable such as age or duration of mar- riage, the average number of children ever born by the group, also known as their average parity can be computed by dividing the total number of children born to the total number of women in the age-group. The result is a measure of the aver- age life time fertility experience of the survivors of a birth or marriage cohort.
Average parities for groups of women cal- culated from data on children ever born can be distorted either by errors in the number of child- ren reported or by errors in the classification of women in particular age-groups.
In general, following are the types of errors in
CEB data:-
1. Misunderstanding the questions.
I. The mortality errors: It arises when the res- pondents report only the number of children who are still alive rather than those ever born.
II. Non-resident error: This is caused by over- looking the alive children who are not resid- ing with the mother.
III. The marriage error: This occurs when the question is pertinent to all marriages and the women who have been married more than once do not include their children to pre- vious marriages in their report.
2. Respondents’ lapse of memory
I. The memory error, which is caused by ten- dency on the part of some mothers, elderly to forget to include some of their children who had died. The symptoms of such omis- sion are average parities that fail to increase rapidly enough as age increases.
II. The baby error is caused by the common tendency to overlook reporting of the alive young children of particular sex.
Type of errors in the current fertilitydata
The current fertility data suffers mostly from reference period error. The CEB data on the other hand does not involve time element in it and hence is free from such type of error. The reference period (say one year) may be either under reported or over reported. It means, in- stead of reporting the births of an average 12 months, they may be related to either more than
12 months or less than 12 months.
But few limitations with regard to these indices may be mentioned. These are:
I.The question on birth during last one year was canvassed only for currently married women for operational reasons. Sensitive questions as to whether there was any birth during the last one year could not be canvassed in the case of the single, widowed or divorced women. Some births might have taken place to women, who might have become widowed or divorced subsequently, but before or during the Census enumeration pe- riod. Such births have not been netted, although
their proportion may not be significant.
IJSER © 2013
http://www.ijser.org
International Journal of Scientific & Engineering Research Volume 4, Issue 1, January-2013 5
ISSN 2229-5518
I. Another class of births that would have been left out would relate to babies born during the last one year to mothers who may have died before the Census date.
II. The limitation of collecting the retrospec- tive data should also be considered. These are omission of events, inaccuracies in dating of birth and distortion in age reporting.
The effect of these limitations would be partly to under estimate the relevant fertility indicators. The above mentioned limita- tions would imply that the estimates of current fertility should be considered as indicative of broad trends, rather than actual levels. Thus, we see that Census data has different type of errors and estimates obtained directly from the data are severely flawed. Keeping in this view demo- graphers have developed a set of techniques to indirect estimation of TFR. P/F ratio method for estimation of TFR given by William Brass is pio- neer and mostly used method for TFR. But this method assumes no decline in fertility in recent past. But as evident shows that fertility decline in India due to improvement in educational level and awareness in women, change in socio- economic condition of women and use of con- traceptives.
Thus, P/F ratio technique over estimates the TFR.In P/F ratio technique, average parity equivalent F(i) are estimated by interpolation. Several procedures have been proposed for this
interpolation. William Brass used simple poly-
nomial model of fertility. While Coale and Trus- sel used second degree polynomial to estimates average parity equivalent F(i).But it seems to appear not appropriate in present situation. So Brass model & Coale -Trussel fertility models require slight modification in estimating average parity equivalents F(i) by interpolation. Thus fer- tility trend follows, logistic curve (growth curve). So, fitted logistic curve is used for estimating F(i)by interpolation. P/F ratio obtained for younger women is used as an adjustment factor by which all the observed period fertility rates are multiplied.
However, if there is evidence suggesting that the population is experiencing a fertility de- cline affecting mainly women in the older age groups the value P2/F2 is recommended as an adjustment factor because it is less likely to be affected by the decline. In general, P1/F1 should be discarded because of the intrinsic difficulty in estimating F1 and P/F ratio for age group over
30 cannot be regarded as reliable due to possi- ble omission of children ever born.
In this technique we use following data :
1. Total number of children ever born classified by five year age group of mother.
2. Total number of children born in last one year
to the date of census or survey classified.
3. Total number of women in five year age group
(irrespective of marital status).
IJSER © 2013 http://www.ijser.org
International Journal of Scientific & Engineering Research Volume 4, Issue 1, January-2013 6
ISSN 2229-5518
3. Methodology :
Total birth to women in last one year in age group (i )

f ( i ) =
Total women
P/F ratio technique by William Brass: An esti- mate of probable level of fertility has been pro- vided by William Brass using P/F ratio technique which uses the data on children ever born and that of births during last year by age of women and a correction factor is worked out for the number of children born last year. Estimates pre- sented therein P stands for average parity of the women in a particular age group and F stands for the average parity equivalent obtained from pe- riod fertility rates by cumulation and interpolation. may be closer to actual levels.
Brass technique, is based on the following assumptions:
I. The reference period error is independent of age. It means that the reported age pattern of fertility is correct but not upto the level.
II. The reported CEB by the younger women is accurate.
III. Fertility has remained constant in the past.
4. Computational Procedure: Step1.Calculation of reported average parities: Reported Average parity of women in age group (i) is denoted by

= CBLY TW
(Here TW .means total women whether childless or not ever married or not in that age group).
Step3. Calculation of cumulated fertility schedule for a period: We denote it ,<r (i)
Cumulated fertility <r (i) = 5 (f(0) + f(1) +…………..+ f(i)).
Step4. Estimation of average parity equivalent for a period: Average parity equivalent F(i) are estimated by interpolation using the period fertility rate f(i) and the cumulated
fertility values <r (i) calculated in previous
steps. Several procedures have been pro- posed for this interpolation.
William Brass used simple polynomial model of fertility to calculate the relation- ship between average parity and cumu- lated fertility for successive age groups for a range of age locations of the fertility model. Coale & Trusell proposed fitting a second degree polynomial to three con-
secutive values of <r (i) and estimating the
average parity of women of an age group within the range by evaluating the integral of polynomial; in actual application F(i) is
obtained as
P(i) =
Total no. of children everborn (CEB ) to women in age group (i )

Total no. of women in that age group (TW )

= CEB TW
Where, TW= Total no. of women in that age group, whether married or single, fertile or not.
Step2. Calculation of preliminary fertility schedule from in- formation on births in the last year or from registered birth: ASFR for age group (i) is denoted by f(i).
IJSER © 2013
F(i) = <r (i-1)+ a* f(i)+ b* f(i+1) …………(2) Where a and b are constants, whose Values are shown in table 1 for i=1, 2,…6. F(7) is obtained as
F(7)= <(6) + a*f(6) + b*f(7) ………… (3)
http://www.ijser.org
International Journal of Scientific & Engineering Research Volume 4, Issue 1, January-2013 7
ISSN 2229-5518
A more accurate procedure is based on the gen- eral principle underlying in equation (2) but it al- lows the constants a and b to vary with i. The in- terpolation equation used is
F(i) = < (i-1)+ a(i)* f(i)+ b(i)* f(i+1)+c(i)* <r (7) --------- (4)
Values of parameters a, b and c were estimated by using least squares regression to fit equation (4) to a large number of model cases constructed by using the Coale-Trussell fertility model based
This point of inflexion is the critical point wherefrom the increasing rate of the curve starts to decline. We also observe that the line U= ß is an asymptote to the curve since
lim Ut =ß
x �oo
Logistic curve has two asymptotes at the two ends, U=K and U=0 are upper and lower asymptotes to the logistic curve.
Fitting of logistic curve:
on fitting second degree polynomial for F(i).
But it seems to appear not appropriate in
=
1 + exp
K

,
( a + bt )
present situation. So slight modifications have been used in Brass and Coale-Trussell fertility model, for estimating average parity equivalents F(i) by interpolation.
5.Suggestions and modifications: Due to change in socio-economic condition of women, improvement in educational level and awareness in wom- en, use of contraceptive and development in society, fer- tility trend follows neither linear trend nor second degree polynomial. Thus, fertility follows logistic curve. So use of fitted logistic curve for estimating average parity equiva- lents F(i) by interpolation.
Logistic Curve: This is a particular form of com- plex types of growth curve. A symmetric logistic curve is also known as Pearl-Reed Curve is giv- en by equation.
K
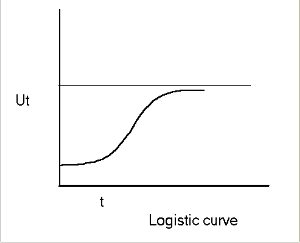
The principle of least square can not be applied to fit the logistic curve , because the number of parameters viz. a, b and K are more than number of variables t and Ut.Thus ,the shape of the curve is elon- gated S as given below.
Method of three selected points for fitting the logistic curve:
The given time series data is first plotted on a graph paper and a trend line is first drawn by the freehand smoothing method. Three ordinates U1, U2, U3, are now taken
Ut =
1 + exp
( a + bt )

, b<0 ……… (5)
from the trend line corresponding to se-
lected equidistant points of time, say t= t1, t= t2, t= t3, respectively, such that t2–t1 =
where a, b and K are constants and Ut is the val-
ue of time series at time t .
logistic curve has a point of inflexion at U= ß /2.
t3–t2.The sum or average of more than one neighboring values can also be taken with
advantage. Values must be equidistant. Substituting the values of t = t1 ,t2 and t3 in equation(8) we get ,respectively,
IJSER © 2013 http://www.ijser.org
International Journal of Scientific & Engineering Research Volume 4, Issue 1, January-2013 8
ISSN 2229-5518
K

U1= =
1 + ea+bt1
K

, U2 =
1 + ea+bt 2
K

, U3 =
1 + ea+bt 3
average parity by fitted logistic curve is denoted by F’(i). In this technique,
Coale-Trussel used second degree fit-
OR a + bt 1= log e { (K- U1)/ U1 } ………..(9)
a + bt 2= log e { (K- U2)/ U2} ………..(9)
a + bt 3= log e {(K- U3)/ U3} ……….(9) OR
ted polynomial to estimate F(i). Average parity equivalent F(i) are estimated by interpolation using the period fertility
b(t2–t1) = Log e {
b(t3–t2)= Log e {

( K /
(K /

( K /
U 2 ) – 1
U1 ) - 1
U 3) – 1
}…….(10)
}…….(10)
rate f(i) , the cumulated fertility values
<(i),and coefficients a(i), b(i) c(i).The values of coefficients(parameters) a(i), b(i)and c(i) were estimated by using
( K /
U 3)
( K /
– 1
U 2) - 1
( K /
U 2 ) – 1
least-squares regression to fit equa-
tion(4) to a large number of model cas-

Log e{
(K /
U 2) - 1
}= Log e{
(K /

}
U 1) - 1
es, tabulated by Trussell, which are given in following table sheet.
But MMP used P/F’ ratio in place of
OR [(K- U1)/ U1] [(K- U3)/ U3] = [(K- U2)/ U2]2
OR U22 [(K- U3) (K- U1) = U1 U3 (K- U2) 2
K2 [K2- K (U1+U3) + U1 U3 ] = U1 U3 (K2 + U22 – 2KU2) OR K2 (U 2 - U U ) = K[(U 2 ( U U ) – 2U U U ]
Since K ;t0 we get,
2 -
P/F ratio, where F’(i) is average parity equivalent, estimated by fitted logistic curve. This spreadsheet estimates fer- tility based on the Trussell variant of the
Brass P/F ratio technique. The data re-
K= [(U22 ( U1 U3) – 2U1 U2 U3 ] / (U2
U1 U3) ………..(11)
quired are : age-specific fertility
b = (1/ t2 – t1) log [(K- U2) U1 / (K- U1) U2 ] ……....(12)
a = log [(K- U1)/ U1] - bt 1 …….....(13)
Calculating values of parameters K, b, a, from given data and putting these values in equation (8) we get required (fitted) logistic curve. Thus, we use this fitted logistic curve, for estimating aver- age parity equivalents F(i) from the giv- en data of age-group. In following ex- ample, average parity equivalent is de- noted by F(i) and estimates of modified
rates(ASFRs) and Average number of Children ever born per women (CEB) by five years age groups 15-19 to 45-
49.The user can select the total fertility rate(TFR) and ASFR’s corresponding to the P2/F2, P3/F3, or P4/F4 ratios, or another adjustment (e.g.; some combi- nation of P/F ratios).
Reported fertility rates are used to estimate the average cumulated fertility
of parity, equivalent F(i) that women in
IJSER © 2013 http://www.ijser.org
International Journal of Scientific & Engineering Research Volume 4, Issue 1, January-2013 9
ISSN 2229-5518
each age group interval would have, if they had been subject throughout their lives to the reported rates. Two prob- lems arise, however, in obtaining a value of F that is Comparable to the average parity, P reported by women in each age group.
First ,because fertility data are ordinari-
ly tabulated by five-year age group, cumulating the reported age-specific fertility rates and multiplying by five yields estimates of the parity or cumu- lated fertility that women experiencing those rates would achieve by the end of each five-year age group( i.e., by exact ages 20,25,30 etc., when conventional five-year age groups are used).These estimates are not comparable with the average parities calculated from the data on children ever born, because the latter values represent the mixed expe- rience of women of different exact ages. Hence, some procedure is re-
quired for estimating the average cumu-
lated fertility or parity within each age group from knowledge of the values that the cumulated fertility schedule takes at the end-points of the age a group considered.
In this respect, estimates of aver- age parity equivalent F’(i) is used by fitted logistic curve in place of aver- age parity equivalent F(i). We used the method of three selected points for fitting the logistic curve: The giv- en time series data is first plotted on a graph paper and a trend line is first drawn by the freehand smoothing curve method. Thus, use of trend line, makes equivalent cumulated fertility that women experiencing those rates would achieve by the end of each five-year age group. (that is, by exact ages 20, 25, 30 etc., when conventional five-year age groups are used) to the cumulated fertility that women have the mixed experience of
different exact ages.
Thus, estimates of F(i) obtained by fitted logistic curve becomes comparable with the aver- age parities calculated from the data on children ever born.
IJSER © 2013 http://www.ijser.org
International Journal of Scientific & Engineering Research, Volume 4, Issue 1, January-2013


ISSN 2229-5518
Trussell P/F ratio Technique |
ASFR CEB fertility P/F |
UP Age f(i) P(i) Phi(i) F(i) ratio Total - - - - - - 15-19 0.0208 0.1017 0.1039 0.0330 3.0870 20-24 0.1457 1.0911 0.8322 0.5167 2.1116 25-29 0.1630 2.4763 1.6473 1.3303 1.8616 30-34 0.1293 3.5796 2.2936 2.0526 1.7440 35-39 0.0871 4.1566 2.7290 2.5586 1.6246 40-44 0.0567 4.5276 3.0126 2.8408 1.5938 45-49 0.0431 4.6914 3.2281 3.1779 1.4763 Age code * TFR 3.2281 
* Age code: ASFR based on age of mother at: 0 census/survey 1 birth of child Adjusted ASFR’s Avg(P3/F3, P2/F2 P3/F3 P4/F4 P4/F4) Age ASFR * 2.112 1.862 1.744 1.803 - - - - - - 15-19 0.0282 0.0595 0.0525 0.0492 0.0508 20-24 0.1548 0.3268 0.2881 0.2699 0.2790 25-29 0.1616 0.3411 0.3007 0.2817 0.2912 30-34 0.1250 0.2640 0.2327 0.2180 0.2254 35-39 0.0845 0.1785 0.1573 0.1474 0.1524 40-44 0.0503 0.1063 0.0937 0.0878 0.0907 45-49 0.0412 0.0870 0.0767 0.0719 0.0743 |
TFR 3.2281 | | 6.8164 | | 6.0093 | | 5.6298 | | 5.8195 | |
|

10

Coefficients for computing Coefficients for computing
F(i) corrected ASFR's
- a(i) - | - b(i) - | - ------- c(i) - | x(i) - | - - y(i) - | z(i) - |
2.531 | -0.188 | 0.0024 | 0.031 | 2.287 | 0.114 - |
3.321 3.265 | -0.754 -0.627 | 0.0161 0.0145 | 0.068 0.094 | 0.999 1.219 | 0.233 - 0.977 |
3.442 | -0.563 | 0.0029 | 0.120 | 1.139 | - 1.531 |
3.518 | -0.763 | 0.0006 | 0.162 | 1.739 | - 3.592 |
| | | | | - 21.49 |
3.862 | -2.481 | -0.0001 | 0.270 | 3.454 | 7 |
3.828 | 0.016 | -0.0002 | | | |
- - - - - -
Interpolation Factors for Correcting ASFR Based on Births Last Year
- - Interp.
factor w(i)
- -
15-19 | 0.0426 |
20-24 | 0.0966 |
25-29 | 0.1273 |
30-34 | 0.1299 |
35-39 | 0.1576 |
40-44 | 0.0605 |
- | - |
Coefficients for computing F(i) Based on by Age of
Mother at Birth of Child
- - - -
a(i) b(i) c(i) For P/F graph
- - - -
2.147 -0.244 0.0034 1
2.838 -0.758 0.0162 1
2.76 -0.594 0.0133 1
2.949 -0.566 0.0025 1
3.029 -0.823 0.0006 1
3.419 -2.966 -0.0001 1
3.535 -0.007 -0.0002 1
- - - -
min p/f ratio for graph= 1
11

MMP used POPULATION ANALYSIS SPREADSHEETS(PAS) which was developed by U.S. BUREAU OF THE CENSUS INTERNATIONAL PROGRAMS CENTER with some modifications, to estimate TFRs. In modified software F’(i),average parity equivalent by fitted logistic curve is used in place of F(i).Thus, in modified software P/F’ ratio is used in place of P/F ratio. In modified POPULATION ANALYSIS SPREAD- SHEETS(PAS) estimates of the parameters K, a and b are used to fit the logistic curve. F’(i) are estimated by fitted logistic curve. Thus, modified technique does not use estimates of the pa- rameters a(i), b(i) c(i),which were tabulated by Trussell, In modified technique, other procedures follow as Trussell P/F ratio method.
Since the fertility ( currently born last year )has been obtained from the census question
on births during last one year, the age of the mother would be at the time of census, not at the time of birth. Thus, when ASFR have been calculated in a 12 month period classi- fied by age of mother at the end of the period, they are specific for unorthodox age groups that are shifted by six months. In other words, there would be a half year dis- placement in age specific fertility rate. Therefore the ASFRs that can be calculated from the data on children born during the year before the census classified by the age of the mother at the time of census correspond to age intervals, whose limits are (14.5, 19.5), (19.5,24.5),….., (44.5, 49.5), rather than usual intervals with end points (15,20), (20,25),………(45,50).To get adjusted ASFRs the procedure of Coale-Trussell is followed. A fertility schedule for conventional five-year age groups f+(i) ,can be estimated by weight- ing the rates referring to unorthodox age groups according to equations (14) & (15) and using the coefficients x(i), y(i) and z(i) given by Trussell. Note that when fertility rates have been calculated from births classified by age of mother at the time of delivery, this step is not required.
f+(i) = (1 – w (i-1)) f(i) + w(i) f(i+ 1)) ………………………(14)
where f(i) and f+(i) are respectively the unadjusted and adjusted age specific fertility rates
(ASFRs) and the weighting factor w(i) is calculated as
w(i) = x(i) + y(i) f(i) / <r (7) + z(i) f(i+1)/ <r (7) …………………(15)
The values of x (i), y (i) and z (i) were obtained by fitting equation (15) by least squares regression. No weighting factors is needed for i=7, as child bearing age is assumed to cease after 50 and f (7)
Therefore taken to be (1–w (6).f (7). Births reported to women under age 15 can be included among those reported by women aged 15-19.
12
MMP P/F RATIO TECHNIQUE | |
ASFR | CEB fertility P/F’ | |
UP Age f(i) | P(i) Phi(i) F(i) ratio | |
Total - - | - - - - | |
15-19 0.02078 | 0.101736 0.104 0.033 0.979 | |
20-24 0.145666 | 1.091074 0.832 0.517 1.311 | |
25-29 0.163019 | 2.476341 1.647 1.330 1.503 | |
30-34 0.129254 | 3.579624 2.294 2.053 1.561 | |
35-39 0.087075 | 4.15661 2.729 2.559 1.523 | |
40-44 0.056722 | 4.527607 3.013 2.841 #DIV/0! | |
45-49 0.043106 | 4.691406 3.228 3.178 #DIV/0! | |
Age code * | | |
TFR 3.2281 | | |
| Estimates of the parameters K,a,b of logistic curve Ut | |
Age t | K b a Ut=F’(i) | |
15-19 5 | 1.7797 -0.3237 4.399 0.1039 | |
20-24 5 | 2.7255 0.00614 0.7912 0.83223 | |
25-29 5 | 3.1371 -0.0205 0.002 1.64732 | |
30-34 5 | 3.3557 -0.1161 -0.189 2.2936 | |
35-39 5 | 3.7043 -0.0985 -0.536 2.72897 | |
40-44 5 | 3.0126 | |
45-49 5 | | |
* Age code: ASFR based on age of mother at: | |
0 census/survey 1 birth of child | |
Adjusted ASFRs | |
| P2/F2 P3/F3 P4/F4 Avg(P3/F3,P2/F2) | |
Age ASFR | 1.311 1.503 1.561 1.407 | |
- * | - - - - | |
15-19 0.0282 | 0.0370 0.0424 0.0440 0.0397 | |
20-24 0.1548 | 0.2029 0.2327 0.2416 0.2178 | |
25-29 0.1616 | 0.2118 0.2429 0.2521 0.2273 | |
30-34 0.1250 | 0.1639 0.1879 0.1951 0.1759 | |
35-39 0.0845 | 0.1108 0.1271 0.1319 0.1189 | |
40-44 0.0503 | 0.0660 0.0757 0.0786 0.0708 | |
45-49 0.0412 | 0.0540 0.0620 0.0643 0.0580 | |
TFR 3.2281 | 4.2321 4.8527 5.0381 4.5424 | |

13
Interpolation Fac- tors for Correct- ing ASFR Based on Births Last Year
Coefficients for computing
corrected ASFR's We calculate w(i) by following
Formula, Here ,<r (7) is cumulative
| Fertility. | |
| w(i) | x(i) | y(i) | z(i) | f(i) is ASFRs. | |
- | - | - | - | - | | |
15-19 | 0.0509 | 0.031 | 2.287 | 0.114 | W(1)=x(1)+ y(1)f(1)/ | <r | (7)+z(1)f(2)/<r | (7) |
20-24 | 0.1013 | 0.068 | 0.999 | -0.233 | W(2)=x(2)+ y(2)f(2)/ | <r | (7)+z(2)f(3)/<r | (7) |
25-29 | 0.1164 | 0.094 | 1.219 | -0.977 | W(3)=x(3)+ y(3)f(3)/ | <r | (7)+z(3)f(4)/<r | (7) |
30-34 | 0.1243 | 0.120 | 1.139 | -1.531 | W(4)=x(4)+ y(4)f(4)/ | <r | (7)+z(4)f(5)/<r | (7) |
35-39 | 0.1458 | 0.162 | 1.739 | -3.592 | W(5)=x(5)+ y(5)f(5)/ | <r | (7)+z(5)f(6)/<r | (7) |
40-44 | 0.0436 | 0.270 | 3.454 | -21.497 | W(6)=x(6)+ y(6)f(6)/ | <r | (7)+z(6)f(7)/<r | (7) |
- | - | | | | | | | |


Results and analysis
| TFR by Trussell P/F Ratio technique | TFR by MMP P/F’ Ratio technique | TFR by Gompertz Model |
| Total | Rural | Urban | Total | Rural | Urban | Total | Rural | Urban |
UP Hindu | 5.61 | 5.89 | 4.33 | 4.41 | 4.68 | 3.18 | 4.44 | 4.66 | 3.65 |
| | | | | | | | | |
UP Mus- lim | 6.94 | 7.31 | 6.19 | 5.26 | 5.72 | 4.43 | 5.67 | 5.82 | 5.46 |
| | | | | | | | | |
UP Total | 5.82 | 6.08 | 4.83 | 4.54 | 4.83 | 3.52 | 4.64 | 4.82 | 4.14 |
In above table values of TFRs of Hindu, Muslim and total are given in Total, Rural, and urban areas of UP, by three
method of Trussell’s P/F ratio, MMP P/F’ ratio and Gompertz Model. From above table it is very clear that values of TFRs by Trussell’s P/F ratio technique is very high and inconsistent in comparison to results of MMP P/F’ ratio technique &TFRs by Gompertz model. But TFRs by MMP P/F’ ratio is very consistent and close to TFRs Calculated by Dr Pradeep Mishra and Dr Rajesh chauhan by use of Gompertz model. Limitation of Gompertz model for estimating TFRs is that ,it slightly over estimates fertility ,due to recall lapses by older cohorts. But worksheets developed by UN does take care of this and by considering the adjustment based on younger ages, where recall lapses are to be relatively on reduced scales. On comparing TFRs by MMP P/F’ technique to the TFRs by Gompertz model ,it is very clear that TFRs by MMP technique is in lower side and consistent, in almost cases.
Conclusion: Due to change in socio-economic condition of women, improvement in educational level and awareness in women, use of contraceptive and development in society, fertility trend follows neither linear trend nor second degree polynomial. Thus, it was realized that fertility follows some different trend and it re- quires some modification in methodology due to change in assumption. It was also realized that logistic curve(growth curve) is most suitable curve for fertility. So use of fitted logistic curve for estimating average parity equivalents F’(i) by interpolation was used. Results by this technique are most appropriate and consis- tent. I hope that,this modifications may give new dimension in demography. I am indebted for guidance and encouragement provided by DR Pradeep Mishra (Additional Director ,Population Research Centre Lucknow).
14
REFERENCES:
(1) BOOK: Fundamentals of Applied Statistics; By S.C. Gupta & V.K. Kapoor, Sultan Chand & Sons, Educational Publisher,
New Delhi.(Chapter2, Time series analysis).
(2)U.N. Manual, Chapter II, Estimation of fertility, based on information about children ever born.
Instruction manual & Fertility tables of Census of India -2001.
(3)Article: Dr Pradeep Mishra, Population Research Centre, Lucknow University & Dr. Rajesh Chauhan, Directorates of Eco-
nomics & Statistics, Department of Planning, Government of U.P.,Fertility trends in Uttar Pradesh : An Analysis Based on Cen-
sus data.
(4)Coale,A.J. and C.Y. Tye 1961 “The significance of age pattern of fertility in high fertility population “. Mill bank memorial
Fund quarterly 34; 631-646.
(5)POPULATION ANALYSIS SPREADSHEETS(PAS) which was developed by U.S. BUREAU OF THE CENSUS INTERNATIONAL PROGRAMS CENTER with some modifications, to estimate TFRs.
15