International Journal of Scientific & Engineering Research,Volume 4, Issue11, November‐2013 1805
ISSN 2229‐5518
Modeling of a standalone Wind-PV Hybrid
generation system using MATLAB/SIMULINK
and its performance analysis
Mohammed Aslam Husain, Abu Tariq
Abstract—This work focuses on the modeling and analysis of a Standalone wind-PV Hybrid generation system under different conditions in MATLAB/SIMULINK environment. The proposed system consists of two renewable sources i.e. wind and solar energy. Modeling of PV array and wind turbine is clearly explained. The wind subsystem is equipped of a direct driven permanent-magnet synchronous generator, a diode rectifier and a buck converter for the tracking of the maximum power point. In photovoltaic system the variable DC output voltage is controlled by another buck converter used for the MPPT. These two systems are combined to operate in parallel and the common DC bus collects the total energy from the wind and photovoltaic subsystems and uses it partly to charge the battery and partly to the DC load. This paper offers a useful wind-PV hybrid model which can be used for performance analysis of such systems.
Index Terms—Buck converter , Insolation,MATLAB simulation , PV array, PMSG , temperature, turbine, wind speed.
————————————————————
1 INTRODUCTION
HE rising consumption rate of fossil fuels and the pollu- tion problem associated with them has drawn worldwide attention towards renewable energy sources. A combina-
A photovoltaic (PV) system is the most simple and reliable way to produce electricity from the conversion of solar energy. The basic building device of SPV system is SPV cell. The out-
IJSER
tion of two or more renewable energy sources is more effective
as compared to single source system in terms of cost, efficien-
cy and reliability. Properly chosen renewable power sources
will considerably reduce the need for fossil fuel leading to an
increase in the sustainability of the power supply.
Standalone Wind/PV hybrid generation system offers a feasi-
ble solution to distributed power generation for isolated locali-
ties where utility grids are not available. It is also free from
pollution what makes it more attractive. For isolated localities,
one practical approach to self-sufficient power generation in-
volves using a wind turbine and PV system with battery sto-
rage to create a stand-alone hybrid system [1, 2].
The common types of AC generator in modern wind turbine
systems are as follows: Squirrel-Cage rotor Induction Genera-
tor; Wound-Rotor Induction Generator; Doubly-Fed Induc-
tion Generator; Synchronous Generator (With external field
excitation); and Permanent Magnet Synchronous Generator
[3]. However, in this paper the variable-speed directly-driven
multi-pole permanent magnet synchronous generator (PMSG)
wind architecture is chosen for this purpose, it offers better
performance due to higher efficiency and less maintenance
because it does not have rotor current. PMSG can be used
without a gearbox, which implies a reduction of the weight of
the nacelle and reduction of costs [1].
put of SPV system may be directly fed to the loads or may use
a power electronic converter to operate it at its maximum
power point. [5,6].
The main task of this paper is to develop a simulation model
of a standalone hybrid generation System including wind and
PV subsystems using MATLAB/SIMULINK system. Charac-
teristics of modeled wind turbine and PV panel have been
shown for different conditions. This paper includes in details
the equations that form the wind turbine and PV panel. The
two systems are combined to operate in parallel. Each of the
two subsystems; namely PV subsystem and wind subsystem is
controlled by its own controller. Each controller will guide its
own system to track the maximum power [4, 5]. The aim of
this paper is to provide the reader with all necessary informa-
tion to develop wind turbine models and PV panel that can be
used in the simulation for a standalone wind/PV generation
system and for further study of such systems.
2 MODELING OF WIND TURBINE
The power captured from the wind turbine is given as by rela- tion [1,2].ρ is the air density, which is equal to 1.225 kg/m3, Cpis the power coefficient Vwis the wind speed in m/s and A is the area swept by the rotor in m2.
Pw=1/2 Cp ρAVw
(1)
—
———————————————
• Mohammed Aslam Husain is currently working as Assistant Professor in Department of Electrical Engineering,AligarhMuslim University, ZHCET,Aligarh , INDIA. E-mail: mahusain87@gmail.com
• Dr.Abu Tariq is currently working as Associate Professor in Department of Electrical Engineering, Aligarh Muslim University, ZHCET, Aligarh , INDIA. E-mail: mahusain87@gmail.com
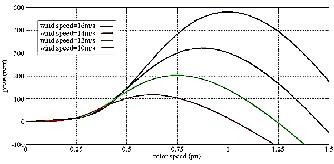
The amount of aerodynamic torque Tw in N-m is given by the ratio between the power extracted from the wind and the tur- bine rotor speed ww in rad/s, as follows
Tw = Pw/ ww (2) Mechanical torque transmitted to the generator is the same as the aerodynamic torque since there is no gearbox. The power coefficient Cp reaches maximum value equal to 0.593 which means that the power extracted from the wind is always less than 59.3% (Betz’s limit) because various aerodynamic losses
IJSER © 2013 http://www.ijser.org
International Journal of Scientific & Engineering ResearchVolume 4, Issue 11, November‐2013 1806
ISSN 2229-5518
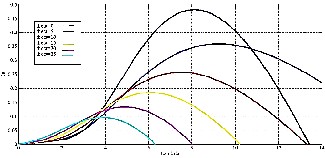
depend on rotor construction [6, 7]. The general function de- fining the power coefficient as a function of the tip speed ratio
and the blade pitch angle is defined as

Since this function depends on the wind turbine rotor type, the coefficient c1-c6 and x can be different for various turbines. The coefficients are equal to: c1=0.5,c2=116,c3=0.4,c4=0,c5=5,c6=21 (x is not used because c4=0). Additionally the parameter is also defined as
 (4)
(4)
Where is the pitch angle and the tip speed ratio λ is de- fined as
Fig. 3. Cp vs. Lambda characteristics for various blade pitch angle
λ=wwR/Vw (5)
Where ww is the angular velocity of rotor [rad/s], R is the rotor radius [m] and Vw is wind speed [m/s] [1, 2, 8].
The model of the wind turbine implemented in Simulink is
shown in figure 1 and figure 2 shows the mask of wind tur-
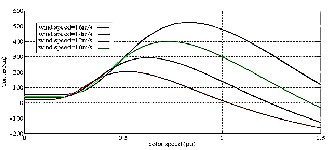
Fig. 4. Power vs. speed curves for different wind speeds
bine [4,6].
IJSER
Fig. 1. Wind Turbine model
Fig. 2. Mask of Wind Turbine
3 PMSG WIND ENERGY GENERATION SYSTEM
The direct driven wind turbine concept with multi-pole per- manent magnet synchronous generator (PMSG) and full-scale frequency converter is an auspicious but not yet very popular wind turbine concept for modern wind turbines[8].
Fig. 5. Torque vs. speed curves for different wind speeds.
Since a gearbox causes higher weight, losses, costs and de- mands maintenance, a gearless construction represents an effi- cient and robust solution, which could be very beneficial espe- cially for offshore applications. Moreover, due to the perma- nent magnet excitation of the generator the DC excitation sys- tem can be eliminated reducing again weight, losses, costs and maintenance requirements. The efficiency of a PMSG wind turbine is thus assessed to be higher than for other concepts. However, the disadvantages of the permanent magnet excita- tion are the still high costs for permanent magnet materials and a fixed excitation, which cannot be changed according to the operational point. As multi-pole permanent magnet gene- rators are low speed applications and generally connected to the grid through a frequency converter system, the generator has no damper winding in the rotor core. Moreover, due to the permanent excitation a PMSG has no field windings, in which transient currents could be induced or damped respectively. Hence, in case of load changes the field windings would not contribute to damping either. As neither a damper nor field- winding exists in a PMSG, no transient or sub-transient reac-
IJSER © 2013 http://www.ijser.org
International Journal of Scientific & Engineering ResearchVolume 4, Issue 11, November‐2013 1807
ISSN 2229-5518
tances, as known for wound rotor SGs, can be defined for the
PMSG.
i.e.
Xd= Xd' = Xd''
Xq= Xq' = Xq''
XdandXq-synchronous reactance
Xd' and Xq' -transient reactance
Xd'' and Xq'' -sub-transient reactance
However, as the multi-pole PMSG is a low speed application
with slow dynamics, a damper winding is less important.
However, a damping of the system must then be applied by
means of the converter control [7, 8].
DC-DC converter is used to buck the rectified voltage. In the
converter circuit the gate receives the pulse from PWM gen-
erator. The corresponding Simulink model is shown in Figure
7. A 480W, 34 pole, 300 rpm rated speed, permanent-magnet
synchronous generator(PMSG), a diode rectifier and a
(DC/DC) buck converter for the tracking of the maximum
power point is used in this model. Lead acid battery used here
has a nominal voltage rating of 48V [4, 5].
4 MODELING OF PHOTOVOLTAIC CELL
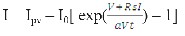
The basic equation from the theory of semiconductors [9] that mathematically describes the I-V characteristic of the ideal
Fig.6: Single-diode model of the theoretical photovoltaic cell.
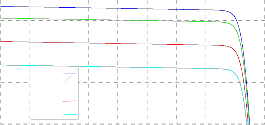
Fig.7: A typical, current-voltage I-V curve for a solar cell for different load.
 (8)
(8)
Figure 7 is obtained using Equation 3 [9, 10].
Ipv = ( Ipv,n+ K1∆T )G/Gn (9)
Where Ipv,n[A] is the light-generated current at the nominal condition (usually 25 oC and 1000W/m2), ∆T = T − Tn, G
photovoltaic cell is:
[W/m2] is the irradiation on the device surface, and Gn is the nominal irradiation.
(6)
Where: Iphis the short-circuit current that is equal to the photon generated current.
(7)
Id is the current shunted through the intrinsic diode.The di- ode current Id is given by the Shockley’s diode equation; Vdis the voltage across the diode (D). k is Boltzmann constant ,q is electron charge ,Io is reverse saturation current of diode ,Tc is reference cell operating temperature (25 °C).Practical arrays are composed of several connected photovoltaic cells and the observation of the characteristics at the terminals of the pho- tovoltaic array requires the inclusion of additional parameters to basic equation [9 ,13, 14].
Figure 6 shows Single-diode model of the theoretical pho-
tovoltaic cell and Fig.7 shows the I-V curve for a solar cell for
different load. If the load R is small, the cell operates in the
region M-N of Fig.7, where the cell behaves as a constant cur-
rent source, almost equal to the short circuit current. On the
other hand, if the load R is large, the cell operates on the re-
gions P-S of the curve, the cell behaves more as a constant vol-
tage source, almost equal to the open-circuit vol-
tage[11,12].Equation 8 represents the practical SPV cell equa-
tion and describes the single-diode model presented in Fig.6.
Iph is the saturation current of the array. Vt = NskT/q is the
thermal voltage of the array with Ns cells connected in se-
ries.Rs is the equivalent series resistance of the array and Rp is
the equivalent parallel resistance.
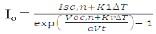
(10)
The reverse saturation current at the reference temperature is given by the eq. 10 [9, 10, 15].The value of the diode constant
‘a’ may be arbitrarily chosen. Many authors discuss ways to estimate the correct value of this constant.Usually 1 ≤ a ≤ 1.5 [10].Equation 11 shows the PV cell model current, Im, referring to the appropriate model circuit as in figure 6 [9].
 (11)
(11)
Equation 12 depicts the equation used to model PV array.
 (12) Table I shows the parameters of the PV module. The simula- tion results of the PV module are shown in Fig.8 & Fig.9.
Table I. Parameters used in PV module for the different char- acteristics
IJSER © 2013 http://www.ijser.org
International Journal of Scientific & Engineering ResearchVolume 4, Issue 11, November‐2013 1808
ISSN 2229-5518
6
5
4
3
1000w/m2
2
900w/m2
1 700w/m2
500w/m2
0
0 10 20 30 40 50 60 70 80 90
Voltage(V)
Fig. 8:i- v characteristics of solar array at variable solar insolation,250c
Fig. 10: Standalone wind/PV hybrid system
Mechanical energy from the wind turbine drives the wind gen- erator to generate a.c. electric power, which is converted into d.c.
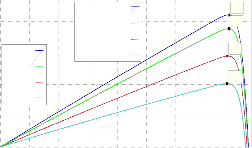
400
300
200
100
0
1000w/m2
900w/m2
700w/m2
500w/m2
V=78.4,Pmax=421.5
V=78.28,Pmax=377.9
V=77.7,Pmax=290.3
V=77.51,Pmax=202.7
X: 78.4
Y: 421.5
X: 78.28
Y: 377.9
X: 77.7
Y: 290.3
X: 77.51
Y: 202.7
power to form the common dc link. PV array generates dc power [4, 5]. Each of the two subsystems; namely PV subsystem and wind subsystem is controlled by its own controller. Each control- ler will guide its own system to track the maximum power [4, 5,
16].The system power output depends on the climatic conditions (wind, sun), and on the battery state of charge. It can be tested for different system operations.
The control strategy used here controls the battery state of charge by keeping the DC bus voltage around the rated battery voltage
0 10 20 30 40 50 60 70 80
Voltage(V)
Fig. 9: p- v characteristics at variable temperature, 1000W/m2
(i.e.48V).The wind subsystem is a 480 W wind generator
equipped of a direct driven permanent-magnet synchronous
generator (PMSG), a diode rectifier and a (DC/DC) buck con-
IJSEverter for the tracRking of the maximum power point.
5 WIND-PV HYBRID GENERATION SYSTEM
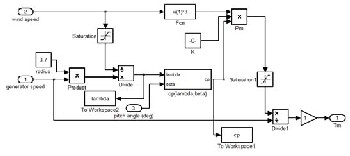
Figure 10 shows the proposed system which consists of a wind turbine, a variable speed direct-drive wind generator, a wind- side ac/dc converter, a solar array, dc/dc converters and a common dc load in parallel with a battery.
A 420 W photovoltaic panel is used, whose variable DC output
voltage is controlled by another (DC/DC) buck used for the
MPPT. The common DC bus collects the total energy from the
wind and photovoltaic subsystems and uses it partly to charge
the battery and partly to the DC load. Figure 11 shows the block
diagram of simulated standalone hybrid PV-Wind system.
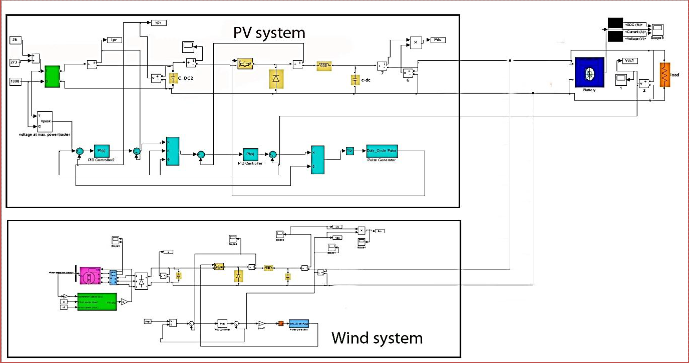
Fig. 11: Block diagram of standalone hybrid system
IJSER © 2013 http://www.ijser.org
International Journal of Scientific & Engineering ResearchVolume 4, Issue 11, November‐2013 1809
ISSN 2229-5518
6 SIMULATION RESULTS
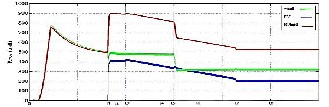
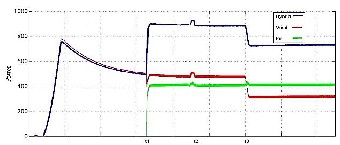
In figures 12 and 13 at time t1 the power output of PV system reaches its maximum steady state value of 421.5watts at
1000w/m2. At t3 the insolation starts decreasing linearly till t7 and reaches 500w/m2, so the power output of PV system also de- creases linearly and reaches a value of 202.7watts. At t2 the power output of wind system reaches its maximum value of 479.8watts at 16m/s. As the wind speed changes to 14m/s at t5, the power output of wind system changes to 321.5 watts.
Figure 13 shows the variation of output current and voltage of the hybrid system. The power output of hybrid system shown by red line in figure 14 is almost equal to the sum of power outputs of both wind and PV system at any instant of time. At t2 power out- put of hybrid system is almost equal to 900watts which is equal to the sum of power output of wind (479watts) and PV (421watts) system at t2.
Figures 14, 15 and 16 show and explain different characteristics of
the Hybrid system for step change in wind speed from 16 to
14m/s and for linear change in insolation from 1000 to 500w/m2
and back to 1000w/m2.
Similarly figures 17, 18 and 19 show and explain different charac-
teristics of the Hybrid system for step change in wind speed from
16 to 14m/s and for a step change in temperature from 25 to 40oC.
With change in insolation, temperature and wind speed the out-
put power of the standalone hybrid system changes and power
sharing between PV and wind system is shown in table II.
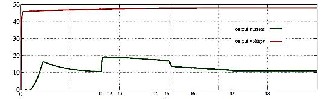
Fig.13: Output voltage and current of Hybrid system for step change in wind speed from 16 to 14m/s and for a linear change in insolation from
1000 to 500w/m2
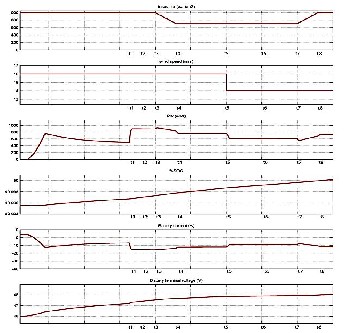
Fig. 14: Power output of different systems for step change in wind speed from 16 to 14m/s and for a linear change in insolation from 1000 to
ER
500w/m2
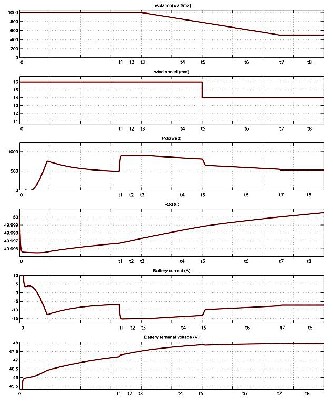
Fig. 15: Different characteristics of the Hybrid system for step change in wind speed from 16 to 14m/s and for linear change in insolation from 1000
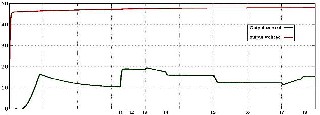
Fig. 12: Different characteristics of the Hybrid system for step change in
to 500w/m2
and back to 1000w/m2.
wind speed from 16 to 14m/s and for a linear change in insolation from
1000 to 500w/m2.
Fig. 16: Output voltage and current of Hybrid system for step change in wind speed from16 to 14m/s and for linear change in insolation from 1000
to 500w/m2 and back to 1000w/m2.
IJSER © 2013 http://www.ijser.org
International Journal of Scientific & Engineering ResearchVolume 4, Issue 11, November‐2013 1810
ISSN 2229-5518
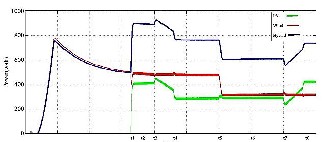
Fig.17: Power output of different systems for step change in wind speed from 16 to 14m/s and for linear change in insolation from 1000 to 500w/m2 and back to 1000w/m2.
Fig.20: Power output of different systems for step change in wind speed from 16 to 14m/s and for a step change in temperature from 25 to 40oC.
TABLE II. POWER OUTPUT OF STANDALONE HYBRID SYSTEM FOR DIFFERENT CONDITIONS

7 CONCLUSION
Feasibility study of a Wind-PV hybrid generation system was conducted at designing stage. ASIMULINK model of the Wind-PV hybrid generation system is proposed and all the necessary models of the system components were addressed. Various results were obtained at different operating condi- tions and these results were found to be satisfactory. Power sharing by each subsystem was also found to be in accor- dance.This paper is very useful for modelling and for basic analysis of Wind-PV hybrid system. With further modification this model can be used for the modelling of Grid connected Wind-PV system.
REFERENCES
Fig.18: Different characteristics of the Hybrid system for step change in wind speed from 16 to 14m/s and for a step change in temperature
from 25 to 40oC.
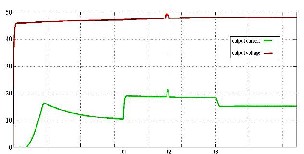
Fig. 19: Output voltage and current of Hybrid system for step change in wind speed from16 to 14m/s and for a step change in temperature from 25
to 40oC.
[1] Alejandro Rolan, Alvaro Luna, Gerardo Vazquez, Daniel Aguilar, Gustavo Azevedo, “ Modeling of a Variable Speed Wind Turbine with a Permanent Magnet Synchronous Generator ”. IEEE International Symposium on Industrial Electronics (ISlE
2009) Seoul Olympic Parktel, Seoul, Korea July 5-8, 2009.
[2]Polinder H., de Haan S. W. H., Dubois M. R., Slootweg J., ”Basic Operation Principles and Electrical Conversion Systems of Wind Turbines”, NORPIE / 2004, Nordic Workshop on Power and Industrial Electronics, Paper 069, Trondheim, Norway, 14-16 June,
2004.
[3] MittalR., Sandhu K. S.and Jain D. K. “Low voltage ride-through (LVRT) of grid interfaced wind driven PMSG,” ARPN Journal of Engineering and Applied Sciences., 2009, vol. 4, no. 5. Pp. 73-83.
[4] Dali M., Belhadj, J., Roboam, X. and Blaquiere, J.M. “Control and energy management of a wind photovoltaic hybrid system”, Proc. EPE Conference, 2-5 Sept. 2007, pp 1-10.
IJSER © 2013 http://www.ijser.org
International Journal of Scientific & Engineering ResearchVolume 4, Issue 11, November‐2013 1811
ISSN 2229-5518
[5] Dali M., Belhadj J., Roboam X., “Hybrid solar-wind system with battery storage operating in grid–connected and standalone mode: Control and energy management - Experimental investigation”, Energy 35 (2010) 2587-2595.
[6] Akhmatov V., “Variable-Speed Wind Turbines with Doubly-Fed Induction Generators Part III: Model with the Back-to-back Converters”, Wind Engineering, Volume 27, No. 2, pp 79-91, 2003
[7] Hansen A.D., Michalke G., “Modelling and control of variable speed multipole PMSG wind turbine”, submitted to Wind Energy, 2007.
[8] Hong-Woo Kima, Sung-SooKimb, Hee-Sang Koa, “Modeling and control of PMSG-based variable-speed wind turbine”, Electric Power Systems Research 80 (2010) 46–52.
[9] I. Altas, A.M.Sharaf, 2007 “A photovoltaic array (PVA) simulation model to use in Matlab Simulink GUI environment.” IEEE I-4244-
0632 -03/07.
[10] Marcelo GradellaVillalva, Jonas Rafael Gazoli, Ernesto RuppertFilho, “Modeling and circuit-based simulation of photovoltaic arrays”, 10th Brazilian Power Electronics Conference (COBEP), 2009.
[11] J. Hyvarinen and J. Karila.New analysis method for crystalline silicon cells.InProc. 3rd World Conferenceon Photovoltaic Energy Conversion, v. 2, p. 1521–1524, 2003.
[12] E. Koutroulis, K. Kalaitzakis, and V. Tzitzilonis.Development of a
FPGA-based system for real-time simulation of photovoltaic modules.Microelectronics Journal,2008.
Authors

Mohammed Aslam Husain was born in Go- rakhpur, India, in 1987. He received the B.Tech and M.Tech degree in electrical engineering from Aligarh Muslim University, Aligarh, in 2010 and 2012, respectively. Currently he is a faculty member in Department of Electrical Enginee- rin, Aligarh Muslim University, Aligarh. His re- search interests include renewable energy
generation and power electronics.

Dr. Abu Tariq obtained B.Sc Engg. and M.Tech Degree from Ali- garh Muslim University in 1988 and 1999 respectively. He completed his Ph.D. from Aligarh Muslim University in 2006. Currently he is an Associate Professor in Department of Electrical engineering, Aligarh Muslim Univer- sity. His research area includes Power Elec- tronics and it Application on Photovoltaic Sys- tems and Drives.
[13] Geoff Walker. Evaluating MPPT converter topologies using a matlab PV model.Journal of Electrical &ElectronicsEngineering, Australia, 21(1), 2001.
[14] W. De Soto, S. A. Klein, and W. A. Beckman. Improvement and validation of a model for photovoltaic array performance.Solar Energy, 80(1):78–88, January 2006.
[15] Glass.M.C., “Improved solar array power point model with SPICE realization,” in Proc. 31st Intersoc. Energy Convers.Eng.Conf. (IECEC), 1996, vol. 1, pp. 286–291.
[16] Kuo.Y.C., Liang.T.J. andChen.J.F., “Novel maximum-power-point tracking controller for photovoltaic energy conversion system,” IEEE Trans. Ind. Electron., 2001, vol. 48, no. 3, pp. 594–
601.Conclusion
IJSER © 2013 http://www.ijser.org