International Journal of Scientific & Engineering Research, Volume 6, Issue 1, January-2015 721
ISSN 2229-5518
Modeling of Corona Effect in AC Transmission
Systems
Muhammad Ahmed Dawood 1, Dr. Ghous Buksh Narejo 2
1(Electrical Engineer, Research and Manufacturing Department, Green Wind Global Inc Canada, Ph. +519-992-6589
2 (Associate Professor, Department of Electronic Engineering, NED University of Engineering and Technology, Karachi, Ph. +92-333-3004549 , Email. ghousnarejo@gmail.com
ABSTRACT : Corona effect has been considered as a source of substantial loss particular to High Voltage AC Transmission lines. The project report presents comprehensive account of development of a Matlab Simulink based model for the Corona Effect which is designed considering Peek’s equation. The model provides analysis of Corona loss impact on Transmission power in response to the variation in the factors on which Corona effect depends upon. The transmission power has been simulated to plot Corona losses based on variation in Temperature, Conductor Radius and Conductor spacing.
Keywords - Corona Model, Corona Loss, Peeks Equation, Transmission line losses.
—————————— ——————————
I. INTRODUCTION
The project primarily comprises of three divisions which include modeling of Corona effect, calculation and finally the calculation of Back Corona discharge
.The author has completed the development of Corona
effect model on Matlab Simulink over different transmission voltage levels considering the impact of constituent factors and their impact.
The report initiates its coverage by providing the
introduction of the Corona effect in order to present the project with essential theoretical information.
A. Definition
Corona is a luminous discharge due to ionization of the air surrounding a conductor around which exists a voltage gradient exceeding a certain critical value [1].
B. Phenomena Explanation
When the electric field intensity at the surface of the conductor increases beyond a critical value, the electrons are compiled on that surface which is responsible for production of corona arc.
As there are always some amount of free electrons in the surrounding air of the conductor due to traces of radioactive material in earth’s crust and cosmic ray bombardment of the earth from outer space. When the conductor is energized with AC voltage these electrons
which are having negative inherent charge are directed
towards the conductor in the positive half cycle and away from conductor in the negative half cycle.
So this velocity gained by the free electrons in the air is much dependent on the electric field intensity. During normal conditions i.e., before corona occurrence electric field intensity is less, the free electrons in air collides with the other air molecules in air such as oxygen (O 2) and nitrogen (N2 ) in elastic manner which means that there is no energy transfer from free electron to air molecule. On the other hand, when the electric field intensity increases beyond the critical value where corona actually happens, the collision between free electrons in air and the molecules in air is inelastic which means that energy is transferred from free electron to air molecule. Hence, the air gets ionized and this is the phenomenon of ionization of air.
At this instant, air behaves as a conductor due to which luminous discharge is seen. This will result in power loss in that transmission line.
Corona is affected by the weather conditions – When the climate around the network is humid and moist, corona loss is more when compared to the normal conditions [1].
C. Identification
This effect is seen in a form of a violet or purple luminous light – Corona arc is a bit different from the
IJSER © 2015 http://www.ijser.org
International Journal of Scientific & Engineering Research, Volume 6, Issue 1, January-2015 722
ISSN 2229-5518
normal arc. Usually, a normal arc is seen between two points which can be wire to another wire or from wire to ground but the corona arc is seen from a point at a conductor to a particular point in ionised air.
Hissing noise is also heard – produced due to explosive gas expansions around the conductor. Nowadays, it is also detected by modern detectors which employ ultrasound technology like Ultrasonic leak detector, Uvirco Multi camera etc [2].
D. Effects of Corona on Conductor
Its impact on the transmission equipment:
1) It degrades the life span of a conductor
2) It reduces the reliability of the transmission system, which leads the equipment to the breakdown at the end.
3) It also causes mechanical erosion of the system
As a consequence corona results in production of:
1) Ozone, as there is electric discharge in the air, the oxygen (O2) atoms in the air splits into two and forms combines to form ozone O3 .
2) Sound, hissing sound is audible around the transmission lines
3) Light, sharp glow and violet plume is visible
4) Heat- produced in little amount but has impact over conduction property of material.
5) Salt- which can be seen deposited on the surface of the conductor in white powdered form
6) Carbon deposits, which create path for arc formation.
II. CORONA EFFECT AND ITS DEPENDENT FACTORS
A. Applied Voltage
The supply voltage is directly proportional to corona loss. When the supply voltage increases the electric field around the conductor will also increase which will result in an increased corona.
B. Supply Frequency
Corona loss is directly proportional to supply frequency. Higher the supply frequency higher is corona loss. This can be understood well by studying Peek’s equation which is explained in this report below.
C. Load Current
When load current is high, the temperature of the conductor is more. Thus, it prevents the deposition of snow or dew drops as a result corona reduces.
D. Conductor Diameter
If the conductor diameter is less, the surface field intensity of that conductor is more which results in more corona effect. In order to reduce this surface field intensity we need to increase the conductor diameter.
E. Conductor Type
If we are using single conductor per phase, then there will be more corona loss and more interference to nearby communication systems, to overcome this we can employ two or more conductors (bundled conductors) per phase. By adapting this method, the geometric mean distance of the conductor increases due to which surface field intensity decreases which will help in reducing corona.
F. Conductor Spacing
Whenever there is less space between two parallel conductors, the electrostatic stress of one conductor on the other is more due to which corona occurs. In order to avoid this, spacing between conductors should be more so that there is less electrostatic stress between them.
G. Conductor Surface and Finishing
Rough and uneven surface will give rise to corona loss. As this unevenness on the surface is responsible for decreasing the value of breakdown voltage. This rough surface is seen in stranded conductor; hence corona is more in stranded conductor when compared to smooth conductor.
H. Conductor Shape
The cylindrically shaped conductor has more field uniformity than any other shaped conductor. So, cylindrical conductor is more preferable to stay safe
from corona.
IJSER © 2015 http://www.ijser.org
International Journal of Scientific & Engineering Research, Volume 6, Issue 1, January-2015 723
ISSN 2229-5518
I. Ambient Conditions
When the number of ions in air is more the conductivity of the air increases resulting in the corona effect. Usually, ions in air are more during thunderstorms, rainy and moist atmospheric conditions.
J. Transmission Line Sea Level
The height of the conductor from sea level also affects the corona loss. At large heights above sea level, the quantity of ions per cubic centimeter is high [3].
III. CORONA EFFECT REMEDY
By studying the above factors, we can understand that corona can be prevented by doing some sought of variations in the values of the factors like,
1) Lowering the Applied Voltage
2) Employing Conductors of Large Diameters
3) Maintaining Large Distance between Conductors
4) Employing Good Quality and Smooth Conductors
IV. MODELING OF CORONA EFFECT
Since the project is studying the Corona effects in AC transmission lines, the most reliable mathematical equation to simulate the losses is the famous Peek’s equation. Peek studied the corona effects and all factors that contribute to all noticeable changes along the transmission lines.
An extended empirical peek’s equation is presented to compare all variables
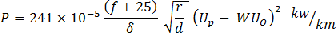
P is the Corona power loss in kW/km, f is the system frequency,  is the air density factor, r is the radius of the conductor in cm, d is the distance of two parallel conductors, Up is the applied voltage (line to neutral ) in KV and Uo is the disruptive voltage of the Corona, W is the weather factor
So to study the disruptive voltage Uo , we should start with the electric field intensity at any point between two
parallel conductors and X cm away from the first conductor

The potential different between the conductors

Since r is very small with respect to d, we substitute for q in E x
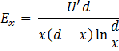
U’ is the line to neutral voltage in the system
The critical disruptive voltage is known to be the voltage where a complete disruption of the dielectric happens, when the surface gradient voltage is equal to the breakdown strength of the air.
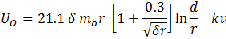
Where m0 is the wire irregularity factor that can be predefined as 1-0.95 when the transmission line is made of a very smooth and well treated wire, and it is 0.89-
0.82 in case of rough cable.

b is the barometric pressure of the mercury in cm and t is the temperature in degrees Celsius . Also it is believed that on bad weather the disruptive voltage Uo decreases to 80% of its value in fair weather. So as we go on investigating all factors, worse condition which happens in bad weather will be looked at as well.
It is important to notice that the formula holds only when the radius and distance start from reasonable values and stops when Uo reaches Up.
The above equations are more reliable in high voltages which are used in electric transmission so all results will be based on 230kv up to 765kv [3].
IJSER © 2015 http://www.ijser.org
International Journal of Scientific & Engineering Research, Volume 6, Issue 1, January-2015 724
ISSN 2229-5518
V. MATLAB SIMULINK MODEL
To study all calculations and all factors manipulation,
Matlab tool Simulink is used. Simulink is an easy tool to monitor the output change with respect to each element adjustment. A scope will be put on the output to plot it clearly with all changes.
The sub blocks involved in the design are represented in Fig.3.The sub block has realization of all the factors on which the corona effect depends upon through Peeks equation.
VI. SIMULATION & RESULTS
A. System Frequency Impact on Corona
As we learnt before that frequency plays an important role in AC transmission lines and when it comes to Corona losses, it is directly proportional to the system frequency as it increases the field intensity on the cable surface which leads to increase in the losses.
For example, in a 230 KV transmission line system and in fair weather condition (W=1 and t=150) with cable parameters as r=3cm, d=400cm and mo =0.85:
P (f=50Hz) = 99 kW/km and P (f=60Hz) =
112 kW/km
B. Radius of Conductor effect on Corona
Conductor Radius is considered to be the most valuable factor in evaluating Corona and also the key point in commercially and economically designing the transmission system. Beside the material of the cable and type, a bigger radius leads to bigger surface area and less field intensity. As a result, Designers tend to be very careful in choosing the size of the cable (sometimes the type because it could be hallow cable or steel core cable which is relative to radius).
A series of results is to be viewed for different systems with respect to radius size. In our project, we implemented this increment of conductor radius on three different systems of rating 230kv, 365kv, 500kv. The results for these different systems are explained below.
1) 230 KV Transmission Line
From this figure, we notice the decrease in Corona
losses when we increase the cable radius as expected.
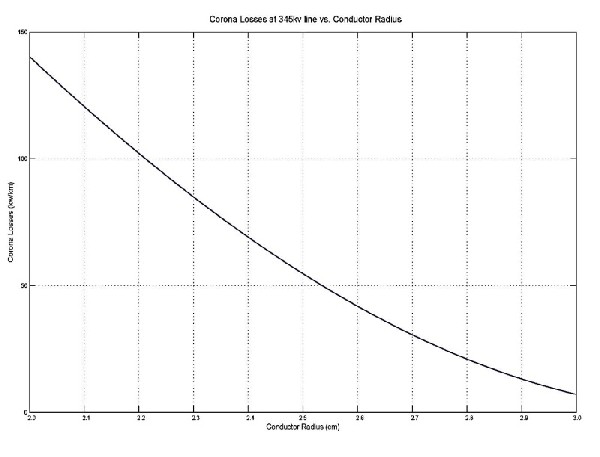
2) 345 KV Transmission Line
We see the corona losses at this voltage level vanishes after approximately a radius value of 3 cm which is industrially accepted.
Fig.6. Corona Losses at 500 KV Line vs. Conductor
Radius
3) 500 KV Transmission Line
Figure 6 shown below, depicts that for 500kv system the conductor Radius is required to be more than 5 cm to get rid of corona effect in the system. This is quite unacceptable due to economic reasons, as we know that along with the radius the cost of conductor also increases and that too employing 5cm radius conductor is a bit unreasonable.
C. Applied Voltage
The applied voltage on transmission lines are of high values due to the fact of the resistive power loss that corresponds to the current. As a result, voltages get stepped up before transmitting and save on resistive power loss from few kilo volts to 765 kV according to the length, delivered power and other requirements.
As for the corona loss, increasing the applied voltage will add to the corona loss directly and below is a comparison table to explain the effect of the system voltage on fixed structure (r=5 cm, d=5 Metre, f=60
Hz=15o and W=0.8).
D. Conductor Distance
Another important factor would be the distance of the parallel conductors as they tend to affect each other through electrostatic energy or electromagnetic energy. As a result, more energy will be given to surface electrons that will knockout more air ions and produce
more loss. We took the case of 230kv system with 4 cm
IJSER © 2015 http://www.ijser.org
International Journal of Scientific & Engineering Research, Volume 6, Issue 1, January-2015 725
ISSN 2229-5518
radius cable and increase the distance gradually and the result is shown in figure 7. And as expected, the corona losses decrease as the distance increases and almost disappear when the distance reaches 9 metre. Changing the distance between conductors is done through the transmission lines poles, because their structures define the distances among all lines.
E. Temperature
Temperature factor plays small role in corona loss and also it is something that practically cannot be changed. However the figure 8 shown below will examine the influence of changing temperature range, -20 to 30 degrees Celsius.
Due to the weather effect in corona loss, in fair weather the factor will be considered 1 that will lead to normal disruptive voltage value. On the other hand, since humidity, rain and snow weather affects the corona power loss directly which could lower Uo to as low as
80%. This is natural factor and unpredictable, so for designers worst condition with bad weather is considered.
VII. CONCLUSION
Various factors affecting corona loss plays a vital role in prevention of corona. Among those factors some are natural and some are equip mental factors in which we cannot fully control the natural causes but we can take certain measures.
All model results were in line with theory expectations with regards to each factor effect on corona loss. Peeks equation based model has proven to be effect to all variables studied in this project and the reliability is high when inputting reasonable values for all. Corona power can be acceptable to certain level but yet it should always be considered while designing transmission system beside resistive power loss calculations. Deploying the model at hand can save the designers a lot of time and efforts.
Moreover, economical study should follow to estimate the optimal parameters for all the system to utilize best
reliable delivered power with least cost as this is the
ideal goal from engineering perspective. Full awareness
of corona effects should be passed on to all industries dealing with power energy transmission. Yet, the corona phenomenon brings great usage to some applications and further researches and studies should focus on this field [4].
ACKNOWLEDGMENT
The author would like to thanks Dr Raju Govinda for his direction and support in this project.
REFERENCES
[1] D P Kothari, I J Nagrath, “Power Systems Engineering,” Tata McGraw-Hill Publishing Company Limited, 7 West Patel Nagar, New Delhi
110 008.
[2] Abhijit Chakrabarti, Sunita Halder , “Power System Analysis Operation and Control,” 3rded, Published by Asoke K. Ghosh. PHI Learning Private Limited, New Delhi 110 015.
[3] John J. Grainger & William D. Stevenson, Jr, “Power System Analysis,” McGraw Hill.
[4] U.A. Bakshi, M. V. Bakshi , “Transmission and
Distribution,” Published by Technical Publications
#1, Amit Residency412, Shaniwar Peth, Pune – 411
030, India.
Appendix: Figures
IJSER © 2015 http://www.ijser.org
International Journal of Scientific & Engineering Research, Volume 6, Issue 1, January-2015 726
ISSN 2229-5518
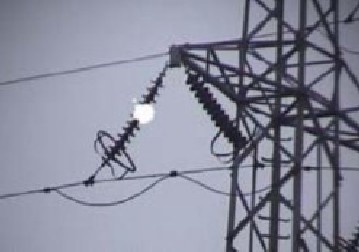
Fig.1. Visible Corona Effect in transmission line
IJSER © 2015 http://www.ijser.org
International Journal of Scientific & Engineering Research, Volume 6, Issue 1, January-2015 727
ISSN 2229-5518
Fig. 2. Developed Corona Model
IJSER © 2015 http://www.ijser.org
International Journal of Scientific & Engineering Research, Volume 6, Issue 1, January-2015 728
ISSN 2229-5518
Fig.3. Computational Schematic of Corona Model
IJSER © 2015 http://www.ijser.org
International Journal of Scientific & Engineering Research, Volume 6, Issue 1, January-2015 729
ISSN 2229-5518
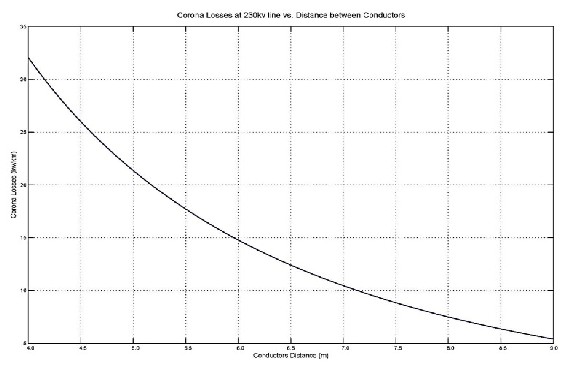
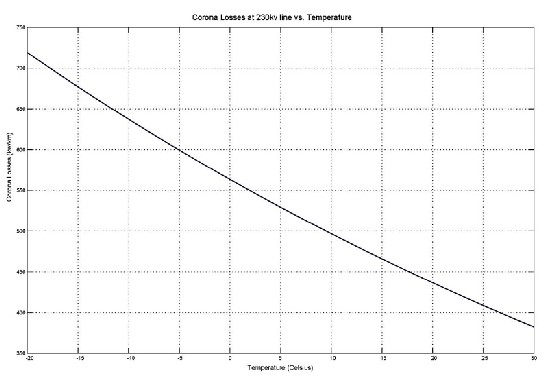
Fig.4. Corona Losses at 230 KV Line vs. distance between conductors
Fig.5. Corona Losses at 230 KV vs. Temperature
IJSER © 2015 http://www.ijser.org
International Journal of Scientific & Engineering Research, Volume 6, Issue 1, January-2015 730
ISSN 2229-5518
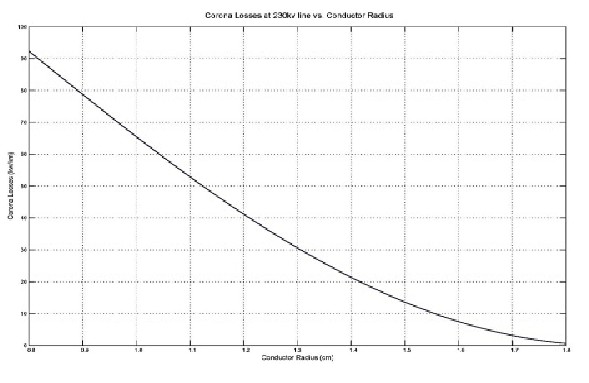
Fig.6. Corona Losses at 230 KV vs. conductor radius
IJSER © 2015 http://www.ijser.org
International Journal of Scientific & Engineering Research, Volume 6, Issue 1, January-2015 731
ISSN 2229-5518
Fig.5. Corona Losses at 345 KV Line vs. Conductor Radius
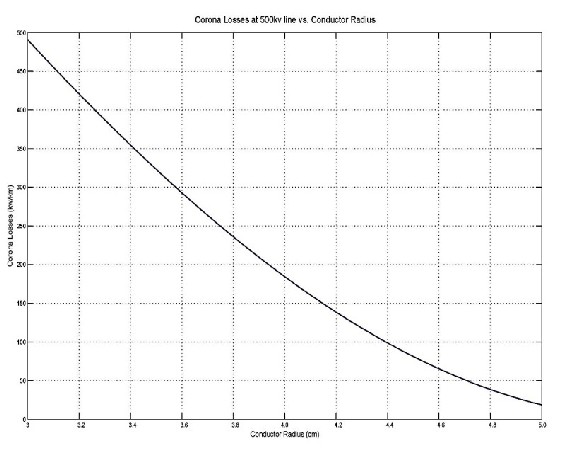
Fig.5. Corona Losses at 345 KV Line vs. Conductor Radius
IJSER © 2015 http://www.ijser.org
International Journal of Scientific & Engineering Research, Volume 6, Issue 1, January-2015 732
ISSN 2229-5518
\
IJSER © 2015 http://www.ijser.org