International Journal of Scientific & Engineering Research, Volume 4, Issue 4, April-2013 1321
ISSN 2229-5518
Modeling for Assured Quality Control in Flexible Pavements through e-Control – A Case Study Bant Singh, Dr. Srijit Biswas
Abstract--- The highways are the most widely accepted mode of transport system. So, in addition to the wide and efficient road network, the quality of the roads should be as per best available standards. Presently, the quality control tests are conducted physically in the field to check the quality of work. These tests are very large in number and take lot of time. There is no fool proof method to check that 100% material has been used at site as per desired standards. This paper deals with a model for the electronic control on the quality during the execution of flexible pavements. This study involves a real life problem faced by an engineer during the construction stage. In this paper, we present a methodology for assured quality control in the construction of a flexible pavement through e-control. To understand the methodology, a field case study is also presented here.
Index Terms— e-Control, RD, Assurance, GPS, Automatically, VTS, DBM etc.
—————————— ——————————
THE highways play a major role in the economic development of the country. The economic growth of the countries like USA is
1.6%, UK is 1.1%, France is 1.7%, Canada is 2.2%, Japan is (-) 0.6% and India is 6.1%. In India, there are 4.1 Million km of roads out of which National Highways (NHs) are 71,972 km, State Highways are 1,66,130 km, Major District Roads are 2,66,058 km and other roads are 36,05,633 km. The National Highways which are only 1.75% of total length of roads carries 40% of the traffic on the Indian roads. On the other hand the growth of vehicles in India is 13% in case of cars, 5% in case of trucks and 78% in case of two-wheelers. Road transport is the most widely prevalent used system of transportation. With the fast development of the country, the construction of Highways has increased manifold. In the present electronic age, everyone wants everything perfect to the best available standards and at the same time at a very fast speed. The road users want to travel on high quality and safe roads at a very fast speed. In the present system the quality control tests are physically conducted at site and are time consuming. Even after that the quality and quantity are not assured. So, the present system of quality control is neither perfect nor matching with the speed of construction of work. In keeping pace with the speed of construction, the age old quality control methods needs to be reviewed and substituted with modern methods of quality control and quality assurance [1]. So, it has become requirement of time to have a system in the highway construction which can control the quality of the highway construction automatically and at the same time at a very fast speed giving a confidence for the assured control on the quality and quantity of work. The present paper deals with the preparation of a model for assuring the quality and quantity in the construction of a flexible pavement through e-control.
In this section, some preliminaries have been presented which will be useful to our main work in next session.
The quality control involves the acceptance criteria which includes the tests, frequency of testing and tolerance limits, inspections for critical examination of the work by selected tests to determine its conformity to specifications and action taken to ensure quality [2]. Thus, the quality control system includes all those planned actions that are necessary to provide adequate confidence that the product or service will meet the requirements and is essentially a system of planning, organizing and controlling human skills to assure quality [3].
So, in a system, if it is ensured that 100% material has been used in a particular stretch of the road in a prescribed way & standards during the construction stage then it will also control the quality of the work. The flexible pavements will also require less maintenance provided a meticulous quality control system is exercised at all the stages during construction [4], [5].
In the present system, quality control exercise is made at three levels [6], [7] as below:
————————————————
Dr. Srijit Biswas, Professor and Head of Department, Civil Engineering, Manav Rachna International University, India, Ph.91-8800495683, E-
IJSER © 2013 http://www.ijser.org
International Journal of Scientific & Engineering Research, Volume 4, Issue 4, April-2013 1322
ISSN 2229-5518
(i) The contractor sets up a field laboratory and is supposed to carry out all the quality control tests to the stipulated frequency as per standards.
(ii) At the second stage, the quality control tests are being conducted by the Independent Engineer or field staff deployed for the execution of the work.
(iii) At the third stage, quality control tests are being conducted by the quality control wing/third party.
The followings are some of the drawbacks of the existing system of quality control:
The numbers of tests prescribed in the codes are more which are difficult to achieve.
The contractor does not engage requisite staff for the quality control tests.
The staff engaged on contract does not take interest in the quality control tests.
The tests are not conducted at site and only bogus entries are made in the prescribed registers.
The contractor simultaneously starts works on different roads of different departments such as PWD (B&R) & Marketing Board etc. and counts the same tippers of material on both the sites to use less quantity.
The staff deployed for the execution of work mixes up with the contractual agency and sub-standard work is
accepted.
There is no fool proof method to check that 100% material has been used.
In the present scenario when speed of Highway construction has increased manifold and the materials used in the construction are generally very large in quantities, the quantum of testing required is very large which is very difficult to achieve. To meet this requirement, a system is required which automatically controls the quality of work and gives a level of confidence for assured quality control. The system should also have control on the quantities of the material used at various stages of construction to check the pilferage of material and makes a complete check on the bogus entries of testing of materials on work.
A web based e-Quality Control System has been designed in such a way so that the live data at various stages of construction from site is directly loaded on the website along with live photographs. A special format has been designed for each activity of the construction stage and live data is placed in these prescribed formats. The system was so designed that no manipulation in data can be possible at a later stage. The system was further synchronized with Vehicle Tracking System (VTS) installed in various vehicles along with various devices such as vehicle diagnostic sensors, fuel sensor & Global Positioning System (GPS) etc. VTS is also used for tracking the vehicles and for making various other controls. The system checks the fuel consumption of vehicles in addition to check on the halt period of the vehicles etc. [8].
With fast development and huge investment in highway sector, the road construction is becoming equipment oriented. For achieving best quality and uniformity in production, the modern equipments with in-built e-control are installed which control the quality of the product [9]. The following are some of the modern equipments used at site:
| Batch mix type Hot Mix Plant with electronic sensor which automatically fractions and bitumen | controls proportion of different |
| Cone crusher (integrated stone crushing & screening plant) | |
| Automatic Wet Mix Plant with moisture content controller | |
| Concrete Batching & Mixing plant with automatic control | |
| Crushing and processing plant for GSB material | |
| Automatic weighing machine | |
| Paver finisher with electronic sensor | |
| Vibratory road rollers/compactor | |
| Nuclear Density Meter, Total Station & GPS |
Firstly, we select the project to carry out the work in field. GPS and cameras are installed at various desired locations at site. A
laptop enabled with camera and GPS instrument are given to every Engineer conducting tests in the field. Similarly, cameras
IJSER © 2013 http://www.ijser.org
International Journal of Scientific & Engineering Research, Volume 4, Issue 4, April-2013 1323
ISSN 2229-5518
and GPSs are installed at various other locations of plant site, weighting machine site, work site etc. All the relevant data collected at site at various stages of construction is placed on web site in live time in respect of the followings:
On receipt of bitumen at site
On mixing of bituminous material at plant site
On weighing at bridge site
On movement of vehicles
On work site
On testing of materials
To understand the above methodology, let us make a valid case study in a highway construction in India.
For a valid case study, we select a sanctioned project “Construction of NH-4 (Belgaum-Dharwad section from km.433 to km.515) executed in the State of Karnataka, India at an estimated cost of Rs.480.00 crores on DBFO (Design, Built, Finance & Operation) pattern. The execution of work is being carried out by National Highways Authority of India according to technical specifications laid down by Ministry of Road Transport & Highways (MoRT&H). For the sake of simplicity in presenting our methodology the data was collected at site. To have e-control at various stages of execution, the data was collected and evaluated as under:
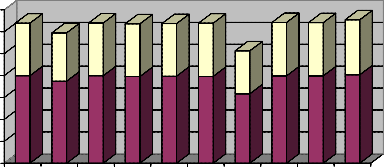
Generally the bitumen is received from the oil refineries. It has come to notice that in some cases, the bitumen tankers issued from the refinery do not reach the site & are sold in the open market and bitumen is received only in papers. So, it was felt necessary to have a control on the receipt of bitumen. To control this pilferage of bitumen, the photographs of the bitumen tankers were taken with the camera installed at site during its weighing on automatic computerized weighing machine and the details with project ID were placed in live time on the website. The details of 10 Tippers are shown in Table No.1 and the empty
& full weight of each tanker is also presented in Graph-1:
Tanker No. | Registration of tanker | Weight of loaded tanker (T) | Weight of empty tanker (T) | Weight of bitumen (T) | Refinery Indent No. | Photograph of Tanker |
1 | KA19 D911 | 31.960 | 12.010 | 19.950 | PL01/7727/CS/P2/11 | Photograph |
2 | MH04 EB4158 | 29.725 | 11.010 | 18.715 | PL01/7681/CS/P2/11 | Photograph |
3 | KA19 D1272 | 31.980 | 12.030 | 19.950 | PL01/1086/CS/P2/11 | Photograph |
4 | KA44 2767 | 31.800 | 12.030 | 19.770 | PL01/21149/CS/P2/11 | Photograph |
5 | KA19 D911 | 31.850 | 11.980 | 19.870 | PL01/27748/CS/P1/11 | Photograph |
6 | KA19 D1468 | 31.950 | 12.140 | 19.810 | PL01/27859/CS/P1/11 | Photograph |
7 | KA19 D9747 | 25.650 | 9.790 | 15.860 | PL01/28008/CS/P1/11 | Photograph |
8 | KA19 D912 | 32.100 | 12.190 | 19.910 | PL01/30412/CS/P1/11 | Photograph |
9 | KA19 D1272 | 32.070 | 12.150 | 19.920 | PL01/30945/CS/P2/11 | Photograph |
10 | KA19 D1138 | 32.710 | 12.540 | 20.170 | PL01/31375/CS/P2/11 | Photograph |
IJSER © 2013 http://www.ijser.org
International Journal of Scientific & Engineering Research, Volume 4, Issue 4, April-2013 1324
ISSN 2229-5518
Weight
1 2 3 4 5 6 7 8 9 10
Tanker No.
![]()
Weight of bitumen V/s Tanker No.
With this the complete history of the bitumen received from the Refinery is available on the website which is attached with the forthcoming bill of the agency as documentary evidence. So, it makes a complete check on the receipt of bitumen.
The proportions of various ingredients required for DBM are set on the computer of batch type hot mix plant [9]. The empty weight of the tipper in which the material is to be loaded is taken on weighing machine installed at site. Then the live data along with photographs is placed on web site. The data of ten such tippers with project ID is presented below in Table No.2 depicting various temperatures, %age of bitumen, photograph etc.
Tanker No. | Project ID | Date | Regd. No. of tipper | Type of material | Temp. of bitumen (oC) | Temp. of aggregates (oC) | Temp. of mixed material (oC) | % age f bitumen | Photo-graph |
1 | BDRP | 9.2.12 | KA22B5715 | DBM | 156 | 161 | 157 | 4.36 | Photograph |
2 | BDRP | 9.2.12 | TN30K6635 | DBM | 159 | 165 | 158 | 4.36 | Photograph |
3 | BDRP | 9.2.12 | TN30 L883 | DBM | 155 | 165 | 160 | 4.37 | Photograph |
4 | BDRP | 9.2.12 | TN30 L911 | DBM | 159 | 164 | 152 | 4.35 | Photograph |
5 | BDRP | 9.2.12 | TN30 L913 | DBM | 160 | 163 | 158 | 4.35 | Photograph |
6 | BDRP | 9.2.12 | KA22 B5715 | DBM | 158 | 165 | 156 | 4.35 | Photograph |
7 | BDRP | 9.2.12 | TN30 K6635 | DBM | 160 | 162 | 158 | 4.36 | Photograph |
8 | BDRP | 9.2.12 | TN30 L883 | DBM | 156 | 164 | 154 | 4.36 | Photograph |
9 | BDRP | 9.2.12 | TN30 L911 | DBM | 154 | 160 | 155 | 4.35 | Photograph |
10 | BDRP | 9.2.12 | KA22B5715 | DBM | 157 | 160 | 161 | 4.37 | Photograph |
So, the complete details of various ingredients temperatures, %age of bitumen at mixing stage etc. are known and controlled at plant site. Thus, this part makes complete check on the proportion of various ingredients, temperature etc. in the mixed material.
As soon as the tipper is filled with the mixed bituminous material, it is brought to the weighing machine to carry out the weight. A camera & GPS instrument installed at the automatic weighting machine site gives the photograph and location of vehicle. The
IJSER © 2013 http://www.ijser.org
International Journal of Scientific & Engineering Research, Volume 4, Issue 4, April-2013 1325
ISSN 2229-5518
live data so taken is placed on web site in live time. The data of ten tippers has been shown in Table No.3 which has been further presented in Graph No.2.
Tanker No. | Project ID | Date | Regd. No. of tipper | Type of material | Empty weight of tipper (T) | Weight of loaded tipper (T) | Weight of mixed material (T) | Photograph |
1 | BDRP | 9.2.12 | KA22 B5715 | DBM | 10570 | 40770 | 30200 | Photograph |
2 | BDRP | 9.2.12 | TN30 K6635 | DBM | 12410 | 40490 | 28080 | Photograph |
3 | BDRP | 9.2.12 | TN30 L883 | DBM | 10440 | 38770 | 28330 | Photograph |
4 | BDRP | 9.2.12 | TN30 L911 | DBM | 10500 | 38760 | 28260 | Photograph |
5 | BDRP | 9.2.12 | TN30 L913 | DBM | 10420 | 38390 | 27970 | Photograph |
6 | BDRP | 9.2.12 | KA22 B5715 | DBM | 10580 | 40690 | 30110 | Photograph |
7 | BDRP | 9.2.12 | TN30 K6635 | DBM | 12410 | 40510 | 28100 | Photograph |
8 | BDRP | 9.2.12 | TN30 L883 | DBM | 10470 | 41570 | 31100 | Photograph |
9 | BDRP | 9.2.12 | TN30 L911 | DBM | 10560 | 40250 | 29690 | Photograph |
10 | BDRP | 9.2.12 | KA22 B5715 | DBM | 10580 | 40780 | 30200 | Photograph |
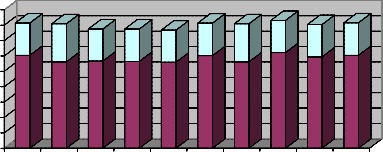

Empty weight of tipper
Weight
Weight v/s Tipper No.
Thus, with the e-control on weighing machine site, the material to be transferred from plant site to work site is fully controlled and we are well aware that how much material has been sent to work site.
The VTS installed in all vehicles is also synchronized with the system of e-quality control to check the route of the vehicle at all the times. It eliminates the intention of the contractual agency which simultaneously starts work on different roads of different departments such as PWD, Marketing Board, and Municipality etc. and tries to count the same tippers on both the sites. The route map and location as shown on web site at 1:10 pm on 16.05.2012 for four no. vehicles is shown in Photograph-1.
IJSER © 2013 http://www.ijser.org
International Journal of Scientific & Engineering Research, Volume 4, Issue 4, April-2013 1326
ISSN 2229-5518
Photograph-1
Thus, with e-control, the location of every vehicle is known at all the times and its route map can be checked. The vehicles can be fully managed and controlled by sitting in the office. In addition to this, it gives substantive savings in the consumption of fuel. [8]
On the start of the work with a particular tipper, its photograph during unloading in the hopper of paver is taken and the location (RD) is also noted. The same exercise is repeated at the end point where material of this particular tipper finishes. The live data along with photographs indicating the project ID is placed on website. The date of 10 such tippers is shown in Table No.4.
Tanker No. | Project ID | Date | Regd. No. of Tipper | Weight of mixed material (T) | Temp. of Material | RD of start reach | RD of End reach | Photographs |
1 | BDRP | 9.2.12 | KA22B5715 | 30200 | 144.0 | 490.820 | 490.860 | Photograph |
2 | BDRP | 9.2.12 | TN30K6635 | 28080 | 147.0 | 490.860 | 490.897 | Photograph |
3 | BDRP | 9.2.12 | TN30L883 | 28330 | 144.0 | 490.897 | 490.932 | Photograph |
4 | BDRP | 9.2.12 | TN30L911 | 28260 | 146.0 | 490.932 | 490.967 | Photograph |
5 | BDRP | 9.2.12 | TN30L913 | 27970 | 147.5 | 490.967 | 491.005 | Photograph |
6 | BDRP | 9.2.12 | KA22B5715 | 30110 | 149.5 | 491.005 | 491.043 | Photograph |
7 | BDRP | 9.2.12 | TN30K6635 | 28100 | 147.0 | 491.043 | 491.083 | Photo-graph |
8 | BDRP | 9.2.12 | TN30L883 | 31100 | 146.5 | 491.083 | 491.119 | Photo-graph |
9 | BDRP | 9.2.12 | TN30 L911 | 29690 | 142.0 | 491.119 | 491.157 | Photo-graph |
10 | BDRP | 9.2.12 | KA22B5715 | 30200 | 142.0 | 491.157 | 491.193 | Photo-graph |
Total | 261840 |
The thickness of DBM as per material used (Table No.4) = 261.840/ (2.5x337x3.625)
IJSER © 2013 http://www.ijser.org
International Journal of Scientific & Engineering Research, Volume 4, Issue 4, April-2013 1327
ISSN 2229-5518
= 0.0857m or 85.7mm
Theoretical thickness = 85mm
Variation = (+) 0.82%
This data is also compared with the data placed at website from the weighing machine site as shown in Table No.3 to know the material sent to work site. It shows that full material has reached at work site. All these details are attached with the bill of the agency. So, the e-control at work site ensures that the desired material has reached at work site and consumed as per requirements/standards. The system also keeps the RD wise record of material used from a particular tipper.
One lap-top (loaded with software designed for the purpose) enabled with camera and GPS instrument is given to every Engineer conducting the test. During the test, the live data is placed on the web site along with location and photograph of the person conducting the test. Five no. of such tests conducted are shown in Table No.5. The further detail of one test as placed on website is shown in Table No.6 :
Sample_ Location | Source_Material | Test_Dt | Type_ Material | Sample_ Dt | Remark | GSB_Id | |
Select | 443+600 LHS | Naglavi Quarry | 10/8/2011 12:00:00AM | GSB | 3/2/2011 12:00:00AM | Pass | 9 |
Select | 443+400 LHS | Naglavi Quarry | 10/8/2011 12:00:00AM | GSB | 3/2/2011 12:00:00AM | Pass | 10 |
Select | 443+000 LHS | Naglavi Quarry | 10/8/2011 12:00:00AM | GSB | 3/2/2011 12:00:00AM | Pass | 11 |
Select | 444+250 LHS | Naglavi Quarry | 10/8/2011 12:00:00AM | GSB | 4/11/2011 12:00:00AM | Pass | 12 |
Select | 444+130 LHS | Naglavi Quarry | 10/8/2011 12:00:00AM | GSB | 4/11/2011 12:00:00AM | Pass | 13 |
The details of one test as loaded on website are shown in Table No.6.
Ashoka Belgaum Dharwad Tollway Pvt. Ltd.
. ---- Gradation ---- .
Project | Six Laining of Belgaum – Dharwad Section of NH-4 from Km. 433.000 to 515.000 (Length 79.36 Km) in the State of Karnataka-NHDP Phase V |
Client | National Highway Authority of India (NHAI) |
Independent Engineer | Grontmij/Carl Bro in Jv with Unihorn India Pvt.Ltd. |
Concessionaire | Ashoka Belgaum Dharwad Tollway Pvt. Ltd. |
Sample Location | 443+600 LHS | Date of Sampling | 3/2/2011 |
Source of Material | Naglavi Quarry | Sample By | Mr vinay Gargatte |
Type of Material | GSB | Date of Testing | 10/8/2011 |
IJSER © 2013 http://www.ijser.org
International Journal of Scientific & Engineering Research, Volume 4, Issue 4, April-2013 1328
ISSN 2229-5518
IS Sieve Size mm/mic | Wt. Retained gms | Cu.Wt. Retained gms | Cum. Wt. Retained % | Total Passing % |
75 | 0 | 0 | 0 | 100 |
26.5 | 8988 | 8988 | 33.22 | 66.78 |
4.75 | 11830 | 20818 | 76.94 | 23.06 |
0.075 | 5323 | 26141 | 96.62 | 3.38 |
Pan | 0 | 26141 | 96.62 | 3.38 |
Remark | Pass | Photograph |
Test Conduct By | Mr.Ramyash | Photograph |
In Presence Of | Mr.Vinay Gargatte | Photograph |
Thus, e-control on testing eliminates the intention of making bogus entries of testing and gives the assurance that the tests are actually performed at site as the engineer shall have to go to site and conduct the test as his photograph with camera and location with GPS are placed on website in live time.
The result of this study shows that this model is successful in controlling the quality and quantity in flexible pavements. The e- control system on receipt of bitumen makes a complete check on the record of bitumen received at site. The e-control of mixed bituminous material checks the proportion of all the ingredients during mixing. The in-built control in this sophisticated plant not only controls proportions of various ingredients but also keeps a complete record of batch by batch output. Any time computer print can be obtained to check the proportions of various ingredients. Moreover, placing the data on web site in live time also captures the quantities of material so as to have a full control on the quantities used. Thus the quality and quantity of mixed material is well controlled at plant site. The e-control on weighting machine site controls the actual weigh of mixed material sent to site for laying. The e-control on vehicles checks the entire route of movement of vehicles and ensures that each tipper has reached to the work site. In addition to this it gives substantive savings in the fuel consumption. The system also helps in locating a vehicle special when it is in a traffic jam or out of order. In case of traffic jam, the route of subsequent vehicles is also changed. The e-control at work site gives the actual length where material has been consumed. It keeps complete batch by batch record (Reduced Distance wise) of the material used from a particular tipper. In this case the thickness of DBM is coming
85.7mm against the theoretical thickness of 85mm which is just in a variation of (+) 0.82% which is almost negligible. So, the
system makes a further check on quality and quantity of materials used at site. The e-control on testing makes a complete check
on bogus entries of tests as only live data is being placed on web site.
Thus, with the use of this model, all the activities of construction of flexible pavements such as the receipt of bitumen, mixing of material at plant site and its movement through vehicles, laying at site and conducting tests are electronically controlled. So, this system is quite useful in getting 100% material as per specifications at site and is giving a confidence for quality & quantity of work.
Achieving Quality in flexible pavements through e-control is an effective method for assuring quality and quantity of work. This system ensures that even after the mixing of the official field staff with the contractual agency, there can be no pilferage of material. Batch mix type fully automated computer controlled Hot Mix Plants with electronic sensor control the quality and uniformity of the finished product. The other equipments as used with electronic sensors also control the quality automatically. The model for e-quality control system adopted at various stages of construction ensures the quality and quantity of the materials used. It can also be used to check the pilferage of the material. But it is not advisable to depend only on the fully auto controlled system. Thus periodic sample testings are also necessary.
IJSER © 2013 http://www.ijser.org
International Journal of Scientific & Engineering Research, Volume 4, Issue 4, April-2013 1329
ISSN 2229-5518
[1] AK Mukherjee, NK Goswami & MH Patel; September, 2001, “Need for change in acceptance criteria for quality control of works”; Paper No.477, Indian Roads Congress, Volume 62-2.
[2] Bant Singh, Dr. Srijit Biswas and Dr. Parveen Aggarwal; 2012, “Modeling of Economical & Efficient Use of Vehicles through e-Control for Construction of a Highway”; International Journal of Engineering Research and Technology; ISSN 0974-3154 Volume 5, Number 3 (2002).
[3] Bant Singh, Dr. Srijit Biswas and Dr. Parveen Aggarwal; 2012, “Use of updated machinery for Monitoring of Quality & Quantity of a Pavement – A case study on e-quality control”; International Journal of Industrial Engineering and Technology; ISSN 0974-3146 Volume 4, Number 3 (2012)
[4] George Jergeas & John Van der Put; July/August 2001, “Benefits of constructability on construction projects”; Journal of
Construction Engineering and Management.
[5] IRC:SP:57-2000; Guidelines for Quality Systems for Road Construction.
[6] Ministry of Road Transport & Highways (Fourth Revision) – 2001; Specifications for Roads & Bridge Works.
[7] Prof. Prithvi Singh Kandhal; April-June, 2006, “Quality Control requirements for using Crumb Rubber Modified
Bitumen (CRMB) in Bituminous Mixtures”; Paper No.522, Indian Roads Congress, Volume 67-1.
[8] S. Satya Kumar, R Sridhar, K.Sudhakar Reddy & Dr. Sunil Bose; January-March 2008, “Analytical Investigation on the
Influence of Loading and Temperature on Top-Down Cracking in Bituminous Layers”; Paper No.540, Indian Roads
Congress, Volume 69-1.
[9] VK Sinha, HN Singh & Saurav Shekhar; “Rutting in flexible pavements – a case study”; Paper No.535, Journal of Indian
Roads Congress.
IJSER © 2013 http://www.ijser.org