degradation in an industrial activated sludge system by applying mass conservation principle to predict substrate and
(5)
biomass behavior, applying biodegradation kinetics to the
system, obtaining industrial plant data, using fourth-order
International Journal of Scientific & Engineering Research, Volume 5, Issue 7, July-2014 667
ISSN 2229-5518
Modeling and Simulation of an Activated Sludge
System for Industrial Wastewater Treatment
Dagde Keneth Kekpugile and Nmegbu, Chukwuma Godwin Jacob
Abstract— Industrial wastewater generated during refining operations needs to be before being discharged so as to avoid environmental pollution and its detrimental effects. This work develops a model for an activated sludge bioreactor, which describes the dynamic behaviour of Biological Oxygen Demand (BOD) utilization and biomass growth. The activated sludge system was modeled from mass conservation principle, incorporating biodegradation kinetics. The model was solved numerically by employing the fourth order Runge-Kutta algorithm and simulated using Visual Basic 6.0 compiler. The model prediction of BOD degradation (30.67mg/l) as compared to plant data (30.0mg/l) showed a deviation of 2.23%. Functional parameters such as retention time; recycle ratio; and yield coefficient were simulated to study its variation on the system. These results, which are in concurrence with the plant design parameters implies that wastewater treatment plants could be described using system of CSTR configuration.
Index Terms— C
—————————— ——————————
FFICIENT and effective wastewater treatment techniques have assumed enormous attention over the last century. Continued population growth and industrialization have resulted in the degradation of various ecosystems on which human life relies on. In the case of ocean and river quality, such pollution is primarily caused by the discharge of inadequately treated industrial and municipal wastewater. On initial discharge, these wastewaters can contain high levels of inorganic pollutants which can be easily biodegradable, but whose impact load on the ecosystems, either in Total Suspended Solids (TSS), Biochemical Oxygen Demand (BOD), or Chemical Oxygen Demand (COD), may be in the tens of thousands mg/L (Ng, 2006). Wastewaters are used liquid of different density and composition that flow out of factories and industries, homes or establishment, which may be harmful. Wastewaters are usually classified as industrial wastewater or municipal wastewater. The characteristics of industrial waste vary greatly from industry to industry. For instance the food industrial waste is very much different from
the waste from iron and steel industry.
Generally, there are four basic steps in the treatment of both
domestic and industrial wastewater. These include: (a) Pre-
treatment (b) Primary treatment (c) Secondary treatment and
(d) Advanced treatment.
Pre-treatment step can either be physical or chemical or a
combination of both. This refers to processes that prepare
wastewater to a condition that it can be further treated in
conventional secondary treatment biological process. It
involves use of screens, grits channels, floatation (gravity,
vacuum, electro, dissolved air or air flotation), and
equalization technique. Primary treatment is often called
clarification, sedimentation or settling. It involves mainly
physical operations. It is the unit process where the
wastewater is allowed to settle for a period in a settling tank,
thus producing a somewhat clarified liquid effluent in one stream, and liquid-solid sludge (called primary sludge) in a second stream. The secondary treatment step is mainly biological. Secondary treatment is a process that is capable of
biodegrading the organic matter into non-polluting end products such as water, carbon dioxide CO2 and biomass (sludge) Secondary treatment systems are broadly categorized as: Suspended growth systems example of which is the activated sludge system and Attached growth systems or fixed film reactors examples of which include; trickling or percolating filters, bio towers, and Rotating Biological Contactors (RBC).
With appropriate analysis and environmental control, almost all wastewaters containing biodegradable constituents with a BOD/COD ratio of 0.5 or greater can be treated easily by biological means [1]. In comparison to other methods of wastewater treatment, it also has the advantages of lower treatment costs with no secondary pollution [2]. Both aerobic and anaerobic processes can be used. Aerobic biological processes are commonly used in the treatment of organic wastewaters for achieving high degree of treatment efficiency, while in anaerobic treatment, considerable progress has been achieved in anaerobic biotechnology for waste treatment based on the concept of resource recovery and utilization while still achieving the objective of pollution control [3]
In general, aerobic systems are suitable for the treatment of low strength wastewaters (biodegradable COD concentrations less than 1000 mg/L) while anaerobic systems are suitable for the treatment of high strength wastewaters (biodegradable COD concentrations over 4000 mg/L) [4].
Industrial wastewater if discharged into the environment without proper treatment has detrimental effects on the environment. It results in water pollution; thus affecting living organisms both plants and animals alike. It becomes justifiable that adequate techniques should be designed for efficient and effective wastewater treatment to curb these detrimental effects. Simulation modeling is an effective tool in the design of such processes. It provides the needed environment to study the different parameters of the system before design and fabrication, thus all the mistakes are made on a pilot scale rather than on an industrial scale.
The aim of this research is to develop adequate mathematical models to predict Biological Oxygen Demand (BOD)
IJSER © 2014 http://www.ijser.org
International Journal of Scientific & Engineering Research, Volume 5, Issue 7, July-2014 668
ISSN 2229-5518
![]()
degradation in an industrial activated sludge system by applying mass conservation principle to predict substrate and
(5)
biomass behavior, applying biodegradation kinetics to the
system, obtaining industrial plant data, using fourth-order
Substituting (2) – (5) into equation (1) yields
Runge-Kutta algorithm to solve the model equations with the aid of a Visual Basic 6.0 compiler program, validating the![]()
V dX
dt
= XQ − (QR X R
+ QW X R
+ Qe X e
) + RX V
result and simulating functional parameters.
Expanding and collecting like terms yields
![]()
V dX
dt
= XQ − QR X R
− (QW X R
+ Qe X e
) + RX V
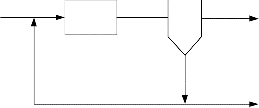
The continuity equation for the mass balance of the bio reactor![]()
V dX
![]()
= XQ 1 − QR X R − (Q X
+ Qe X e
) + RX V
(6)
has depicted in figure 1, where used to develop the dt
QX
mathematical model to monitor the biomass and substrate
Substituting the value of the kinetic RX
in (10) into (6) yields
concentration in the activation sludge bio reactor.
![]()
![]()
V dX = XQ 1 − QR X R − (Q X
+ Q X
) + µ
![]()
S − ϖ XV
Activation Tank
dt
QX
W R e e
m K + S
Q0 S0 X0
X S V
X Se
Qe Xe Se
Dividing through by VX yields
(QO+QR)
V dX
XQ
= 1 −
Q X
−
(QW
X R +
Qe X e
) + µ
S −ϖ XV![]()
VX dt
QR
![]()
VX
![]()
QX VX
![]()
m K + S![]()
![]()
VX
XR 1 dX Q
QR X R
(QW X R + Qe X e ) S
Recycle Line
QW XR Se
X dt
![]()
![]()
= 1 −
V
![]()
![]()
−
QX VX
![]()
+ µ m
K
−ϖ
+ S
Waste Sludge
Fig 1: Hypothetical representation of an activated sludge![]()
1 dX
![]()
= 1 (1 − R)
![]()
− 1 + µ
![]()
S − ϖ
(7)
(8)
reactor.
X dt τ
θ K + S
Assumptions made during model development include:
Multiplying (8) through by X yields
1. Readily biodegradable substrate, which serves as source of carbon and energy, are present and accessible to the heterotrophic bacteria.![]()
dX =
dt
![]()
X (1
τ
![]()
− R) − X
θ
+ µ
S
![]()
K + S
− ϖ
(9)
2. The major reactions are oxidation of the carbonaceous![]()
where,τ = V Q
is the period of aeration or hydraulic
substrates by endogenous decay of the heterotrophics.
3. Sufficient aeration is maintained in the bioreactor,
retention time,
θ = VX
![]()
(QW X R
+ Qe X e )
mean residence
that is oxygen is sufficiently present, so as to achieve
time or solid retention time of microorganisms in the reactor,
good mixing of the liquid phase.
4. The limiting substrates are consumed by all of the![]()
R = QR X R
QX is the reflux ratio.
different heterotrophic bacteria.
5. The feed stream is sterile; the biomass is acclimated
and introduced at exponential growth phase.
6. The clarifier is ideal: with assumed constant volume.
No reaction at the clarifier.
For mixed microbial consortia, as in activated sludge, the net growth rate accounting for both microbial explosion and endogenous death is expressed as
7. There is no longitudinal mixing, only well-mixed contents perpendicular to flow.
8. All particles reside for the same amount of time in the
R X = (µ − ϖ ) X
(10)
bioreactor.
Where µ = Specific microbial growth rate (h-1), ϖ = Microbial
decay rate (h-1).
The specific growth rate for substrates presented by [5], [6] is
Rate of accumulation of
= V dX
expressed as![]()
microorganism within the system dt
𝜇 = 𝜇𝑚
(11)
Rate of flow of microorganism
(2)![]()
𝐾𝑠+𝑆
Where S = Substrate concentration (mg/l), µm = Maximum
int o the system boundary
= XQ
(3)
specific growth rate (h-1), KS = Half saturation constant (mg/l). Substituting (11) into (10) gives:
Rate of flow of microorganism
𝑅𝑋 = (𝜇 − 𝜔�⃑)𝑋 (12)
out of the system boundary
= X R QR + QW X R + Qe X e
(4)
IJSER © 2014 http://www.ijser.org
International Journal of Scientific & Engineering Research, Volume 5, Issue 7, July-2014 669
ISSN 2229-5518
given in Table 1. The operating parameters are given in Table
Rate of
Rate of flow
Rate of flow
Net depletion of
(13)
2.The kinetics parameters as shown in Table were obtained
accumulation
= of Substrate
− of Substrate
+ substrate within
of Substrate
int o the system
out of the
the system
from literatures. These values were used for this study
within the system
boundary
system boundary
boundary
because the experimental conditions for which the kinetics
Rate of accumulation of
= V dS
was obtained are in agreement with operating conditions of
substrate
![]()
within the system dt
(14)
the wastewater treatment plant studied in this work.
For simplification, a constant maximum specific growth rate
that does not change when the identity of limiting resource
Rate of flow of substrate
changes is assumed for this work, though previous study
int o the system boundary = QS 0
Rate of flow of substrate
(15)
showed that the physiological state of an organism changes as
the identity of limiting resource changes (µmax , Y and KS
change when the identity of limiting resource changes [7]. This
out of the system boundary = Qe S e + Qw S e
assumption was based on previous work describing microbial
Net growth of substrate
= RS V
(16)
(17)
growth on essential substrates using Liebig’s law if minimum and assuming a constant maximum specific growth rate [8], [9].
within the system boundary
Substituting (14) – (17) into (13) yields
TABLE 1
BIOMASS AND SUBSTRATE CONCENTRATION FROM![]()
V dSn
= QS
− (Q S
+ Q S ) + R V
(18)
THE BIOLOGICAL TREATMENT UNIT
dt 0
e e W e S
The substrate utilization rate, RS
µX
is expressed as![]()
(19)![]()
RS = Y
Biomass (MLVSS )
Assuming that the substrate in the waste stream is negligible and that the inflow flow rate is the same as the exit flow rate, and substituting the value of RS in (19) into (18) yields Substituting (11) into (19) yields:
µ m X
* MLVSS – Mixed Liquor Volatile Suspended Solids (mg/l) TABLE 2
PROCESS PARAMETERS FROM THE BIOLOGICAL![]()
RS =
![]()
Y S
+ S
(20)
TREATMENT UNIT![]()
V dS
= Q(S
− S ) + µm X S V
(21)
![]()
0 e
dt Y
K S + S
Dividing through (21) by V yields
![]()
dS =
![]()
(S0 − Se ) +
![]()
![]()
µm X
(22)
dt V
Y K S
+ S
TABLE 3![]()
dS =
![]()
(S0 − Se ) +
![]()
![]()
µm X
(23)
KINETIC PARAMETERS [10]; [5], [11].
dt τ
Y K S + S
where, τ = V
in the reactor.![]()
Q is the hydraulic retention time of substrates
(9) and (23) are the model equations predicting the growth of microorganism and the depletion of substrate in the activated sludge reactor.
The biomass and substrate concentrations obtained from an Industrial Activated Sludge Process of the wastewater treatment unit at Eleme Petrochemicals Company, Nigeria are
IJSER © 2014 http://www.ijser.org
International Journal of Scientific & Engineering Research, Volume 5, Issue 7, July-2014 670
ISSN 2229-5518
![]()
ϖ
250mg/l, while the concentration of biomass introduced is
2400mg/l.
The initial and boundary conditions of (15) and (23) may then be defined as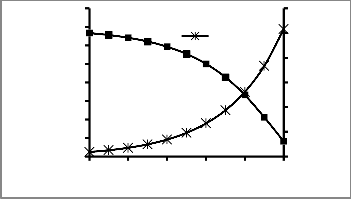
80000
70000
60000
50000
40000
30000
20000
10000
0
Biomass…
300
250
200
150
100
50
0
At t = 0; X (0) = 2400mg / l , S (0) = 250mg / l
(24)
0 0.2 0.4 0.6 0.8 1
At t = t , X
= X (t ), S = S (t )
(25)
Fig 2: Profile of Biomass and BOD Concentration at each
(15) and (23) were solved simultaneously using the above
initial and boundary conditions, and the parameters in Tables
1, 2, and using fourth order Runge-Kutta algorithm implemented in a Visual Basic 6.0 program Compiler.
Table 4 shows the comparison between plant data and prediction of the model. (9) and (23), indicating that the predicted data agree reasonably well with the plant data. The results obtained were validated by comparing it with industrial plant data from a functional industrial wastewater treatment plant with a deviation of 2.23%, suggesting that the model can be used to study and optimize the behavior of an industrial wastewater bioreactor.
. TABLE 4
COMPARISON BETWEEN MODEL PREDICTION AND
PLANT DATA
Bioreactor Stage
To study the behavior of the system under different loading and operating conditions, a simulation study or sensitivity analysis was conducted on important parameters of the system. The parameters investigated in this study includes; retention time, recycle ratio, yield coefficient, and the reaction constant.
Retention time is an important design parameter for activated sludge systems. It is very essential for maximum biomass growth and substrate biodegradation. If the retention time is low, biomass growth is limited, thus there will not be enough microorganisms in the system. This will have an adverse effect on substrate biodegradation.
Parameter | Model Prediction | Plant Data | % Deviation |
Exit BOD Concentration (Mg/l) | 30.67 | 30.00 | 2.23 |
In industrial activated sludge systems, biodegradation occurs when the wastewater containing the substrate to be removed is brought into contact with flocculated microorganisms in the oxidation dish. The microorganisms feed on the substrate, thus reducing its concentration in the wastewater. From Figure 2, it could be seen that the BOD concentration reduces from an initial concentration of 250 Mg/l to 30.67 Mg/l. At this concentration; the wastewater can be discharged into the environment. Significant of note is the correlation between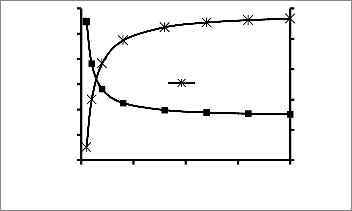
68800
68700
68600
68500
68400
68300
68200
Bio…
0 5 10 15 20
100
80
60
40
20
0
biomass concentration and BOD concentration within the reactor; the higher the biomass concentration, the lower the BOD concentration.
Fig 3: Variation of Biomass and BOD Concentration with
Retention Time
Figure 3 shows the profile of the effect of the variation of
retention time on the biomass concentration and BOD
concentration. The graph follows the discussed trend. The
biomass concentration increases with increase in retention
time; suggesting that the longer retention time enables the microorganisms to grow within the system. The biomass concentration curve follows a typical microbial growth curve. Sharp growth is observed within the first eight (8) hours,
followed by a period of stationary growth. The substrate
(BOD) concentration curve follows a reverse pattern. The
IJSER © 2014 http://www.ijser.org
International Journal of Scientific & Engineering Research, Volume 5, Issue 7, July-2014 671
ISSN 2229-5518
concentration of the substrate reduces with increase in the
retention time. This implies that the longer the wastewater stays in the system, the higher the rate of degradation. Correlating both curves, it can be observed that the period of higher biodegradation (91.36 Mg/l to 33.03 Mg/l) corresponds to the growth period of the microorganisms. At the stationary growth period, the rate of biodegradation is reduced to a nearly constant value.
To increase the substrate utilization rate without increasing the specific substrate utilization rate, the acclimatized biomass
75000
74000
73000
72000
71000
70000
69000
68000
67000
Bioma…
0 0.5 1
120
100
80
60
40
20
0
-20
is recycled to the reactor. This stabilizes the system and ensures that the microorganism is not overly depleted. All things being equal, increase in recycle ratio will lead to increase in the biomass concentration and a decrease in the concentration of the substrate. This is because the large microorganisms returned to the system leads to increase in the concentration of the biomass, these increases the biodegradation rate, thus leading to reduction in the concentration of the substrate.
Figure 4 shows the effect of the variation of the recycle ratio on the concentration of the biomass and the substrate (BOD). As expected, the biomass concentration increases with increase in the recycle ratio, also substrate (BOD) concentration reduces with increase in the recycle ration. Thus, for maximum biodegradation, the system should be operated at 100% recycle ratio.
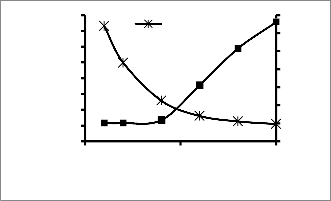
Fig 5: Variation of Biomass and BOD Concentration with
Yield Coefficient
Figure 5 show the effect of the variation of yield coefficient on the concentration of biomass and the substrate. The graph follows the desired trend. The biomass concentration increases with increase in the yield coefficient. Also, the biomass curve follows a typical microbial growth curve with a lag phase between 0 to 0.4 yield coefficients; followed by a growth phase. The concentration of substrate (BOD) decreases with increase in the yield coefficient as more of the substrate is converted to biomass.
69000
68000
67000
66000
65000
64000
37
Biom…
35
33
31
29
27
25
0 0.2 0.4 0.6 0.8 1
The importance of energy to the development of the economy cannot be over emphasized. In addition to electricity generation, fossil fuels especially petroleum is used in powering industrial plants and automobiles. It is a well-known fact that industrial wastewater is generated during refining operation. Industrial wastewater if discharged into the environment without proper treatment impacts negatively on the environment. It results in water pollution; thus affecting living organisms and the ecosystem. In order to maximize profit, wastewaters
Fig 4: Variation of Biomass and BOD Concentration with Recycle
Ratio
During biodegradation all the substrate are not converted
to biomass. Some of the substrates are used for cell
maintenance. The cell yield or yield coefficient is used to
describe the fraction of the substrate converted to biomass. It
is the ratio of the mass of new cells formed to the mass of substrate consumed. The yield coefficient is an important design parameter for activated sludge systems. It is used to size the sludge disposal facility. An increase in the yield coefficient implies that more of the substrate is converted to biomass. Thus increase in yield coefficient results in increase in biomass concentration and a reduction in the concentration of the substrate.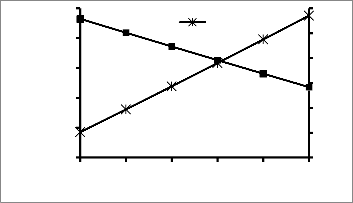
have to be efficiently treated at the best cost possible.
Suspended growth systems which are aerobic processes that achieve a high microorganism concentration through the recycle of biological solids, is a time tested and proven method of treating industrial wastewater. The bacterial organisms convert biodegradable organic wastewaters and certain inorganic fractions into new biomass and other non-polluting end product. In comparison to other methods of wastewater treatment, it has the advantages of lower treatment costs with no secondary pollution. Also, aerobic biological processes are commonly used in the treatment of organic wastewaters for achieving high degree of treatment efficiency.
As with other engineering processes, it is proper to
make all the mistakes on a pilot scale than to make them on an industrial scale. To ensure this, modeling
IJSER © 2014 http://www.ijser.org
International Journal of Scientific & Engineering Research, Volume 5, Issue 7, July-2014 672
ISSN 2229-5518
and simulation plays an important role. It provides the environment needed to study the different parameters of the system before design and fabrication.
In recognition of the above fact, this work presents an activated sludge model for the treatment of Biological Oxygen demand (BOD) in industrial water. The case study was drawn from a functional petrochemical company in the Niger Delta region of Nigeria. The model result gives an effluent BOD concentration of
30.67 mg/l, which compares favourably with the
plant data of 30.00mg/l with 2.23% deviation.
Functional parameters such as retention time; recycle ratio; and yield coefficient were simulated to study their effect on the reactor.
The authors wish to thank Pepple Daniel, ohazuruike Lotanna for making this research a success
[1] Metcalf and Eddy, (2003) Wastewater Engineering Treatment and Reuse, 4th ed., McGraw Hill.
[2] D.T. Sponza, A. Uluköy. (2005) Treatment of 2,4-dichlorophenol (DCP) in a sequential anaerobic (upflow anaerobic sludge blanket) aerobic (completely stirred tank) reactor system, Process Biochemistry, 40: 3419–3428.
[3] L. Seghezzo,. G. Zeeman, J.B. Van Lier, H.V.M Hamelers, G. Lettinga. (1998) A review: The anaerobic treatment of sewage in UASB and EGSB reactors, Bioresource Technology, 65: 175–190.
[4] F.Y Cakir, and M.K. Stenstrom, (2005) Greenhouse gas production: a comparison between aerobic and anaerobic wastewater treatment technology, Water Research, 39: 4197–4203.
[5] C.P.L. Grady Jnr. (1998) “Factors influencing biodegradation of Synthetic Organic Chemicals in natural and engineered aquatic environments”, Pure and Applied. Chemistry, 70: 1363-1373.
[6] P.N. Polymenakou, E.G. Stephanou, (2005). E_ect of temperature and additional carbon sources on phenol degradation by a indigenous soil Pseudomonas[J]. Biodegradation, 16: 403–413.
[7] L. Dijkhuizen, R. H. Boer, W. Harder. (1982): Arch. Mocrobilogy. Lett. 12:19-
25.
[8] B.C Baltzis, A.G. Fredrickson. (1999). Limitation of growth rate by two complementary nutria,nts: some elementary but neglected considerations.
[9] J. Huisman and F. Weissing. (1999) “Biodiversity of Plankton by Species oscillations and Chaos”, Nature, 402: 407-410.
[10] M. Schroder, C. Muller, C. Posten, W.D. Deckwer, and V. Hecht. (1997) “Inhibition Kinetics of Phenol Degradation from Unstable-state Data”, Bioengineering.Science. 54: 567-576.
[11] C.T. Goudar, S.H. Ganji, B.G. Pujar, K.A. Strevett. (2000) “Substrate inhibition
Kinetic of phenol biodegradation”, Water. Environmental. Resourses., 50-55.
[12] O.N. Agdag, D.T. Sponza, (2005) Anaerobic/aerobic treatment of municipal landfill leachate in sequential two-stage up-flow anaerobic sludge blanket reactor (UASB)/completely stirred tank reactor (CSTR) systems, Process Biochemistry, 40: 895–902.
[13] Y.T Ahn, S.T. Kang, S.R. Chae, C.Y. Lee, B.U. Bae, H.S Shin. (2007) Simultaneous high-strength organic and nitrogen removal with combined
anaerobic upflow bed filter and aerobic membrane bioreactor, Desalination, 22:
202 114–121.
[14] B.C. Baltzis, A.G. Fredrickson, (1988) “Limitation of growth rate by two complementary nutrients: Some elementary but neglected considerations”. Biotechnol Bioeng,. 31: 75-86.
[15] Y. Bando, T. Kato, K. Yasuda, Y. Sakurai, M. Nakamura (1999) Wastewater treatment by anaerobic–aerobic activated sludge method in bubble column with draft tube, Journal of Chemical Engineering of Japan, 32: 770–775.
[16] J. Beunink, H.J. Rehm (1990) Coupled reductive and oxidative-degradation
of 4- chloro-2-nitrophenol by a co-immobilized mixed culture system,
Applied Microbiology and Biotechnology, 34: 108–115.
[17] F.Y. Cakir, F.Y and M.K. Stenstrom(2005) Greenhouse gas production: a comparison between aerobic and anaerobic wastewater treatment technology, Water Research, 39: 4197–4203.
[18] Y.J Chan, M.F. Chong, C.L. Law, D.G. Hassell (2009) A review of anaerobic- aerobic treatment of industrial and municipal wastewater. Chemical Engineering Journal, 155: 1-18.
[19] R. Del Pozo, V. Diez, (2005) Integrated anaerobic–aerobic fixed-film reactor for
slaugh- terhouse wastewater treatment, Water Research 39: 1114–1122.
[20] F. Fdez-Polanco, F.J. Real, P.A Garcia, (1994) Behavior of an anaerobic/aerobic pilot-scale fluidized-bed for the simultaneous removal of carbon and nitrogen, Water Science and Technology, 29: 339–346
[21] H. Gardin, J.M. Lebeault, A. Pauss, A. (2001) Degradation of 2,4,6- trichlorophenol (2,4,6- TCP) by co-immobilization of anaerobic and aerobic microbial communities in an upflow reactor under air-limited conditions, Applied Microbiology and Biotechnology, 56: 524–530.
[22] J. Gerritse, F. Schut, J.C. Gottschal, (1990) Mixed chemostat cultures of obligately aerobic and fermentative or methanogenic bacteria grown under oxygen-limiting conditions, Microbiology Letters 66: 87–89.
[23] J.J Heijnen, A. Mulder, W. Enger, F. Hoeks, (1989) Review on the application of anaerobic fluidized bed reactors in waste-water treatment, The Chemical Engineering Journal, 41: 37–50.
[24] J.J. Heijnen, A. Mulder, R. Weltevrede, J. Hols, H. Vanleeuwen, (1991) Large-
scale anaerobic–aerobic treatment of complex industrial-waste water using
biofilm reactors, Water Science and Technology, 23: 1427–1436.
[25] I.K. Kapdan, R. Oztekin, (2006) The effect of hydraulic residence time and initial COD concentration on color and COD removal performance of the anaerobic–aerobic SBR system, Journal of Hazardous Materials, 136: 896–901.
[26] K.V. Lo ,P.H Liao, (1989) Anaerobic–aerobic biological treatment of a mixture of cheese whey and dairy manure, Biological Wastes, 28: 91–101.
[27] M. Lerner, N. Stahl, N Galil, (2007) Aerobic vs. Anaerobic–aerobic biotreatment: Paper mill wastewater, Environmental Engineering Science, 24:
277–285.
[28] L. G. Meng, Y. Bando, M. Nakamura, (2004) Dissolved oxygen distribution in a rectangular airlift bubble column for biological nitrogen removal, Journal of Chemical Engineering of Japan, 37: 1005–1011.
IJSER © 2014 http://www.ijser.org