1
International Journal of Scientific & Engineering Research, Volume 3, Issue 11, November-2012
ISSN 2229-5518
1 Research Scholar, Anna University, Chennai
2 PG Scholar, Department of EEE, SNS College of Technology, Coimbatore
3 Professor and Head, EIE, PSG College of technology, Coimbatore
Power Quality has been a research issue in the power engineering community since the past decade. With extensive use of power electronic devices and microprocessor-based systems requiring high quality of electric power, power quality has become a major concern. Poor electric quality can result in malfunctioning of these devices and may have expensive consequences. To improve the quality of electric power, sources of disturbances must be recognized and controlled [1,8]. Voltage sags and swells are mainly causing severe damage and down time in the power systems. Voltage Sag (dip) a decrease to between 0.1 and 0.9 pu in rms voltage or current at the power frequency for durations of 0.5 cycles to 1 minute and Swell is an increase to between 1.1 pu and
1.8 pu in rms voltage or current at the power frequency durations from 0.5 to 1 minute [1]. This sags and swells mainly due turn on/turn off operations of supply lines and flow of inrush currents during starting of different loads etc [2]. These turn on/turn off can happen either from supply or load side. Sometimes Lightning strikes and EMI can cause
momentary sags/swells acc.
A more recent time-frequency representation, the S- transform [1,3] has found application in a range of fields. It is similar to a continuous wavelet transform in having progressive resolution but unlike the wavelet transform the S- transform retains absolutely referenced phase information. The S-transform not only estimates the local power spectrum, but also the local phase spectrum. It is also applicable to the
general complex valued time series. It is apparent that a more efficient representation of the S-transform is needed, one that provides a framework on which reduced sampling can be laid. This paper, therefore, presents a new transform, known as Discrete Orthogonal S-Transform (DOST).
Numerous solutions have been identified and proposed to mitigate sags and swells wherein a dynamic voltage restorer is one which injects a voltage in series with the supply lines and when any sags and swells are detected. Experimental investigation of voltage sag mitigation by an advanced static VAR compensator has been well discussed in [5]. Mostly, the rms voltage measurement method is used to detect the sag and swell before any mitigation is employed. The man drawback of the RMS voltage measurement is that the RMS voltage would be measured through voltage sensors and fed to the ADC of the microcontroller or DSP to convert them into digital and use the data based on the old data which is system dependent. The disadvantages associated with the rms method are discussed in [4-5]. Also power quality Surveys shows that voltage sags are considered as the dominant factor affecting power quality [6]. Also in [7], authors have used rapid sag detection through the use of a nonlinear adaptive filter wherein authors claimed that the filter has an ability to track the amplitude of the sag in real time which would be highly useful for sag and swell mitigation. A novel sag detection method for the line-interactive dynamic voltage restorer (DVR) has been presented in [8]. Here is the paper which discusses two methods to make the voltage shape and then to detect the voltage sags and swells at different operating conditions.
The paper is organized as follows a description mathematical modeling of Fourier and ANFIS are presented. The Discrete Orthogonal S Transform is presented in section
III,. The simulation model, results, discussions and its performance evaluation of two methods are presented in Section IV. Conclusion is presented in the section V.
II. MODELING VIA FOURIER SERIES AND ANFIS
In this paper four different mathematical models developed for a voltage profile which can be used to detect the Voltage sags and swells.
The Fourier series is a sum of sine and cosine functions that is used to describe any periodic signal which can be represented in either the trigonometric form or the exponential form. Since the voltage signal is in the form of periodic
2
International Journal of Scientific & Engineering Research, Volume 3, Issue 11, November-2012
ISSN 2229-5518
nature, Here we used the trigonometric Fourier series form shown below
Layer 5: Layer 5 is a simple summation of the outputs of
layer 4. Overall output gives the rotor position ()
y a0
ai cos(nwx)
bi sin(nwx)
(1)
Wk f k
where
i 0
i 0
Ok5=
Wk
f k
k
W
(6)
a0 is a constant (intercept) term
w is the fundamental frequency of the signal
n is the number of terms (harmonics) in the series.
Real time acquired value in fig1 were used to model the Fourier series equation for the voltage and the same is presented as below
k
k
Start
Y es
Identif y the z ero cross ing point of the V oltage
Y es No
Is the V oltage magnitude is + V olts
y(x) 1.196E 007 (2.152E 006) cos(0.3142x) 236 sin(0.3142x)
The coefficients of the equation are as follows a0 = 1.196e-007 (-5.848e-006, 6.088e-006) a1 = -2.152e-006 (-1.743e-005, 1.312e-005) b1 = 236 (236, 236)
w = 0.3142 (0.3142, 0.3142).
(2)
Y es
Start the counter
Count=Count+1
Y es
Is count reached
Max V alue?
No
R eset t he c ount er
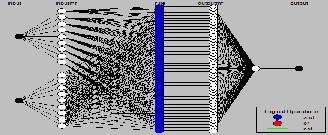
In this section the fuzzy inference system under consideration has two inputs, time(t) and voltage (v) and one- output predicted voltage (Vp). Each input has nine membership functions. Then the rule base contains eighty fuzzy if-then rules of Takagi and Sugeno‟s type. The corresponding ANFIS architecture is shown in Figure 1. The ANFIS network is formed with five layers. The explanation on each layer is given below.
Fig.1. Structure of ANFIS
Layer 1: In this layer, each input has 9 membership functions.
Layer 2: It implements the fuzzy AND operator
Implement the Function
V oltage
Y es
Calcuate the magnitude of the voltage f or sag/
Sw ell def initions
Sag/Sw ell Dis play
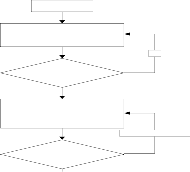
Fig.2. Flow chart for sag/swell detection
1. Start the algorithm for sag and swell
2. Identify the zero crossing point of the voltage
3. If the voltage magnitude is +ve, move to step number -4 else go to step 1
4. Start the counter count=count+1
5. If the counter reached max value, reset the counter and move to step 4 else go to step 6
6. Implement the any one of the below functions
7. Calculate the sag/swell as per table-1 and display the results
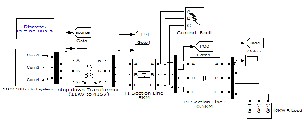
In this paper, The Voltage Sag and Swell Estimation for
Power System Applications system are made up of several
Wk = Ak (t ) X Bk (v)
where k=1, 2…9;
(3)
distinct subsystems and is illustrated in Fig. 3. The subsystem consists of an input supply measurement, Mathematical model
Layer 3: It acts to scale or normalize the firing strengths.
for Voltage predictor and voltage sag/swell detector block.
W k =
![]()
Wk
9
Wk
k 1
(4)
Figure 3 shows the block diagram of the Voltage Sag and
Swell Estimation for Power System Applications.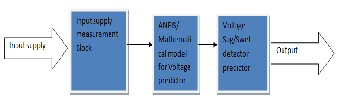
Layer 4: The output of the fourth layer comprises a linear combination of the inputs multiplied by the normalized firing strength. Output of this layer is given by
Ok4= W k fk= W k (mk t +nv+rk) (5)
where W k
is the output of layer 3 and the modifiable
Fig.3.Block diagram for Voltage Sag and Swell
variables mk, nk and rk are known as consequent parameters.
Estimation for Power System Applications system
3
International Journal of Scientific & Engineering Research, Volume 3, Issue 11, November-2012
ISSN 2229-5518
E. Input Supply measurement Block
The input supply measurement block plays an important role for voltage measurement and the same is shown in figure
4. This block consists of LV25 Voltage sensor and potential divider circuits to have unidirectional of control voltage 0-3 volts which correspond to -270 to +270 of peak to peak AC voltage form the input Bus.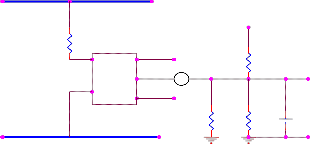
BUS VOLTAGE
+5
30k
+VCC
IV. DISCRETE ORTHOGONAL S TRANSFORM
There are several reasons to desire an orthogonal time- frequency version of the S-transform. An orthogonal transformation takes an N-point time series to an N-point time-frequency representation, thus achieving the maximum efficiency of representation. Also, each point of the result is linearly independent from any other point. Thus a Parseval theorem applies, stating that the norm of the time series equals the norm of the DOST. An orthogonal transform is referred to as an energy preserving transform.
The efficient representation of the S-transform can be
LV25
-VCC
500ohms
3.5K
1.5K
TO DSP
1 PFD
defined as the inner products between a time series h[kT ] and
the basis functions defined as a function of [kT ], with the parameters ν (a frequency variable indicative of the centre of a frequency band and analogous to the “voice” of the wavelet transform), β (indicating the width of the frequency band), and τ (a time variable indicating the time localization).
N 1
Fig.4.Input supply measurement circuit.
ShkT S T ,
![]()
hkT S , , kT
(10)
NT
k 0
It has been observed from the simulations that Fourier and ANFIS Models are performing better than other function. Therefore it has been decided to verify Fourier and ANFIS Models function through TMS320F2810 to verify the effectiveness of the Fourier and ANFIS Models and the same has been implemented. The entire Voltage predictor model to be implemented consists of system initialization, followed by a single interrupt loop (the ADC end of conversion interrupt), which implements the voltage predictor based on equation (1). GP Timer 2 is used to trigger the ADC at 25 MHz The function main performs CPU and peripheral initialization, and then enters an endless loop that waits for the ADC end of conversion interrupt. The controller itself is implemented in the ADC interrupt service routine in the file DefaultIsr.c. The clock frequency of the DSP is 150 MHz all timing calculations (e.g., sample rates) have been performed based on this clock speed. The ADC sampling rate and PWM switching frequency can be changed using the constant sample period and PWM period found in the file sag.h. The predicted voltage information from the Fourier and ANFIS Models are used separately to detect the sag and swell as per table-1. Actual voltage is fed to the ADC channel -1 in the sequential mode. The ADC channel used can be selected using the constant ADC channel in the file sagswell.
The input voltage value is from 0-3 volts, which corresponds -276 to +276 input bus voltage. This can be changed through ADCINA3. All of the variables pertaining to the voltage prediction are contained in the structure sagswell declared in the file GlobalVariableDefs.c. This structure is of type, voltage predictor is defined in the file sagswell.h. The voltage predictor is assigned to the sagswell structure in the function main. All of these values are alterable if desired. The file DefaultIsr.c contains program for whole Sagswell algorithm using Fourier series function.
The DOST presented in this work is designed to recognize pure sine wave(a) and two types of power quality disturbances including voltage sag(b) and voltage swell(c) based on the test system shown in Fig. 2.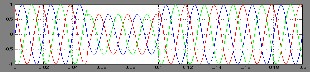
Fig. 5 Sag/swell generating test system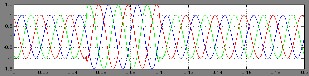
Fig.6. Voltage Sag
Fig.7. Voltage Swell
Fig. 8 DOST-Contour (3D) for voltage sag
International Journal of Scientific & Engineering Research, Volume 3, Issue 11, November-2012
ISSN 2229-5518
4
(c)
Fig. 9 DOST-Contour (3D) for voltage swell
Figure 9-18, show the 2-D, 3-D mesh plot for various signals. Sag and swell must be detected and classified properly to initiate corrective measures to ensure quality of power. S-Transform generates contours, which are suitable for classification by simple visual inspection unlike wavelet transforms (WT) that requires specific methods like Standard- Multi resolution analysis (MRA) for classification.
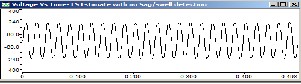
After integrating the voltage estimators into the Sag swell system individually, it is possible to verify the capability of the Sag and swell detection. Before presenting the capability of the Sag and swell detection, briefly the various steps that are involved in the Sag and swell detection algorithm. The data‟s that are used by the Fourier and ANFIS Models during training. After verification of the model via Fourier and ANFIS Models in the MATLAB/simulink environment, C program is written in TMS320F2812 CCS environment to implement both algorithms along with voltage prediction and sag and swell detection algorithms. Fig 10,11,12 (a,b,c,d,e) Shows the actual and estimated voltage for voltage using Fourier series and ANFIS with no sag/swell, 40% sag and
40% swell conditions. The experimental results prove that the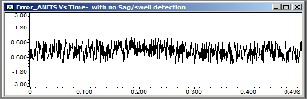
(d)
(e)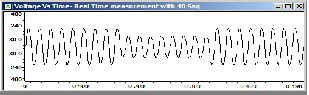
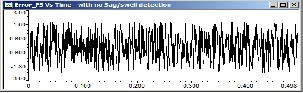
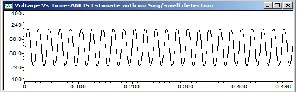
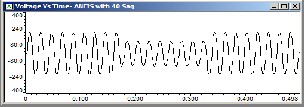
Fig.10. Experimental results via CCS environment with no Sag and swell (a). Actual voltage (b). Estimated voltage by Fourier series (c). Absolute error by Fourier series (d). Estimated voltage by ANFIS (e). Absolute error by ANFIS
(a)
absolute maximum error lies between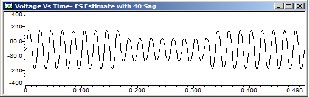
2.836 voltages in
Fourier Model and
0.769
voltage in ANFIS based
estimator. This results show that the voltage prediction and sag swell detection algorithm implemented by Fourier and ANFIS Models gives a good results at all operating conditions.
The models using Fourier series /ANFIS has been developed through MATLAB/Simulink modeling environment wherein date for modeling were acquired through Fluke 430.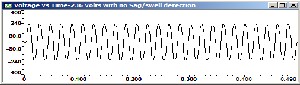
(a)
(b)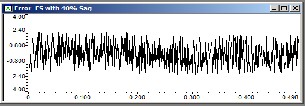
(b) (c) (d)
International Journal of Scientific & Engineering Research, Volume 3, Issue 11, November-2012
ISSN 2229-5518
5
(e)
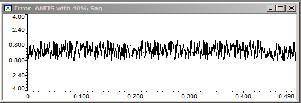
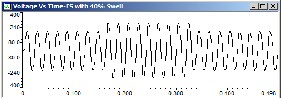
Fig.11. Experimental results via CCS environment with
40% Sag created between 1.67 secs to 3.341 secs (a). Actual voltage (b). Estimated voltage by Fourier series (c). Absolute error by Fourier series (d). Estimated voltage by ANFIS (e). Absolute error by ANFIS
Fourier and ANFIS Models are used and implemented in real time for various operating conditions with different loads. The main objective of sag and swell detection is achieved via voltage estimation through Fourier and ANFIS Models. The simulation results showed that the proposed method has the ability of recognizing and classifying different power disturbance types efficiently compared with Wavelet Transform. S-Transform generates contours, which are suitable for classification by simple visual inspection. The investigations conducted throughout this paper proved that a proper designed Fourier and ANFIS Models based estimators are capable of predicting voltage of any load within acceptable accuracy limits. Hence, the proposed methods can be right candidate for practical implementation of Voltage estimation and Sag Swell detection for power system applications.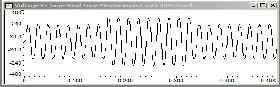
(a) (b) (c)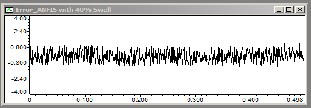
(d)
(e)
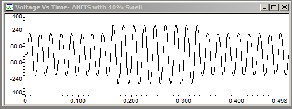
Fig.12. Experimental results via CCS environment with
40% Swell created between 1.67 secs to 3.341 secs (a). Actual voltage (b). Estimated voltage by Fourier series (c). Absolute error by Fourier series (d). Estimated voltage by ANFIS (e). Absolute error by ANFIS
[1] Dash,P.K. Panigrahi,B.K. and Panda,G. (2003) „Power
Quality Analysis using S– Transform‟, IEEE
Transactions on Power Delivery., Vol. 18, No. 2, pp.
406-411.
[2] P. Wang, N. Jenkins, and M. H. J. Bollen, “Experimental investigation of voltage sag mitigation by an advanced static VAr compensator,” IEEE Trans. Power Del., vol.
13, no. 4, pp. 1461–1467, Oct. 1998.
[3] Lee, I. W. C. and Dash, P. K (2006) „S-Transform-Based Intelligent System for Classification of Power Quality Disturbance Signals‟, IEEE Transactions on Industrial Electronics, Vol. 50, No. 4, pp. 800-805.
[4] X. Xiangning, X. Yonghai, and L. Lianguang, “Simulation and analysis of voltage sag mitigation using active series voltage injection,” in Proc. Int. Conf. Power System Technology, 2000, pp. 1317–1322.
[5] N. S. Tunaboylu, E. R. Collins, Jr., and P. R. Chaney, “Voltage distur-bance evaluation using the missing voltage technique,” in Proc. 8th Int. Conf. Harmonics and Quality of Power, 1998, pp. 577–582.
[6] Raj Naidoo, Member, IEEE, and Pragasen Pillay, Fellow,
IEEE, "A New Method of Voltage Sag and Swell Detection", IEEE TRANSACTIONS ON POWER DELIVERY, VOL. 22, NO. 2, APRIL 2007, pp1056-
1062.
[7] B. Bae, Member, IEEE, J. Jeong, J. Lee, Student Member, IEEE, and B. Han, Senior Member, IEEE, "Novel Sag Detection Method for Line-Interactive Dynamic Voltage Restorer", IEEE TRANSACTIONS ON POWER DELIVERY, VOL. 25, NO. 2, APRIL
2010, pp1210-1211.
[8] Sudipta Nath, Arindam Dey and Abhijit Chakrabarti
(2009) „Detection of Power Quality Disturbances using Wavelet Transform‟ World Academy of Science, Engineering and Technology, Vol.49, No.3, pp. 869-873.