International Journal of Scientific & Engineering Research Volume 4, Issue 1, January-2013 1
ISSN 2229-5518
Measuring and Processing the Brain’s EEG Signals with Visual Feedback for Human Machine Interface
Vijay Raghav Varada, Deepshikha Moolchandani, Asil Rohit
Abstract— The fundamental purpose of this paper is to measure, record and analyze raw brainwave signals using an Electroencephalogram(EEG) sensor mounted on the surface of the scalp in a non-invasive manner through a Brain Computer Interface(BCI) and extract and segregate suitable data from it from which control output can be formulated for control of an embedded system. The extraction and processing of eye-blink information as well as attention levels deduced from Beta wave oscillations extracted from raw brain EEG data, is paramount for generation of control output from which the Human Machine interface (HMI) is derived. Neurofeedback enables for a more intuitive control system to be formulated.
Index Terms— Brain computer interface, Electroencephalograph, Eye Blinks, LabVIEW, Neurofeedback, Neurosky.
—————————— ——————————
HE system consists of an intuitive way in which a locomo- tion conveying device such as a robot can be controlled by virtually no physically at all.
Such a setup would not only facilitate below neck paralyzed patients to control hardware such as electronic wheelchairs or robotic arms, but also enable any fully abled person to control systems telepathically without lifting a finger. In the long run, such a system can be coupled with existing manual control systems to make them more efficient and safe. Neurofeedback to the individual in the form of visual or haptic stimulus would be given so that they can control their brainwave out- put more easily and enable a more efficient control system.
Summary of Contributions:
Detecting voluntary multiple blinks from raw EEG
wave along with separation of natural blinking.
Mapping attention levels deduced from raw EEG
through simple signal processing to control output magnitude.
Extracting eye blink timing and magnitude for multi-
ple blinks.
Combining blink and attention magnitude data, along
with visual Neurofeedback for an intuitive final con- trol system.
————————————————
Deepshikha Moolchandani is currently pursuing bachelors degree program
in Electronics & Communication engineering in Manipal Institute of
Technology, India, E-mail: deepi.m4@gmail.com
Asil Rohit is currently pursuing bachelors degree program in Instrumenta-
tion & Control engineering in Manipal Institute of Technology, India, E-mail: asil.rohit@gmail.com
The control layout employed in this paper consists of four main features: The BCI, the signal processing system, the con- trol output system and the visual Neurofeelback system.
The BCI used here, is the NeuroSky MindWave Brainwave Headset. It extracts the raw EEG data from the scalp in a non- invasive manner and transmits it via Bluetooth to the pro- cessing unit. The device consists of a headset, an ear clip, and a sensor arm. The headsets reference and ground electrodes are on the ear clip and the EEG electrode is on the sensor arm, resting on the forehead above the eye.
The most unique aspect on this particular BCI as compared to others available in the market is that it incorporates dry- sensors for its electrodes without the need for any conductive gels to be applied on the skin and was the paramount criteria for the selection of this equipment over others.
The single sensor on FP1 site (above left eyebrow) provides a high degree of freedom; it can measure multiple mental states simultaneously, and its close proximity to the eye enable it to detect Electromyography (EMG) signals created by eye blinks.
This enables us to process various variables that can be formu- lated into a control algorithm in the processing unit from which an efficient control system can be derived.
The Neurosky Mindwave BCI sends brainwave and debug- ging information wirelessly through Bluetooth communica- tion. The device creates a virtual communications port (COM port) and sends data serially by serial over Bluetooth commu- nication protocol.
The Think Gear Communications Driver (TGCD) is a device
driver with a simple API that allows communication between
an Application on a computer and a Think Gear chip (the
ASIC chip embedded inside the Mindwave headset).It is
available as a .dll file. Using the documentation provided by
IJSER © 2013 http://www.ijser.org
International Journal of Scientific & Engineering Research Volume 4, Issue 1, January-2013 2
ISSN 2229-5518
Neurosky along with the driver it is possible to create standalone applications on a computer or mobile platforms
The use of LabVIEW graphical programming environment enables for a platform for easy development of complex fea- tures along with error handling capabilities as well as to abil- ity to build an intuitive and interactive interface with the user. LabVIEW communicates with the BCI using the TGCD driver with the ability to receive data pertaining to signal strength as well as error information from the headset and display it on the computer screen.
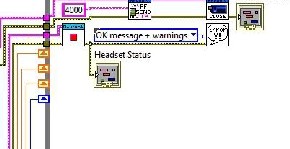
Fig 2.2 shows simple error handling VI’s to stop the program and output error information to the screen in the case of an error before or during execution of the program. This enables for easy and fast debugging, allowing for a user friendly interface.
Fig2.1 Error Handling in the VI
LabVIEW is graphical programming environment. Programs in IDE are called Virtual Instruments (VIs), consists of a Block Diagram (BD) and a Front Panel (FP). A BD provides a graph- ical code development environment whereas a FP allows the user to interact with a VI. It provides an efficient and easy-to- use environment for code development especially w LabVIEW is graphical programming environment. Programs in IDE are called Virtual Instruments (VIs), consists of a Block Diagram (BD) and a Front Panel (FP). A BD provides a graphical code development environment whereas a FP allows the user to interact with a VI. It provides an efficient and easy-to-use en- vironment for code development especially when the user needs to interact with the program and visualize the results. Unlike text-based programming languages like C which fol- low a control flow execution model, the environment of pro- gramming follows a dataflow execution model.
After an extensive and exceedingly informative session with Dr. Praveen Kumar of Tranquil Minds Psychiatric clinic of SIMHANS (Samhita Institute of Mental Health and Neuro Sciences Pvt. Ltd.) in Hyderabad, one comes to understand that Scalp EEG picked up from sensors placed on the forehead is in actuality a summation of brainwaves of different fre- quencies and artifacts such muscle activity, eye blinks, pulse signals and line noise. Extracting useful artifacts from raw
EEG signal and transforming it into a useful control output is done by processing it in LabVEW. The FP provides for a use- ful tool for providing Neurofeedback to the user.
The input raw EEG as mentioned above also includes the EOG, which basically can be termed as wavelets with larger amplitudes due to muscle related movements in the ocular region. Since the acquisition is done in real time, thresholding the amplitudes pertaining to the eye blinks and counting the time intervals between consecutive eye blinks has worked effi- ciently in counting two and three consecutive eye blinks and also eliminating the effect of normal eye blinks. The following part of the block diagram describes the analysis of raw data, thresholding, and outputting the number of blinks on visual feedback which is further utilized in controlling the device.
Blinking causes a spike in the EEG of appreciable magnitude as compared to base signal without the blink artifact. This en- ables us to detect eye blinks by thresholding the EEG signal. Also, the time difference between consecutive eye blinks can also be found out with simple programming instructions in- volving timed looping statements and shift registers to send data between loops in LabVIEW. A clear momentary spike can be seen in fig 3.1 where a blink occurred as opposed to a clear EEG waveform with no physical movements occurring.
Fig3.1 blink occurring in the second waveform chart.
When a single blink of magnitude more than that set by a cer- tain threshold occurs, a counter starts counting the number of milliseconds before another blink occurs. If the blinks occur within a certain time limit, it is counted as a double blink. In a similar manner, triple blinks are also detected.
Experimentally, it has been found that voluntary blinking produces a deflection of magnitude 400 micro volts and above, thus this is used as a threshold for blink detection.
IJSER © 2013 http://www.ijser.org
International Journal of Scientific & Engineering Research Volume 4, Issue 1, January-2013 3
ISSN 2229-5518
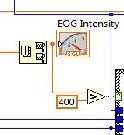
Fig3.2 Thresholding blink intensity
Therefore, essentially, only forced voluntary blinks are detect- ed and natural blinks are overlooked. Fig 3.3 shows the blink detecting code for double and triple blinks.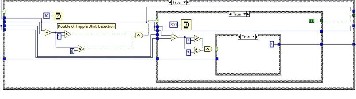
Fig3.3 Double and triple blink detection VI
As mentioned above, raw EEG data is essentially a summation of various brain wave oscillations and artifacts. Some oscilla- tions of notable importance are as follows:
1. Alpha waves: Frequency ranging from 3- 13 Hz and corre- sponds to meditation levels in the brain activity.
2. Beta waves: Frequencies ranging from 12 – 30 Hz and these beta states are the states corresponding to normal waking con- sciousness.
3. Theta waves: 4 hz- 7 Hz.
4. Delta waves: Frequencies less than 3 Hz.
The beta wave in particular can be attributed to the “concen-
tration” part of the brain activity and this is what is being used
to control the output magnitude. The beta wave magnitude is
deduced by first building a waveform 450 samples long by
inserting samples sent by the BCI point-by point into an array
and then using an elliptic bandpass filter and the power spec- trums are respectively calculated after using FFT on the input signal as shown in fig.3.4. Similarly meditation which corre- sponds to alpha wave intensity can also be deduced. The
power spectrum for alpha wave is shown in fig 3.5
Fig3.4 Beta wave intensity extraction
Fig3.5 power spectrum output for Alpha wave(meditation)
The power spectrum is put on a 0 to 100 numeric scale. This scaling is then converted to a 0 to 255 (8 bit resolution) scale since the control output magnitude output needs an 8 bit in- put to function properly. This is done by the equation (1)
(x- in_min)(out_max - out_min / in_max - in_min)+out_min (1)
Where x is the value to be scaled, in_min and out_min are the minimum input and output values respectively and in_max and out_max are the maximum input and output values re- spectively.
On the 0-100 scale, a beta level reading of 40-60 is considered normal. Control output should only be sent to the actuators for elated values of attention or concentration, thus a numeric threshold is compared with the attention level, above which, the final control output would be sent.

Neurofeedback, also called biofeedback, is a treatment where EEG equipment is used to present real-time records of brain activity. This enables to training yourself, for instance to be- come more concentrated or relaxed, by altering your brain wave patterns over time. Feedback about your concentration level is for instance given as a graph, illustrated in fig 3.6
Fig3.6 NeuroFeedback using a blue bar graph
The subject’s task is usually to keep the bar above a certain threshold, indicated here by the horizontal black line. Typical- ly one training sessions like this last for about 45-60 minutes and needs to be repeated to get the wanted effect, variating from 25-50 times depending on the patient (Heinrich, Gevens- leven, & Strehl,
2007)
IJSER © 2013 http://www.ijser.org
International Journal of Scientific & Engineering Research Volume 4, Issue 1, January-2013 4
ISSN 2229-5518
LabVIEW FP provides for an excellent way to implement neurofeedback. Along with attention and meditation levels, EOG reading, raw EEG reading along with the control out- put selection can be outputted in a user friendly way. Fig
3.7 shows the final LabVIEW FP implemented.
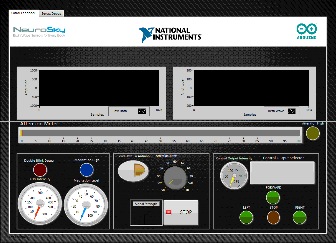
Fig3.7 NeuroFeedback using a LabVIEW FrontPanel
The multiple blink information and attention magnitude data is used for the control output. The system is set up to control motion in a 2-D axis where double blinks are used to cycle between forward, left and right. Triple blink is for stoping the output. An integer is assigned for each direction. The magni- tude of motion is decided by the attention levels in the cur- rently selected direction.
The direction and magnitude information in concatenated into a string with the first character pertaining to the direction and three characters following pertaining to the magnitude of movement in 8 bit resolution. This information is sent to an Arduino microcontroller board serially. The code fragment can be seen in fig 4.1.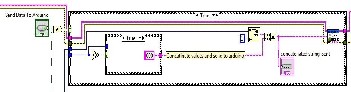
Fig3.7 Send concatenated string to Arduino
The arduino to which the VI is sending information to serially is connected to a RF transmitter that transmits the concatenat- ed string to the robot to be controlled. The code running on the robot separated the two parts of the string and using switch-case statements is able to drive the robot in a differen- tial drive manner. Allowing for easy wireless control.
The proposed control process generates control outputs to select directing of motion and magnitude of motion. Such a control system can thus be used to operate any physical or software component in which the final output is its move- ment. Such a setup would not only facilitate below neck paralyzed patients to control hardware such as electronic wheelchairs or robotic arms, but also enable any fully abled person to control systems telepathically without lifting a finger.
The authors wish to thank Dr. Praveen Kumar of Tranquil Minds Psychiatric clinic of SIMHANS (Samhita Institute of Mental Health and Neuro Sciences Pvt. Ltd.) for taking the time and explaining us the various aspects.
[1] Heinrich, H., Gevensleven, H., & Strehl, U. (2007). Annotation: Neu- rofeedback -train your brain to train behaviour. Journal of Child Psy- chology and Psychiatry,48:1, 3–16.
[2] Larsen, E. A. (2010). Playstation Controlled by Brain Waves (Tech.
Rep.). Trondheim.
[3] Mitsar. (2008). BIOFEEDBACK TRAINER MITSAR-BFB. pdf available at http://www.mitsar-medical.com/download/promo/Mitsar-BFB
2008.pdf.
[4] Mitsar. (2010). Mitsar Co. Ltd. Medical equipment for functional diag- nostics and neurofeedback. Retrieved from http://www.mitsar- medical.com/.
[5] Neurosky. (n.d.). Neurosky. Available from http://www.neurosky.com/
[6] NeuroSky, I. A. (2010). ThinkGear Socket Protocol (Tech. Rep.). Avail- able from http://www.neurosky.com
[7] Reuderink, B. (2008b). Games and brain-computer interfaces: The state of the art. WP2
[8] Schalk, G., McFarland, D. J., Hinterberger, T., Birbaumer, N., & Wolpaw, J. R. (2004, June). BCI2000: a general-purpose braincomput- er interface (BCI) system. (Vol. 51) (No. 6). Available from http://www.ncbi.nlm.nih.gov/pubmed/15188875
[9] SmartBrain. (n.d.). Biofeedback. Retrieved december 2010, from http://www.smartbraintech.com/.
[10] S. Delsanto, F. Lamberti and B. Montrucchio, "Automatic ocular arti- fact rejection based on independent component analysis and eyeblink detection," IEEE EMBS Conference on Neural Engineering, pp. 309-
312, 2003.
[11] V. J. Samar, A. Bopardikar, R. Rao, and K. Swartz, "Wavelet analysis of neuroelectric waveforms: a conceptual tutorial," Brain and lan- guage, vol. 66, pp. 7- 60, Jan 1999.
[12] V. Krishnaveni, S. Jayaraman, L. Anitha and K. Ramadoss, "Removal
of ocular artifacts from EEG using adaptive thresholding of wavelet coefficients," J. Neural Eng., vol. 3, pp. 338-346, Dec. 2006.
[13] Croft RJ, Barry RJ “Removal of ocular artifact from the EEG: a re- view” Clinical Neurophysiology, 30(1), pp 5-19, 2000
[14] S.Venkata Ramanan, J.S.Sahambi, N.V.Kalpakam , “A Novel Wavelet Based Technique for Detection and De-Noising of Ocular Artifact in Normal and Epileptic Electroencephalogram” BICS 2004.
[15] Micheal, Arduino Cookbook, 3rd ed., vol. 2, pp.68-73.
IJSER © 2013 http://www.ijser.org