International Journal of Scientific & Engineering Research, Volume 2, Issue 11, November-2011 1
ISSN 2229-5518
Mathematical Modeling of Electrical Discharge Machining Process through Response Surface Methodology
S. S. Baraskar, S. S. Banwait, S. C. Laroiya
Abstract— Proper selection of manufacturing conditions is one of the most important aspects in the die sinking Electrical Discharge Machining process, as these conditions determine important characteristics such as Surface Roughness, Material Removal Rate and Tool Wear Rate. In this work, mathematical models have been developed for relating the Surface Roughness, Material Removal Rate and Tool Wear Rate to machining parameters like discharge current, pulse-on time and pulse-off time. The developed models predict the machining conditions from rough machining region to finish conditions within the experimenral domain. Response Surface Methodology has been applied for developing the models using the techniques of Design of Experiments and multi linear regression analysis. Central composite rotatable design was used to plan the experiments. Second order response surface models were found to be the most suitable in the present work. The developed models have been validated by conducting confirmation experiments.
Index Terms—central composite design, design of experiments, electrical discharge machine, mathematical models, response surface methodology, regression analysis.
1 INTRODUCTION
—————————— ——————————
LECTRICAL Discharge Machining (EDM), an important tant ‗non-traditional manufacturing method‘, developed oped in the late 1940s, has been accepted worldwide as a
as a standard process in manufacture of forming tools to produce plastics mouldings, die castings, press tools, forging dies etc. In EDM process, material is removed by action of electrical discharge between the tool and the work piece. Thousands of electrical discharges per second are generated and discharge produces a crater by melting and vaporiza- tion. Some melted material is flushed away by the dielectric fluid and the remaining material re-solidifies to form dis- charge craters. A dielectric fluid not only flushes out the chips but also confines the electric discharge. Thus a perfect reproduction of shape of the tool on the work piece is repro- duced. Therefore, EDM is a technique used in industry for high-precision machining of all types of conductive mate- rials such as metals, metallic alloys, graphite, ceramics, etc. Material of any hardness can be machined as long as materi- al can conduct electricity. Since researchers have encoun- tered major difficulties due to complexities of physics in EDM process, the physical models are found to be far away from reality [1]. On the other hand, experimentalists have tried to establish empirical models based on statistical analy- sis and optimization methods. Regression Analysis is re- garded as a powerful tool for representing the relationship between input parameters and the process responses [2]. M. R. Shabgard et al. [2] suggested mathematical models for re- lating the Material Removal Rate (MRR), Tool Wear Ratio
————————————————
S. S. Baraskar is currently pursuing his Ph.D degree in Mechanical Engi- neering at National Institute of Technical Teachers Training & Research (NITTTR), Chandigarh, India. E-mail: sunilbaraskar64@gmail.com
S.S.Banwait is presently a professor in Mechanical Engineering Depart- ment at NITTTR, Chandigarh, India. E-mail: banwait_ss@hotmail.com.
S.C. Laroiya is a Ex Director, NITTTR Chandigarh, India.
(TWR) and Surface Roughness (SR) to machining parame- ters. Response Surface Methodology (RSM) approach is used to determine the relationship between various process pa- rameters and machining criteria of FW4 welded steel. C.J. Luis and I. Puertas [3] introduced a new methodology for developing technological tables used in EDM process for machining of conductive ceramics material. Techniques of design of experiments and multiple linear regressions are used. A second order mathematical model was developed and evaluated to predict the optimal conditions suitable for electric discharge machining of Aluminum Matrix Compo- sites (AMC) over the listed technological characteristics [4], [5]. I. Puertas et al. [6] carried out study on the influence of process parameters on the listed machining characteristics. In his work, focus was based on machining of conductive ce- ramics. It has been confirmed that the combined technique of design of experiment and multiple linear regression anal- ysis can be successfully applied to model the surface rough- ness, material removal rate and electrode wear. Jose Mara- fona et al. [7] suggested a fractional factorial method for op- timizing MRR in EDM using copper-tungsten electrode on D2 tool steel work piece. Developed method gives signifi- cant improvement in MRR for a given tool wear ratio. Asif Iqbal et al. [8] used Response surface methodology to inves- tigate the relationships and parametric interactions between three controllable variables on the MRR, EWR and Ra in EDM milling of AISI 304 steel. Developed models can be used to get the desired responses within the experimental range. P. Sahoo et al. [9] demonstrated the effect of most in- fluencing parameters on surface roughness using response surface methodology for different work piece materials in EDM. EI-Taweel T.A. [10] investigated the relationship of process parameters in EDM of CK45 steel with electrode of composite material such as Al-Cu-Si-TiC. The RSM was em- ployed for developing models of MRR and TWR and found
IJSER © 2011
http://www.ijser.org
International Journal of Scientific & Engineering Research, Volume 2, Issue 11, November-2011 2
ISSN 2229-5518
that experimental and predicted values are in good agree- ment. D Kanagarajan et al. [11] developed models for the MRR and SR over the most influencing process parameters in EDM of WC/30% Co composites. The RSM methodology is used to identify the most influential parameters for max- imizing metal removal rate and for minimizing the surface roughness. M. K. Pradhan et al. [12],[13] used RSM method to investigate the effect of input parameters on SR and MRR in EDM of AISI D2 tool steel. It was found that the devel- oped models can be used effectively in prediction of res- ponses. From literature survey, it reveals that not much in- formation is available regarding the influence of copper elec- trode on EN-8 material using RSM. It was also seen that most published work were limited to specific range of process parameters which produces responses either in finish region, semi-finish region or roughing region. In this work, mathematical models have been developed for relat- ing the SR, MRR and TWR to machining parameters like discharge current, pulse-on time and pulse-off time which varied over wide range from roughing region to nearly fi- nishing conditions. EN-8 is the most widely used medium carbon steel for manufacture of mould and dies by small and medium industries in India.
2 EXPERIMENTATION
The equipment used to perform the experiments is a die- sinking EDM machine (Model G 30 Integrated Type, Make: Toolcraft India). The machine has maximum current capacity of 25 A. It can run either in normal polarity or in reverse polar- ity. As a convention in this machine, for normal polarity the work-piece is connected to the negative terminal and the tool is connected to positive terminal of the source, where as for reverse polarity it is just the opposite. It has 10 on-time set- tings (2 μs to 2000 μs) and 10 off-time settings (2 μs to 2000 μs). Experiments were performed with normal polarity.
In the present study, surface roughness, material re- moval rate and absolute tool wear rate has been considered for evaluating the machining performance. All these performance characteristics are correlated with machining parameters such as discharge current, pulse-on time and pulse-off time. Proper selection of machining parameters can result in desirable ma- terial removal rate and required surface finish. Experiments were conducted covering wide range of current settings, pulse-on time and pulse-off time. The machining conditions used during experimentation have been shown in Table 1. Work piece material was cut into rectangular cross section and top and bottom faces of the work piece were ground to make flat and good surface finish prior to experimentation. A pho- tograph of the EDMed work piece is shown in Fig. 1. The cop- per electrode was having rectangular cross section of
20x10mm. The electrode was polished and buffed prior to every experimental run. Machining depth was kept constant at
0.5mm for every experimental run and correspondingly ma- chining time was measured with an accuracy of 1 second. After every run, the work piece and tool were detached from the machine, cleaned, dried and weighed before and after ma- chining.
3 DESIGN OF EXPERIMENTS
The design factors, response variable as well as the methodology employed for the experimentation is described below.
3.1 Design factors
The design factors considered in the present work were discharge current (I), pulse-on time (Ton) and pulse-off time (Toff). The selection of these three factors have been made because they are the most important and widely used by re- searchers in the die sinking EDM field [3].
3.2 Response variables
The selected response variables MRR, TWR and SR
are defined as follows:
Material removal rate was calculated from the dif-
ference of weight of work-piece before and after the machin-
ing process.
MRR = (Wi - Wf / ρs t) mm3/ min (1) Where, Wi is the initial weight of work-piece in g; Wf
is the weight of work-piece after machining in g; t is the ma-
chining time in minutes and ρs is the density of steel (7.8 X
10-3 g/mm3 ).
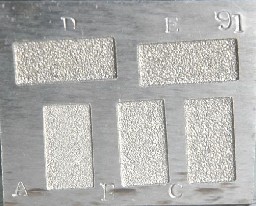
Fig. 1. Photograph of EDMed work piece
The wear of copper electrode was calculated from the weight difference of electrode before and after the machining and is expressed as:
TWR = (Ei - Ef / ρCu t) mm3/ min (2)
Where, Ei is the initial weight of electrode in g; Ef is the weight of electrode after machining in g; t is the machining time in minutes and ρCu is the density of copper (8.9 x 10⁻³ g/mm3). The weight of the work-piece and tool were meas- ured in a high precision digital balance (Make: Essae-Teraoka) which has the accuracy of 10-4 g and thus eliminates the possi- bilities of large error. Surface roughness value, Ra was meas- ured with a portable surface roughness tester ―Surftest SJ-301‖
IJSER © 2011
http://www.ijser.org
International Journal of Scientific & Engineering Research, Volume 2, Issue 11, November-2011 3
ISSN 2229-5518
TABLE 1
MACHINING CONDITIONS USED DURING EXPERIMENTATION


Electrode | Work-piece | Dielectric fluid | Flushing type |
Copper (electrolytic grade) Rectangular: 20mm X 10mm | EN8 Steel Rectangular: 40 mm X 50 mm | EDM oil (Grade 30) | Submerged in dielectric |

TABLE 2

MACHINING PARAMETERS AND THEIR CORRESPONDING VARIATION LEVELS
Symbols Machining parameters Units
Levels


-1.682 (-1) (0) (+1) +1.682
A Discharge current (I) A 3 6 12 18 21
B Pulse-on time (Ton) μs 10 200 500 750 1000

C Pulse-off time (Toff) μs 10 200 500 750 1000
(Make: Mitutoyo). The cut-off was set at 2.5 x 5 mm with an evaluation length of 12.5 mm and roughness values were the average of 5 measurements per specimen. When measuring surface roughness, the only parameter to be evaluated was Ra as this is the most widely used parameter in industrial appli- cations.
3.3 Factorial design employed
Experiments were designed on the basis of design of experi- ments. The design finally chosen was a factorial design 23 with six central points, which provide protection against curvature, consequently carrying out a total of 14 experiments. The addi- tion of six central points allowed carrying out lack-of-fit tests for the first order models proposed. In case the first order model turned out not to be adequate for modeling the beha- vior of the response variable to be studied, this was widened by adding six star points, thus giving a central composite de- sign with the star points located in the centers of the faces. So, the case of the second order model turned out to be made up of a total of 20 experiments, the previous 14 from the first or- der model plus the six star points. Based on the Central Com- posite Design (CCD), experiments were conducted to develop empirical models for SR, MRR and TWR in terms of the three input variables: discharge current, pulse-on time and pulse-off time. Each input variable (factor) was varied over five levels:
±1, 0 and ±α. Table 2 shows the relationship between the ma-
chining parameters and their corresponding selected variation
levels, taking into account the entire range of machine para-
meters.
4 RESPONSE SURFACE METHODOLOGY
Response surface methodology is a collection of mathematical and statistical technique that is useful for modeling and analy- sis of problems in which a response of interest is influence by several variables and the objective is to optimize the response [14], [15]. In order to study the effect of EDM process parame- ters on the volumetric Material Removal Rate, Tool Wear Rate and Surface Roughness, a second order polynomial response was fitted into the following equation-
Y = β0 + β1X + β2Ф + β3 Ψ + β12XФ + β13X Ψ
+ β23ФΨ + β11X2 + β22Ф2 + β33 Ψ2 (3)
Where Y is the response and X, Ф, Ψ are the quantitative va- riables.
β1, β2 and β3 represent the linear effect of X, Ф, and Ψ respec- tively. β11, β22 and β33 represents the quadratic effect of X, Ф and Ψ, whereas β12 , β13 and β23 represents the linear by li- near interaction between ―X and Ф‖, ―X and Ψ‖, ―Ф and Ψ‖ respectively. These quadratic models work quite well over the entire factor space and the regression coefficients were com- puted according to Least-square procedures.
5 EXPERIMENTAL RESULTS
Table 3 shows the design matrix developed for the proposed model as well as the machining characteristics value obtained in the experiments for SR, MRR and TWR.
6 MODELING RESPONSE VARIABLES
Equation (4), (5) and (6) presents the prediction models for SR, MRR and TWR respectively.
SR = 0.11481 + 1.26561 I + 9.67469E-3 Ton
+ 9.00961E-4 I Ton - 2.3669E-2 I2 - 2.2945E-5 Ton2 (4)
MRR = -1.48134 + 1.84529 I + 2.0405E-2 Ton
– 3.8946E-2 Toff + 2.66456E-5 Ton Toff
- 3.11918E-5 Ton2+1.76577E-5 Toff2 (5)
1 / SQRT (TWR) = +11.36779 – 1.49576 I + 4.98329E-3 Ton
+ 2.21268E-3 Toff + 4.9392E-2 I2 – 2.69740E-6 Ton2
– 2.46777E-6 Tof 2 (6)
Where, the values of the variables have been specified accord- ing to their original units.
IJSER © 2011
http://www.ijser.org
International Journal of Scientific & Engineering Research, Volume 2, Issue 11, November-2011 4
ISSN 2229-5518
TABLE 3
DESIGN OF EXPERIMENT MATRIX AND MACHINING
CHARACTERISTICS
TABLE 5
ANOVA FOR QUADRATIC MODEL OF SR


Source SS DF MS F-value P-value
Model 660.33 5 132.066 60.74 <0.0001
I 569.10 1 569.10 261.76 *<0.0001
Ton 1.88 1 1.88 0.86 0.3686
I Ton 17.73 1 17.73 8.16 *0.0127
I2 7.44 1 7.44 3.42 0.0856
T 2 55.99 1 55.99 25.75 *0.0002
Residual 30.44 14 2.174 … …

Total 690.77 19 … … <0.0001
TABLE 6
POST ANOVA MODEL ADEQUACY FOR SR

R2 | 0.9559 |
Adj. R2 | 0. 9402 |
Pred. R2 | 0.8472 |
Adeq. precision | 23.80 |

Experimental value
Predicted value

27
squared. Hence the quadratic model suggested is most appro- priate.
TABLE 4
MODEL SUMMARY STATISTICS FOR SR
Source | SD | R2 | Adj. R2 | Pred. R2 | PRESS |
Linear | 2.5719 | 0.8467 | 0.8180 | 0.7415 | 178.8726 |
2FI | 2.5437 | 0.8782 | 0.8220 | 0.7623 | 164.1777 |
*Quadratic | 1.5424 | 0.9655 | 0.9354 | 0.7505 | 172.3384 |
**Cubic | 0.8034 | 0.8853 | 0.9822 | --- | --- |
*=Suggested; **= Aliased; SD=Std. Dev. |
Table 5 shows the variance analysis results of the proposed model of SR. The ANOVA table includes Sum of Squares (SS), Degrees of Freedom (DF), Mean Square (MS), F-value and P- value. The MS was obtained by dividing the SS of each of the sources of variation by the respective DF. The P-value is the smallest level of significance at which the data are significant. The F-value is the ratio of MS of the model terms to the MS of the residual.
1 2 3 4 5 6 7 8 9 10 11 12 13 14 15 16 17 18 19 20 21
Experimental run
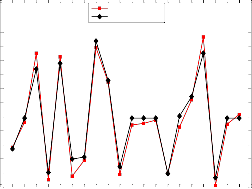
Fig. 2. Experimental Vs. Predicted value of SR.
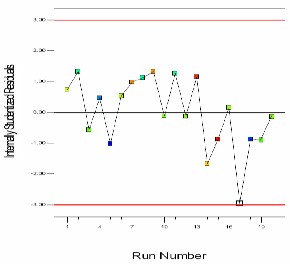
Fig. 3. Residuals Vs. Run for SR
IJSER © 2011
http://www.ijser.org
International Journal of Scientific & Engineering Research, Volume 2, Issue 11, November-2011 5
ISSN 2229-5518
In this analysis, insignificant model terms were eliminated to adjust the fitted mathematical model. As seen from Table 5,
TABLE 7
MODEL SUMMARY STATISTICS FOR MRR
the P-values for developed model of SR is less than 0.05,
which indicates that model is significant at 95% confidence level. It was noted that MS of the model (132.066) is many
times larger than MS of the residual (2.174), thus the com- puted F-value of the model (F=132.066/2.174) of 60.74 implies that the model is significant. Table 6 shows the ―R-Squared (R2)‖, "Adjusted R-Squared (Adj. R2)" and "Predicted R- Squared (Pred. R2)" statistics. The R-Squared is defined as the ratio of variability explained by the model to the total variabil- ity in the actual data and is used as a measure of the goodness of fit. The more R2 approaches unity, the better the model fits
the experimental data. For instance, the obtained value of
0.9559 for R2 in the case of SR (Table 6) implies that the model
explains variations in the surface roughness (Ra) to the extent of 95.59% in the current experiment and thus the model is
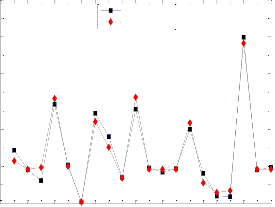
adequate to represent the process. The "Predicted R2" of 0.8472 is in reasonable agreement with the "Adjusted R2" of 0.9402 because the difference between the adjusted and predicted R2 is within 0.2 as recommended for model to be adequate. The value of ―Pred. R2" of 0.8472 indicates the prediction capabili- ty of the regression model. It means that the model explain about 84.72% of the variability in predicting new observations as compared to the 95.59% of the variability in the original data explained by the least square fit. "Adeq Precision" meas- ures the signal to noise ratio. A ratio greater than 4 is desira- ble. The ratio of 23.809 indicates an adequate signal. Thus, the overall prediction capability of the model based on these crite- ria seems very satisfactory. Fig. 2 presents a plot of experi- mental versus the predicted values of SR. Since all the pre- dicted values are close to the experimental values, confirming that the model could predict the responses accurately. Similar- ly, internally studentized residuals obtained were plotted against run for the model of SR is shown in Fig. 3. Residuals were calculated as a difference between the measured and predicted values, whereas internally studentized residuals are the ratio of residual to the estimated standard deviation of that residual. It measures the number of standard deviations sepa- rating the actual and predicted values. It was found that inter- nally studentized residuals for regression model of SR are be- tween +1.935 to -2.966. Since all the standardized residuals lie within the limits (± 3 sigma) without any outliers, further con- firmed that the model can be used to predict the response.
6.2 Model Adequacy Test for MRR
Similarly, a pre-ANOVA model statistics, the ANOVA results and the post-ANOVA model adequacy for the developed model of MRR are shown in Table 7, 8 and 9 respectively. Least SD and PRESS of quadratic model confirm that quadrat- ic model is most suitable. The plots from Fig. 4 and Fig. 5 fur- ther confirm that the developed model can be used to predict the MRR efficiently.
TABLE 8
ANOVA FOR QUADRATIC MODEL OF MRR


Source SS DF MS F-value P-value
Model 1808.82 6 301.47 40.44 <0.0001
I 1532.30 1 1532.30 205.55 *<0.0001
Ton 12.80 1 12.80 1.72 0.2128
Toff 98.51 1 98.51 13.22 *0.0030
T 2 102.20 1 102.20 13.71 *0.0027
Toff2 32.75 1 32.75 4.39 0.0562
Ton Toff 32.72 1 32.72 4.39 0.0563
Residual 96.91 13 7.45 … …
Total 1905.73 19 *Significant terms … …

TABLE 9
POST ANOVA MODEL ADEQUACY FOR MRR

R2 | 0.9491 |
Adj. R2 | 0. 9297 |
Pred. R2 | 0.8266 |
Adeq. precision | 21.13 |

Experimental value
Predicted value
33
30
27
24
21
18
15
12
9
6
3
0
0 1 2 3 4 5 6 7 8 9 10 11 12 13 14 15 16 17 18 19 20 21
Experimental run
Fig. 4. Experimental Vs. Predicted values of MRR
IJSER © 2011
http://www.ijser.org
International Journal of Scientific & Engineering Research, Volume 2, Issue 11, November-2011 6
ISSN 2229-5518
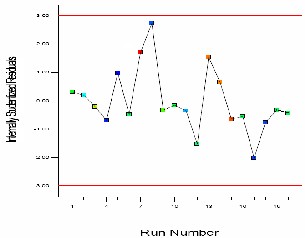
TABLE 12
POST ANOVA MODEL ADEQUACY FOR TWR

R2 | 0.9709 |
Adj. R2 | 0.9574 |
Pred.R2 | 0.8587 |
Adeq. precision | 32.83 |

12
11
10
9
8
Fig. 5. Residuals Vs. Run for MRR 7
6
6.3 Model Adequacy Test for TWR 5
4
The statistical analysis of the model of TWR is presented in 3
Table 10, 11 and 12 respectively. Since quadratic model is hav- 2
ing least Standard Deviation (0.4877) and Predicted Error Sum
Experimental value
Predicted value
of Squares (20.1010) among the other models, hence suggested. Similarly, the plot in Fig. 6 shows the prediction capability of the model, whereas the plot of residual vs. run number is de- picted in Fig. 7. The results of the statistical analysis and plots show that model can satisfactorily be used in predicting the response of TWR.
TABLE 10
MODEL SUMMARY STATISTICS FOR TWR
Source | SD | R2 | Adj. R2 | Pred.R2 | PRESS |
Linear | 1.5370 | 0.5641 | 0.4824 | 0.2761 | 62.779 |
2FI | 1.7019 | 0.5657 | 0.3653 | 0.1684 | 72.120 |
*Quadratic | 0.4877 | 0.9725 | 0.9478 | 0.7682 | 20.101 |
**Cubic | 0.0828 | 0.9996 | 0.9984 | --- | --- |
*=Suggested; **= Aliased; SD=Std. Dev. |
TABLE 11
ANOVA FOR QUADRATIC MODEL OF TWR
1
0 1 2 3 4 5 6 7 8 9 10 11 12 13 14 15 16 17 18 19 20
Experimental run
Fig. 6. Experimental Vs. predicted values of TWR
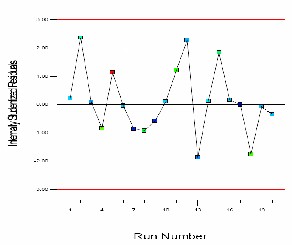
Fig. 7. Residuals Vs. run for TWR
7 RESULTS AND DISCUSSION
The influence of electrical discharge machining parameter I, Ton and Toff on the selected response variables were assessed. Since EDM is a non-linear process, to predict the responses accurately second –order models were postulated in obtaining a relationship between process parameters and response va- riables. The analysis of variance (ANOVA) was used to check the adequacy of the model. Design Expert 8.0 software was used for analyzing the experimental data. Values of various regression statistics were compared to identify the best fit model. The fitting was further improved by eliminating the
IJSER © 2011
http://www.ijser.org
International Journal of Scientific & Engineering Research, Volume 2, Issue 11, November-2011 7
ISSN 2229-5518
insignificant terms through a backward step-wise model fit- ting. The developed RSM-based mathematical models of SR, MRR and TWR are discussed below.
750
SR
6.91
7.1 Analysis of Surface Roughness
ANOVA for Response Surface Reduced Quadratic Model of the SR is depicted in Table 5. It is seen that, the discharge current (I), the interaction of discharge current and pulse-on time (I-Ton) and finally the pure quadratic effect of pulse-on time (Ton2) has a significant effect on the SR. The discharge current is the most significant factor among all the process parameters. Fig.8 shows the estimated response surface for the SR parameter, according to design parameters of discharge current and pulse-on time, whilst pulse-off time remains con-
640
530
420
310
200
9.51 11.72
13.60
15.52
17.15
18.84
20.40
21.58
stant at 500 μs. It shows that when discharge current is in-
creased, the SR parameter tends to increase appreciably.
Higher current results in increase in the amount of heat energy
at the point of discharge, where a pool of molten metal is
formed and overheated. Part of the molten material is flushed away by dielectric while overheated molten metal evaporates,
which results in formation of larger crater thus producing a rough surface. It is also observed that the SR parameter in- creases when the pulse-on time is increased in its central value
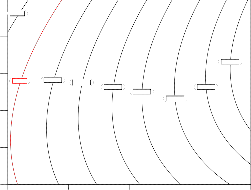
of approx. 500 μs, after which it tends to decrease gradually. The graph in Fig.9 is the two-dimensional contour plot ob- tained by connecting points of current and pulse-on (I- Ton), while the pulse-off time remains constant at 500 μs. If a par- ticular value of surface roughness is desired, for example 9.51 μm, according to Fig.9 there are many combinations of current density and pulse-on time, on the contour line of SR= 9.51 μm.
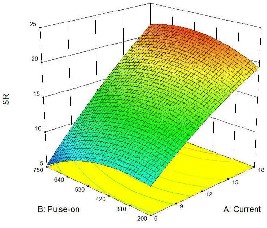
Fig. 8. Response surface of SR Vs. Pulse-on and current
7.2 Analysis of Material Removal Rate
The interaction and effect of various process parameters on MRR is represented in Table 8. It shows that I, Toff and pure quadratic effect of pulse on (Ton2) has a significant impact on the MRR. The discharge current is the most significant factor among all the process parameters.
6 9 12 15 18
A: Current
Fig. 9. Contours of SR Vs. Pulse-on and Current
Fig. 10 shows the estimated response surface of MRR, varying discharge current and pulse-on time. As seen from this figure, increase in the current value leads to an increase in spark ener- gy across electrode gap and hence MRR increases. Similarly, the MRR tends to increase for increase in pulse-on time factor to its central value, and then it gradually decreases within the work interval. This is due to the fact that although spark energy in- creases with increasing Ton, the decrease in MRR at higher Ton is due to high gap pollution and insufficient flushing conditions. Increase in the MRR usually leads to increase in surface rough- ness. Higher value of MRR 32.76 mm3/min is achieved with I =
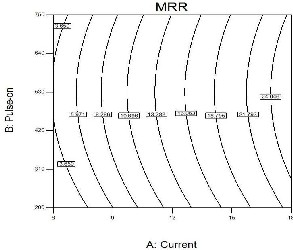
18 A, Ton = 500 μs and Toff = 200 μs within the experimental range. The contour plot of I and Ton for predicting the MRR is depicted in Fig. 11, keeping the Toff constant to a value of 500 μs. Among many combinations of process parameters, the op- timum combination can be selected from this contour graph.
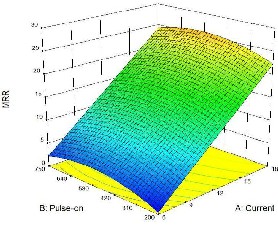
Fig. 10. Response surface of MRR Vs. Pulse-on and Current
7.3 Analysis of Tool Wear Rate
The significant effect of process parameter on TWR is depicted in Table 11. It is seen that I, Ton and finally the pure quadratic effect of current (I2) has a significant effect on the TWR.
IJSER © 2011
http://www.ijser.org
International Journal of Scientific & Engineering Research, Volume 2, Issue 11, November-2011 8
ISSN 2229-5518
750
640
530
5.874

1/Sqrt(TWR)
2.667
2.963
420
310
200
4.775
4.013
3.358 2.963
2.343
2.055
1.704
6 9 12 15 18
Fig. 11. Contours of the MRR Vs. Pulse-on and current
A: Current
Fig. 13. Contours of the TWR Vs. Pulse-on and current
The discharge current is the most significant factor among all the process parameters. Fig. 12 shows the estimated response surface of an absolute TWR, varying the factors of current den- sity and pulse-on time. As it can be clearly seen in this figure, the wear value tends to increase with increase in the current density factor, after which it tends to decrease. This is due to the fact that increase in discharge current increases the pulse energy that leads to increase in heat energy rate, resulting in wear of both the electrodes. Decrease in TWR at higher current is due to higher wear resistance of the tool due to deposition of carbon on the tool surface. But with the increase in pulse-on time TWR decreases. This is due to decrease in current density of dis- charge channel with increase in pulse-on time duration. The lower value of TWR 0.01 mm3/min is observed with the para- meter combinations of I = 3 A, Ton = 500 μs and Toff = 500 μs. Pulse-off time has a subtle effect on TWR. Fluctuation in TWR is
8 CONFIRMATION EXPERIMENTS
In order to verify the adequacy of the models developed, confirmation experiments were performed within the given range of the process parameters as shown in Table 2. Confir- mation experiments were carried out to validate the models developed for all the responses SR, MRR and TWR with para- meter combinations, which were not used in formulating the models. Five sets of experiments were conducted for different levels of current, pulse-on and pulse-off settings. In order to estimate the accuracy of the prediction models, percentage error and average percentage error criteria were used.
TABLE 13

RESULTS OF THE CONFIRMATION EXPERIMENT
very less over the entire range of pulse-off time. Hence the effect of Toff on electrode wear is almost negligible. Fig. 13 shows the

Response variables

Process parameters % Error
I Ton Toff
effect of I and Ton on the estimated response of TWR. This graph
is very useful in predicting the parameters I and Ton for given value of TWR.

Fig. 12. Response surface of TWR Vs. pulse-on and current
SR 6 750 500 2.66
9 200 200 13.49
12 750 200 6.13
15 200 200 5.88
18 500 200 4.27
Average Prediction Error (%) 6.48

Average Prediction Error (%) 6.78


Average Prediction Error (%) 9.53
IJSER © 2011
http://www.ijser.org
International Journal of Scientific & Engineering Research, Volume 2, Issue 11, November-2011 9
ISSN 2229-5518
Prediction Error (PE) has been defined as follows:
PE (%) = x100 (7) The predicted values and the actual confirmation experimental
values were compared and error and percentage error were
calculated. The results of the confirmation runs for SR, MRR
and TWR are presented in Table 13. Average prediction errors
of these model validations are found to be 6.48%, 6.78% and
9.53% for SR, MRR and TWR respectively. The percentage error on TWR seems to be on slight higher side because the values of
TWR are very small and sometimes even negative.
9 CONCLUSIONS
In the present study, the models for SR, MRR and TWR were developed for most significant process parameters namely dis- charge current, pulse-on time and pulse-off time using response surface methodology in EDM process of EN-8 steel with copper electrode. Machining characteristics of the EDM process are primarily based on thermal conduction phenomenon, thermo- dynamic properties and physical properties of the tool and work. Hence the developed models for SR, MRR and TWR are only valid for EN-8 steel with copper electrode. Confirmation experiments were carried out to check the validity of the devel- oped models. Based on the experimental results, the following conclusions are drawn.
The EDM process has been successfully modeled in terms of SR, MRR and TWR, using a technique of design of experi- ments, combined with the technique of multiple regressions. Thus, time and money consuming experiments can be avoided.
Experimental values of SR, MRR and TWR can satisfactorily
be predicted from experimental diagrams of response sur- faces and contour graphs. Results showed that central com- posite design is a powerful tool for providing experimental diagrams and statistical-mathematical models, to perform the experiments efficiently and economically.
Most influencing factor in case of surface roughness is the
discharge current. For all values of discharge current, sur- face roughness increases with the increase of pulse-on time settings and when pulse-on time is further increased the sur- face roughness decreases. The lower value of surface rough- ness Ra= 3.09 was achieved with process parameters I = 3 A, Ton = 500 μs and Toff = 500 μs within the experimental re- gion. Pulse-off time has shown negligible influence on SR.
The MRR increases linearly with the increase of all values of discharge current. While the MRR value first increases with the increase of pulse-on time up to a specified value of
530μs, however MRR decreases when the pulse-on time is further increased. With increase in pulse-off time, MRR de- creases. Higher value of MRR 32.76 mm3/min is achieved with I = 18 A, Ton = 500 μs and Toff = 200 μs within the expe- rimental range.
Absolute TWR increases nonlinearly as the current density
increases up to 15A after this it starts decreasing for the range of investigation carried out. But with the increase in
pulse-on time, TWR decreases. The lower value of TWR
0.01 mm3/min is observed with the parameter combinations
of I = 3 A, Ton = 500 μs and Toff = 500 μs. For all values of pulse-off time TWR almost remains constant.
The predictions were validated with the experimental re- sults and compared with the developed models. Average prediction errors of these model validations are found to be
6.48%, 6.78% and 9.53% for SR, MRR and TWR respectively.
The percentage error on TWR seems to be on slightly higher side because of very slight variation in the value of TWR and at the same time the absolute value of TWR is also very small. Thus, it can be concluded that with the developed model surface finish, material removal rate and tool wear rate can be controlled on the shop floor.
REFERENCES
[1] Wang Pen-Jen, and Tsai Kuo-Ming , ―Semi-empirical model on work removal and tool wear in electrical discharge machining,‖ Journal of material processing technology, vol. 114, No. 1, pp. 1-17, 2001.
[2] M.R. Shabgard and R.M. Shotorbani, ―Mathematical Modeling of
Machining Parameters in Electrical Discharge Machining of FW4
Welded Steel,‖ World Academy of Science, Engineering and Technology, vol. 52, No. 63, pp. 403-409, 2009.
[3] C.J. Luis and I. Puertas, ―Methodology for developing technological tables used in EDM process of conductive ceramics,‖ Journal of Ma- terial Processing Technology, vol. 89, No. 1-3, pp. 301-309, 2007.
[4] Sushant Dhar, Rajesh Purohit, Nishant Saini, Akhil Sharma & G.H.
Kumar, ―Mathematical modeling of electric discharge machining of cast Al–4Cu–6Si alloy–10wt.% SiCP composites,‖ Journal of Materials Processing Technology, vol. 194, No.1-3, pp. 24–29, 2007.
[5] R. Karthikeyan, P.R. Lakshmi Narayanan and R.S. Nagarazan, ―Ma-
thematical modeling for electric discharge machining of alumi- nium–silicon carbide particulate composites,‖ Journal of Materials Processing Technology, vol. 87, pp. 59–63, 1999.
[6] I. Puertas, C.J. Luis and L. Alvarez, ―Analysis of the influence of EDM parameters on surface quality, MRR and EW of WC-Co,‖ Journal of Material Processing Technology, vol.153-154, No.1, pp. 1026-
1032, 2004.
[7] Jose Marafona and Catherine Wykes, ―A new method of optimizing material removal rate using EDM with copper-tungsten electrodes,‖ International Journal of Machine Tools & Manufacture, vol. 40, No.2, pp. 153-164, 2000.
[8] A. K. M. Iqbal Asif and Ahsan Ali Khan, ―Modeling and analysis of MRR, EWR and Surface Roughness in EDM Milling through Response Surface Methodology,‖ American Journal of Engineering and Applied Sciences, vol. 3, No. 4, pp. 611-619, 2010.
[9] P. Sahoo, Routara B.C. and A. Bandyopadhyay, ―Roughness model-
ing and optimization in EDM using response surface method for different work piece materials,‖ International Journal of Machining and Machinability of Materials, vol. 5, No. 2-3, pp. 321- 346, 2009.
[10] T.A. EI-Taweel, ―Multi-response optimization of EDM with Al-Cu-
Si-TiC P/M composite electrode,‖ International journal of advanced manufacturing technology, Vol. 44, pp. 100-113, 2009.
[11] D. Kanagarajan, R. Karthikeyan, K. Palanikumar and P. Sivaraj,
―Influence of process parameters on electric discharge machining of WC/30%Co composites,‖ Proceedings of the Institution of Mechanical Engineers, Part B: Journal of Engineering Manufacture, vol. 222, pp. 807-815, 2008.
IJSER © 2011
http://www.ijser.org
International Journal of Scientific & Engineering Research, Volume 2, Issue 11, November-2011 10
ISSN 2229-5518
[12] M.K. Pradhan and C.K. Biswas, ―Modeling & analysis of process parameters on surface roughness in EDM of AISI D2 tool steel by RSM approach,‖ International Journal of Mathematical, Physical and Engineering Sciences, vol. 3:1, pp. 66-71, 2009.
[13] M.K. Pradhan and C.K. Biswas, ―Investigations into the effect of
process parameters on MRR in EDM of AISI D2 tool steel by RSM methodology,‖ Journal of Mechatronics and Intelligent Manufacturing, Nova Science Publishers, USA, 2009.
[14] D.C. Montgomery, Design and Analysis of Experiments. Wiley-India,
2007.
[15] Myers, D.C. Montgomery and Anderson-Cook, Response Surface
Methodology. John Wiley-New York, 2009.
IJSER © 2011
http://www.ijser.org