International Journal of Scientific & Engineering Research, Volume 3, Issue 5, May-2012 1
ISSN 2229-5518
Manipulating Standard and Inverse Chladni Patterns by Modulating Adhesive, Frictional, and Damping Forces
Mohit Shridhar
Abstract— Particles on a plate form Chladni patterns when the plate is acoustically excited. To better understand these patterns and t heir possible real-world applications, I present a new analytical and numerical study of the transition between standard and inverse Chladni patterns on an adhesive surface at any magnitude of acceleration. By spatial autocorrelation analysis, I examine th e effects of surface adhesion and friction on the rate of pattern formation. Next, I explore displacement models of particles translating on a fri ctional surface with both adhesive and internal particle-plate frictions. In addition, I find that both adhesion and damping forces serve as exquisite particle sorting mechanisms. Finally, I discuss the possible real-world applications of these sorting mechanisms, such as separating nanoparticles, organelles, or cells.
Index Terms— Inverse Chladni patterns, manipulating patterns, sorting mechanisms, spatial autocorrelation
—————————— ——————————
n 1787, Ernst Chladni showed that sand particles on an acoustically excited metal plate rearrange themselves into esthetic patterns [1]. Ever since, researchers have been using Chladni patterns to study standing waves and other harmonic behaviors [2]. The resonance of a horizontal plate deflects the sand particles away from the antinodes of the vibration, lead- ing to the formation of patterns at the nodes. Recently, expe- riments on inverse Chladni patterns [3], [4] (i.e., particles col- lecting at the antinodes of an oscillating plate) have revealed a new area of research. In addition, both nodal and antinodal Chladni patterns have been observed in microparticles and nanoparticles [5]; these patterns effectively position and sort
such particles.
In this study, I examine the effects of adhesion, friction, and
damping on the development of Chladni patterns, and suggest
real-world applications for these effects. It has been showed that by manipulating the vibrational acceleration of the plate around the critical value g, it is possible to switch between
nodal and antinodal patterns [3]. In my simulations, I replicate this effect using adhesion. This study also explains the me- chanics of the particle sorting process, which can be controlled by adhesion and damping. In addition, I use spatial autocorre- lation analysis to explore the effects of adhesion and frictional forces on the rate of pattern formation. Primarily, I present analytical explanations of these phenomena, and then verify them with numerical simulations.
For centuries, researchers have attempted to develop a model to predict Chladni patterns. Several attempts were based on deriving a relationship between the number of diametric (li- near) nodes and the frequency of oscillation [6]. To create
————————————————
![]() Mohit Shridhar is an independent researcher in the field of Condensed
Mohit Shridhar is an independent researcher in the field of Condensed
Matter Physics living in Beijing, China. E-mail: mohit.sridhar@gmail.com
more accurate models, researchers analyzed the mathematics of the vibrating plate instead of directly studying the nodal regions [7], [8]. The vertical deflection function of an acousti- cally excited plate oscillated to one of its natural resonant fre- quencies ωkl corresponds to the integral count of the sinusoidal half wavelengths in the x-direction k and y-direction l:![]()
(1) where a is the amplitude, Lx is the length of the plate and Ly is its width.
Despite the popularity of standard Chladni patterns, inverse Chladni patterns are relatively obscure. Gerner et al. has ana- lyzed and numerically simulated the conditions for particles to collect at the antinodes, forming Inverse Chladni patterns [3]. Conventionally, inverse Chladni patterns were assumed to be induced by only small particles that were carried through air currents [9], [10], [11], [12]. However, Gerner et al. showed that when the vibrational acceleration of the plate is below g, the particles stop bouncing and remain in contact with the surface [3]. As a consequence, the particles translate toward the antinodes irrespective of the influence of air currents. They also discussed the experimental constraints of producing in- verse Chladni patterns: the structure of the plate must be per- fectly horizontal, and a minimum frictional force is required to start the particles in a rolling motion [3]. The acceleration of a particle (from its center of mass) moving toward the antinode at a given time t is acm(x, y, t) = W||(x, y, t) / m, where W|| is the parallel weight of the particle relative to the surface.
IJSER © 2012
International Journal of Scientific & Engineering Research, Volume 3, Issue 5, May-2012 2
ISSN 2229-5518
Despite Spatial autocorrelation is a geographical tool used to analyze a variable’s degree of dependence on its proximal lo- cations. A typical method of quantifying a pattern’s spatial autocorrelation is to calculate its Moran’s I value. A Moran’s I value close to +1.0 indicates clustering and that close to –1.0 indicates dispersion [13]; a Moran’s I value equal to 0 indicates pure randomness, i.e., no spatial autocorrelation. In this study, for analyzing the effect of adhesive and frictional forces on Chladni patterns, spatial autocorrelation values are used to quantify the amount of particle clustering caused by accelera- tions and other forces acting on the particles. Next, the effect of these forces on the rate at which patterns form is analyzed using Moran’s I values.
All numerical simulations that were analyzed for spatial auto- correlation involved particles initially positioned in a grid-like structure before the plate was allowed to oscillate. Hence, hy- pothetically, as patterns start to form, the Moran’s I value should gradually increase. However, Moran’s I values do not indicate whether the patterns are in standard or inverse form. These values also do not represent the degree of similarity between the subject pattern and the nodal lines of the vibrat- ing plate. In other words, Moran’s I values do not measure how similar a pattern is to the ideal Chladni pattern that could be formed under such conditions.
The numerical simulations consisted of a dynamic mesh, whose form was based on Eq. 1 at a given natural frequency and time. Spherical particles of 5 cm diameter and 1 kg mass were used instead of dust particles; large size and mass of par- ticles were chosen to disprove the previous assumption that inverse patterns form only with small dust particles. To ac- commodate these large particles, the dimensions of the plate were set as Lx = Ly = 10m. The number of particles varied from
225 to 10,000. The particles were positioned in a grid-like structure (e.g. 100 × 100) on the resting position of the plate at t = 0. Numerical computing software packages MATLAB and Mathematica were used to simulate the dynamics of the oscil- lating mesh [14], and an external physics engine was used to calculate the body dynamics. The physics engine was opti- mized for particle–particle and particle–plate collisions.
The simulated plate is completely horizontal; therefore, it does not contain any pre-made deformations, unlike a real plate. In addition, despite the massive 1 kg particles and the extensive area of the plate in these simulations, neither the plate’s posi- tion nor its acceleration is affected in any manner by particle– plate collisions or by its own weight. Furthermore, these simu- lations contained the following: oscillating plates with dimen-
sions of 10m × 10m, perfectly uniform surface adhesion, inter- nal friction, and damping coefficients. The particles used in the simulations were also perfectly spherical and identical in size. Virtual experiments were performed in a vacuum to eliminate the effect of air currents on the particles. Because of the technical and financial constraints of controlling the condi- tions mentioned above, numerical simulations were per- formed instead of experiments.
The effects of two types of friction, sliding and rolling fric- tions, on the formation of inverse Chladni patterns are studied here. However, for conciseness and simplicity, only sliding friction is used in the numerical simulations. In later sections, I analytically explore the effects of both of these forces.
Chladni patterns have mostly been studied after the particles have formed a clear, definite shape. The rate of Chladni pat- tern formation reflects the influences of the forces acting on the particles. Thus, to determine the rate of pattern formation, I use spatial autocorrelation analysis as a quantifiable measure of the amount of particle clustering; this then allows me to attain an overview of the effects of adhesive and frictional forces.
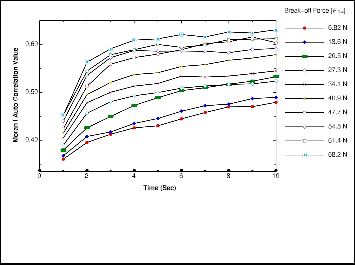
Fig. 1. Effect of adhesion on the rate of pattern formation: Moran’s I values of patterns formed from 1 to 10 s for various values of the break-off force (simulation parameters: μi = 0.1, f = 9 Hz, and 10,000 particles).
Figure 1 shows the effect of adhesion on the clustering of par- ticles that were initially in a dispersed position (100 × 100 grid). The break-off force (FN,Z) is the minimum amount of force required to eject a particle from the surface of the plate as a result of its acceleration. Uniform increments in FN,Z, re- sulted in a steady increase in the initial rate of clustering; however, note that spatial autocorrelation analysis does not account for the number of particles involved in the clustering or for the number of slowmoving and stationary particles. The patterns were also found to quickly settle within a certain range of Moran’s I values. At lower values of FN,Z, particle movements are more chaotic, because the adhesive force has only a limited effect on them; therefore, the Moran’s I values
IJSER © 2012
International Journal of Scientific & Engineering Research, Volume 3, Issue 5, May-2012 3
ISSN 2229-5518
are closer to 0. At higher values of FN,Z, particle movements are highly constricted, because the adhesive force has a strong effect on them; therefore, the Moran’s I values are farther from
0 (in the positive direction).
Figure 2 shows the effect of friction on the clustering of par- ticles that were initially in a dispersed position (100 × 100 grid). The effect of friction is only applicable to sliding or roll- ing particles (in this case, sliding particles); therefore, the re- sults in Fig. 2 were produced under complete inverse Chladni pattern conditions, where no particles were ejected from the surface because of the acceleration of the plate. FN,Z was kept constant at 6.82 N, and the coefficient of internal particle–plate friction (i.e., the Coulomb friction coefficient) was uniformly increased from 0.1 to 0.8. The results obtained from the simu- lation differed slightly from those obtained from the adhesion control test. The Moran’s I values at t = 1s were almost iden- tical for all values of μi , and the settling values were delayed until particles formed compact structures at the antinodes. The acceleration of the particles decreased as the frictional force increased; consequently, the rate of clustering was inversely proportional to μi.![]()
(2) By adding the particles’ acceleration due to gravity g to Eq. 2,
it is possible to obtain the vertical weight W for a given mass m:
W (x, y, t) = - m[ g - z(x, y, t)] =
![]()
![]()
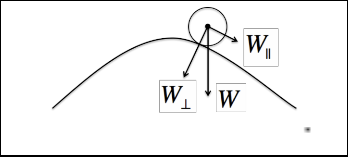
(3) Because of the dynamic nature of the plate, particles are sub- jected to plate-parallel W|| and plate-perpendicular W forces (Fig. 3), which are partial components of the W vector.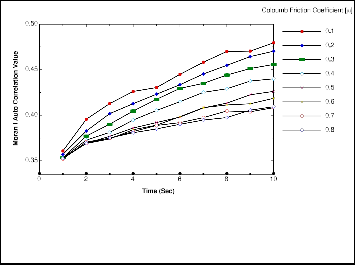
Fig. 3. Weight W of a particle and its components (W|| and W ) when it is in contact with a surface.
Next, we must determine plate-parallel and frictional forces. To calculate W|| we need to know the slope of the plate for z(x, y, t). This can be obtained by multiplying W with the
gradient of Eq. 1:
dz(x, y, t) dz(x, y, t) dz(x, y, t)
Fig. 2. Effect of friction on the rate of pattern formation: Moran’s I val- ues of patterns formed from 1 to 10 s for various values of the Co u- lomb friction coefficient (simulation parameters: FN,Z = 6.82N, f = 9 Hz and 10,000 particles).
![]()
W|| (x, y, t) = W (x, y, t) dx dy
dt
(4)
In this section, I examine the combined effects of adhesion and internal friction on the surface-parallel displacement of the particles. The internal frictional force, Ff is the resisting force acting against a sliding particle on a surface. Two types of fric- tion are studied here: sliding and rolling frictions (the latter is studied only analytically).
First, we need to look at the forces that cause particles to trans- late on an oscillating surface. For all particles in contact with the vibrating surface, the vertical position at any given point can be derived from Eq. 1. Using the second derivative of Eq.
1, we can find the vertical acceleration of particles at any given time:
The frictional force Ff acting against W|| is the combined effect
of the adhesive force and the internal particle-plate friction. This combined effect was studied by Tomas [15], and the fric- tional force acting against a sliding particle was found to be:![]()
Ff = μi [FN +FH (FN)]
![]()
(5) where μi is the Coulomb friction coefficient, FN is the normal force acting perpendicularly to the plate, and FH is the adhe- sive force at (x,y,t). Although it is possible to calculate FN di- rectly by using the gradient function in Eq. 4, for simplicity I use FN = −W = −[W (x, y, t) – W||(x, y, t)], because it involves simple vector addition. During the oscillations, the adhesive force counteracts with force exerted by the plate; this force due to acceleration Facc is dynamic and is given as ≈ −FH = −W ;
IJSER © 2012
International Journal of Scientific & Engineering Research, Volume 3, Issue 5, May-2012 4
ISSN 2229-5518
however, this is only true for W < FN,Z , where FN,Z is the break-off force; thus particles are ejected if this limit is ex- ceeded [16]. In addition, the rolling friction can be calculated in a similar manner [15]:![]()
Ff = μr [FN +FH (FN)]
tions of the simulator. The simulator’s physics engine treats the plate as a dynamic mesh and breaks the area into a 14 × 14 grid to optimize the computational speed. Therefore, as the number of particles increases above 14 × 14, the precision of their positions decreases.
where we substitute the rolling friction coefficient μr for μi.
(6)
So far, I have explored the frictional effects of adhesion. Now,
Now that we have formulated plate-parallel and frictional forces, we can combine them to determine the surface-parallel acceleration of a particle. For a given particle of mass m, its acceleration (from its center of mass) acm is given by W|| (x, y, t)
/ m. Therefore, its acceleration after implementing the sliding frictional force is:
W|| (x, y, t) - ' ui [FN + FH (FN )]
I directly examine the contact forces acting between the plate and the particles. Oscillatory methods of measuring the break- off force (due to adhesion) have been previously reported [16]. The concept is similar to the dynamics of stress-based removal of particles from a surface (pulling a particle away from the plate), except that in oscillations, the pulling stress is provided by the acceleration of the plate.
From the previous section, we have seen that Facc is given as ≈![]()
acm = m
−FH
= −W(x, y, t), where FH
(for W < FN,Z
) acts in the same di-
(6) Similarly, the rolling friction can be calculated by replacing μi with μr.
To confirm Eq. 7, a numerical simulation was performed (see Fig. 4). A 1 × 1 mode was setup at ωkl = √2/2 (one of the natu- ral frequencies). The average surface-parallel acceleration of the particles over a complete cycle was calculated by integrat- ing Eq. 7 from 0 to 2π/ωkl. Then, the average acceleration was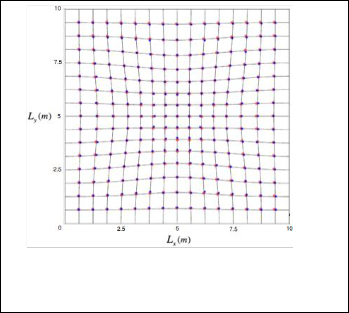
used to predict the position of the particles after 8 s.
rection as W. This effect is also responsible for keeping the particles in contact with the plate. For all regions on the plate with Facc > FN,Z , the resultant force ejects the particles away from the plate; for all regions with Facc ≤ FN,Z, the particles stay in contact with the surface. Therefore, an inequality can be derived to express the area (AE) where the particles are ejected:
Fig. 4. Particle displacement for μi = 0.1. The red dots at the points of intersection in the 17 × 17 grid show the positions of particles pr e- dicted using Eq. 7 after 8 s. The blue dots show the positions of par- ticles obtained from the numerical simulation.
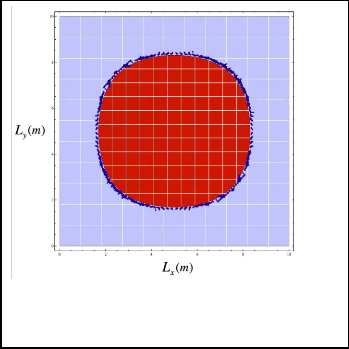
Fig. 5. Particle ejection area (red). The blue dots surrounding the red area show the particle positions obtained from the numerical simul a- tion. Stationary particles in the light blue region were ignored in the figure.
The correlation between the predicted and simulated positions is very good. However, a few particles slightly deviated from their predicted positions. This is possibly due to the limita-
IJSER © 2012
AE = - W (x, y, t) - FN,Z > 0
(8)
International Journal of Scientific & Engineering Research, Volume 3, Issue 5, ISSN 2229-5518
A numerical simulation (see Fig. 5) was performed to confirm Eq. 8. The 1 × 1 mode setup from Section 4.2 was replicated, and a total of 2,500 particles were used. The friction coefficient of the surface was set to its maximum. Because of the ejection mechanism and the high friction coefficient, only particles in the ejection area (red in Fig. 5) will bounce off the plate; par- ticles in the contact area (light blue in Fig. 5) will have no dis- placement, because they are restricted to neither bounce nor slide as a result of the strong adhesive and frictional forces acting on them. The boundary formed between the ejection area and the contact area in the numerical simulation accurate- ly delineates the particle ejection area.
Experimentally replicating this simulation is challenging,
because it is difficult to simultaneously achieve a low adhesive break-off force and a high frictional force. However, at sub- stantial accelerations and frictional coefficients, it is possible to sustain a slow translation of particles in the contact area that allows enough time to completely eject all particles in the ejec- tion area, which leads to an effective area-based sorting me- chanism. This concept corresponds to the results of the spatial autocorrelation analysis where the particles’ movements be- come less chaotic as FN,Z increased. Note that an increase in FN,Z causes the ejection area to decrease (Eq. 8); thus, more particles are constricted to surface-parallel translation and subjected to a stronger resistive frictional force. As a result of the increased resistive force, the particle movements are less chaotic, which leads to higher Moran’s I values.
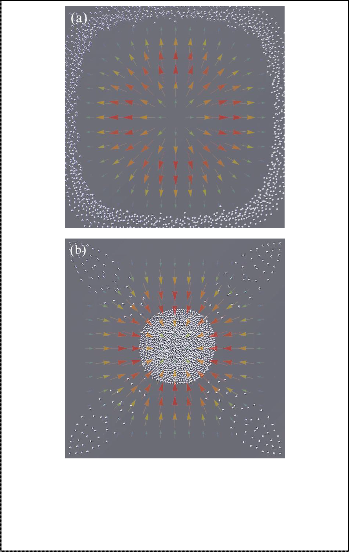
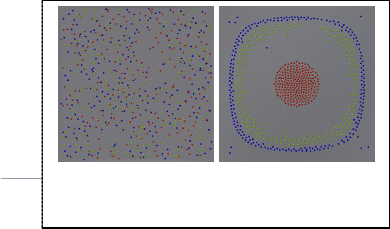
Gerner et al. switched between standard and inverse Chladni patterns by manipulating the acceleration of the plate [3]. Switching between these two types of patterns can also be achieved by applying uniform adhesion across the surface. In the accelerationbased control method, the critical value for shifting between the two types of patterns was determined by g, which is the acceleration due to gravity. In actual experi- ments, controlling the break-off force FN,Z due to adhesion might be more preferable than controlling g, because it pro- vides more technical flexibility. However, uniform adhesion across the surface must be maintained; otherwise, some par- ticles might not follow Eq. 8. The numerical simulations shown in Figs. 6a and 6b were performed under identical con- ditions, except that the surfaces had different FN,Z values. The critical FN,Z value that enables alternating between standard and inverse Chladni patterns can be determined by FN,Z criti- cal = Γm, where Γ is the peak acceleration of the plate (Γ = aω2) and m is the particle mass. Figure 6 clearly shows the effects of setting the break-off force value below and above its critical
Fig. 6. Using adhesion to alternate between standard and inverse Chladni patterns. The position of particles is shown at t = 100 s. (a) FN,Z = 1N standard pattern of collection at the nodes. (b) FN,Z = 50N inverse pattern of collection at the antinodes. Simulation parameters:
1 × 1 mode, 10,000 particles, ωkl = √2/2 and Γm = FN,Z critical =
19.74N.
value.
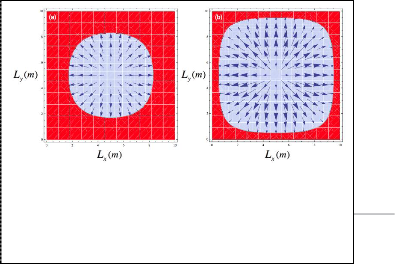
To understand the reason for the particles to move toward the antinodes when Facc < FN,Z , we must understand the relation between gravity and adhesion. Let us consider a scenario where g is the critical value. If the vibrational acceleration of the plate is lower than g, at some points in the cycle, particles will accelerate upward, thus |W| > mg; at other points in the cycle, particles will accelerate downwards, thus |W| < mg. If this variation in |W| is averaged over the cycle, the direction of the resultant force is toward the antinodes. In the case of adhesion, the adhesive force can be thought of as a substitute for the gravitational force: it pulls the particles down and keeps them in contact with the plate. Therefore, whenever a particle is in contact with the oscillating surface, a consistent force is applied toward the antinodes. Furthermore, this effect occurs regardless of the force responsible for maintaining sur- face contact. For further proof of this effect, I calculate the plate-parallel force W|| on the particles as the plate’s accelera- tion a (given by Eq. 7) approaches infinity as follows:![]()
(9) Gravity has been ignored for simplicity. Note that Eq. 9 al-
IJSER © 2012
International Journal of Scientific & Engineering Research, Volume 3, Issue 5, May-2012 6
ISSN 2229-5518
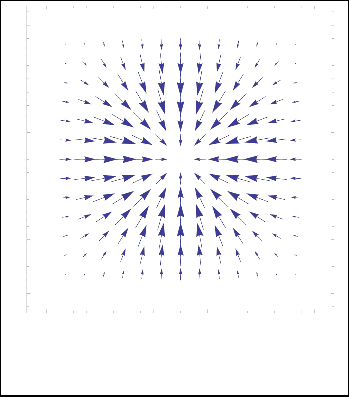
ways gives a positive value of W|| , which indicates that the particles move toward the antinodes. Figure 7 is a vector plot indicating the direction of the particles’ acceleration for Eq. 9. As indicated by the arrows, the particles move toward the an- tinodes even under extreme circumstances. Note that this ef- fect occurs only when particles are in contact with the surface. However, in reality, at extreme accelerations the particles will be forcibly ejected from the surface instead of sliding on it.
Damping is a form of friction that reduces the amplitude of an oscillation. However, in the case of Chladni patterns, damping does not affect sliding or rolling particles. In this study, damp- ing refers to viscous damping caused by the surface chemi- stries of the plate and particles; it does not refer to frictional damping affecting the oscillation of the plate. The damping force exerted during a particle–plate collision can be modeled with Fd = −cv, where c is the viscous damping coefficient and v
cient proportionally reduces the resulting particle velocity by absorbing more of the force applied by the oscillating plate. If there is sufficient damping force, i.e., the break-off force is greater than the applied force, then the particle will not bounce at all, and instead it will temporarily stick to the sur- face (if the surface is uniformly adhesive) until the force ex- erted by the plate (later, at a certain point during the oscilla- tion) is greater than the break-off force including the effect of viscous damping.
Figure 8 presents the results of a simulation performed at
ωkl = 3 Hz. The number of particles adhered to the surface at t
= 5s drastically increased with c up to 0.2; however, in the
range 0.2 < c ≤ 1.0, the count either increased by a minute amount or remainded unchanged. At high damping coeffi- cients, most of the particles remain in contact with the surface and cluster at the antinodes. In addition, high damping forces also reduce the number of particles that are completely ejected from the plate. To summarize, damping does not directly af-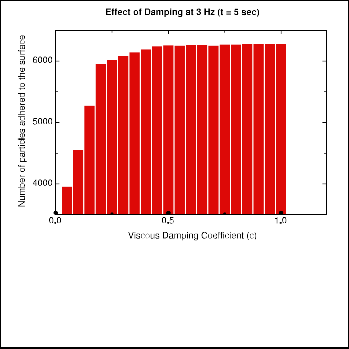
10
8
6
4
Fig. 8. Effect of damping on the number of particles adhered to the
2 surface. Both temporarily attached and permanently attached par- ticles (due to adhesion and damping) were included in the count. The
simulation was initiated with 10,000 particles. Other particles from the y-axis count either bounced (they were temporarily ejected) or were completely ejected from plate. Simulation parameters: FN,Z = 6.82N,
0 and μi = 0.1.
0 2 4 6 8 10
Fig. 7. Direction of the particles’ acc eleration when in contact with the oscillating surface as the plate’s acceleration approaches infinity. Simulation parameters: 1 × 1 mode produced on a 10(m) × 10(m) plate.
is the velocity of the particle before the collision. For bouncing particles, it is very difficult to predict v; therefore, I study only the direct effects of the coefficient c, and do not calculate the damping force involved in collisions.
When a bouncing particle hits a vibrating plate, the particle’s resulting velocity depends on the velocity of the plate (upon impact), the particle’s velocity before collision, and the viscous damping coefficient. Increasing the viscous damping coeffi-
IJSER ©
http://www.i
fect the type of Chladni pattern formed; however, it is a con- tributing factor in keeping the particles in contact with the surface, which (as seen in Section 5.4) is crucial for inducing inverse Chladni patterns.
(a)D (b)D
Fig. 9. Numerical simulation of a sorting mechanism based on the particle-damping coefficient c. The particles had the following values of c: 0.1 (blue), 0.5 (green), and 0.9 (red). (a) Initial random positions of the particles. (b) Positions of the particles after 150 s
International Journal of Scientific & Engineering Research, Volume 3, Issue 5, May-2012 7
ISSN 2229-5518
In Section 5.2, I explored how adhesion can be used as an area- based sorting mechanism. Similarly, particle damping can be used as a sorting mechanism. Thus far, I have studied the ef- fect of the plate-damping force on bouncing particles. Now, I study the effect of the particle-damping force: the particle it- self absorbs the collision energy through mechanical proper- ties such as elasticity. If a particle system contains groups of particles with unique particle-damping coefficients, then this concept can be exploited to sort the particles into sets of simi- lar kind. To verify this concept, a numerical simulation was performed with three different particle groups each having a different value of the particle-damping coefficient (Fig. 9a).
As seen in Fig. 9b, the particles were effectively sorted based on the value of their particle-damping coefficients. At lower values of the particle-damping coefficient, the particles tend to cluster closer to the nodes, whereas at higher values, the particles tend to cluster closer to the antinodes. Note that this trend is quantitatively nonlinear: an increase in the value of c from 0.1 (blue) to 0.5 (green) resulted in a small change in the cluster’s position, whereas a proportionate increase in the value of c from 0.5 (green) to 0.9 (red) resulted in a large change in the cluster’s position.
To understand how this sorting mechanism works, we need to look at the two forces that might act on a particle: the force on a bouncing particle due to the acceleration of the plate and the resultant force on a particle in contact with the surface due to the plate’s average acceleration. These two forces can act simultaneously only if the surface contains a definite ejec- tion area (Section 5.1). Furthermore, these two forces are also responsible for determining the position of the cluster. By changing the particledamping coefficient, the boundary be- tween the ejection area and the contact area can be manipu- lated. This effect is illustrated in Fig. 10; the increase in the ejection area (light blue) from Fig. 10a to Fig. 10b is a direct result of the decrease in the particles’ damping coefficients. At high particle-damping coefficients, the particles absorb more of the force exerted by the plate (Facc). Here the damping force Fd opposing Facc is sufficient to prevent the particles from bouncing (i.e., ejection), even if the particles reside in the ejec- tion area (some regions only). Therefore, Eq. 8 becomes:
AE = - W (x, y, t) + Fd - FN,Z > 0.
(10) The increase of Fd in Eq. 8 results in a smaller ejection area. In
Fig. 10. The effect of particle damping on the force (blue vectors) ex- erted on a bouncing particle within the ejection area (light blue). a)
contrast, the contact area (red regions in Fig. 10) of particles increases; hence, the particles move closer to the antinodes.
This sorting mechanism lacks efficiency: as seen in Fig. 9b, not all particles have been sorted into their groups. As the par- ticles translate, they collide with their own kind (e.g., two blue particles collide) and others (e.g., a blue particle collides with a red one). Under some circumstances, it is possible for particles to get fixated between clusters formed by other particles. The particle-damping dynamics in the simulations were based solely on mathematical models of damping properties; how- ever, for real-world applications, mechanical properties such
as deformation and elasticity must be carefully studied. In an experiment, the damping coefficient can be related to the elas- ticity of the particles, where energy is dissipated through tem- porary compression. The temporary compression of a particle results in a spring action (rapid expansion) when the force compressing it changes direction; however, some of the ener- gy is lost during the compression and expansion in the form of heat. More elastic materials will expand and contract in great- er amounts; hence, hysteresis will increase, thereby dissipating more heat (although the difference might be exceptionally small), and thus, they are more likely to remain in contact with the surface. Therefore, a sorting mechanism experiment will result in a small difference between the cluster positions of particle groups when compared to the elegant delineations seen in Fig. 9b. Finally, an experiment would need to take into account the external forces affecting the displacement of the particles, such as air drag.
In the past, the modal phenomenon of Chladni patterns main- ly influenced areas of art with its complex and dynamic fea- tures. Recently, however, the properties of Chladni patterns have been exploited to create new sorting mechanisms (even on the scale of nanoparticles) that might have scientific and industrial applications. Dorrestijn et al. has experimentally proven that this spatial autocorrelation phenomenon can be used as a size-based sorting mechanism: nanoparticles are moved toward either the nodes or the antinodes, based on their size [5]. In my study, I have presented possible methods of area-based and particle-damping-based sorting mechan- isms. These mechanisms can be collectively used to sort par- ticles, organelles, or cells. Dorrestijn et al. also suggested the use of such systems in patterning applications, where particles can be fixed using laser curing or photo-polymerization [5]. Once the particles have attained the desired position, the liq- uid can be removed, and then the patterns can be transferred to a chip surface by nanotranfer printing [17], [18]. All numer-
Forces experienced by particles with high damping coefficients. (b) Forces experienced by particles with low damping coefficients. These vector plots are just illustrations, and the difference between the ejec- tion areas has been exaggerated; this figure is used only for qualit a- tive analysis.
R © 2012
ww.ijser.org
International Journal of Scientific & Engineering Research, Volume 3, Issue 5, May-2012 8
ISSN 2229-5518
ical simulations in this study were performed on a 10m × 10m oscillating plate; this presents new possibilities of using Chladni patterns in large-scale applications such as industrial processes.
Perhaps one of the most promising applications of this re- search could be in sorting cancer cells. Suresh studied the biomechanical characteristics that differentiate mutated cells from benign cells. Recent findings show that lung, breast, and pancreatic metastatic cells are 70% softer than benign cells [19]. Such distinctive elastic properties can be utilized with the particle-damping sorting mechanism (see Section 6.2) to effec- tively separate cancer cells from normal cells. Researchers have also found correlations between various stages (intensi- ties) of cancer and the biomechanical properties of the affected cells [20]. Hence, sorting mechanisms cannot only be used in the identification but also in the classification of various stages of cancer, which might be helpful in monitoring the progress of treatments. Using Chladni patterns as a sorting system is highly advantageous because it requires minimal data analysis and it uses simple, cost-effective equipment. However, further detailed investigations are necessary to confirm sorting me- chanisms using Chladni patterns.
In this study, I have presented both quantitative and qualita- tive effects of adhesive, frictional, and damping forces on Chladni patterns. The friction-based surface displacement model effectively predicted the position of a particle accelerat- ing toward an antinode. The ejection-area model successfully replicated the region in which particles broke away from the surface, despite the adhesive force. Both the area-based and the particle-damping-based sorting mechanisms effectively separated particles that have distinct characteristics. In addi- tion, the results of the spatial autocorrelation analysis were consistent with the models of Chladni patterns studied here. In future, these models should be experimentally verified, and external factors such as air drag, temperature, and deforma- tions of the plate and particles should be investigated.
[1] D. Ullmann. Life and work of e.f.f. chladni. The European Physical Journal
Special Topics, 145:27, 2007. 10.1140/epjst/e2007-00145-4.
[2] C. Gough. The violin: Chladni patterns, plates, shells and sounds.
The European Physical Journal Special Topics, 145:77–101, 2007.
10.1140/epjst/e2007-00149-0.
[3] H. Gerner, M. Hoef, D. Meer, and K. Weele. Inversion of chladni patterns by tuning the vibrational acceleration. Phys. Rev. E,
82:012301, Jul 2010.
[4] Henk Jan van Gerner. Newton vs Stokes : competing forces in granu- lar matter. PhD thesis, Enschede, April 2009.
[5] M. Dorrestij![]()
![]()
![]() cıkal ın, A. Raman, M. Hegner, E.
cıkal ın, A. Raman, M. Hegner, E.
Meyer, and Ch. Gerber. Chladni figures revisited based on nanome- chanics. Phys. Rev. Lett., 98:026102, Jan 2007.
[6] R. Thomas. Chladni’s law for vibrating plates. American Journal of
Physics, 50:271–274, March 1982.
[7] Lenoard Meirovitch. Analytical Methods in Vibrations. Prentice Hall,
1967.
[8] Wence Xiao. Chladni pattern. Basic studies in Natural Sciences, RUC, May 31 2010.
[9] Micheal Faradray. On a peculiar class of acoustical figures. Phil o- sophical Transactions, 121:299–340, January 1 1831.
[10] L. Rayleigh. On a peculiar class of acoustical figures; and on certain forms assumed by groups of particles upon vibrating elastic surfaces. Philosophical Transactions, 175:1–21, January 1 1884.
[11] Mary D Waller. Air circulations about a vibrating plate. British Jour-
nal of Applied Physics, 6(10):347, 1955.
![]()
[12] ![]()
![]() cıkal ın, A. Raman, M. Hegner, E.
cıkal ın, A. Raman, M. Hegner, E.
Meyer, and Ch. Gerber. Chladni figures revisited based on nanome- chanics. Phys. Rev. Lett., 98:026102, Jan 2007.
[13] D. A. Griffith. Spatial autocorrelation. University of Texas at Dallas, Richardson, TX, USA, 2009.
[14] H. Wilson, L. Turcotte, and D. Halpern. Advanced Mathematics and Mechanics Applications Using MATLAB. Chapman and Hall/CRC, 3 edition, 2003.
[15] ![]() rgen Tomas. Mechanics of particle adhesion. Mechanical Process Engineering, Department of Process Engineering and Systems Engi- neering.
rgen Tomas. Mechanics of particle adhesion. Mechanical Process Engineering, Department of Process Engineering and Systems Engi- neering.
[16] S. Ripperger and K. Hein. Measurement of adhesion forces in air with the vibration method. China Particuology, 3(1-9), 2005.
[17] T. Kraus, L. Malaquin, E. Delamarche, H. Schmid, N. D. Spencer, and H. Wolf. Closing the gap between self-assembly and microsystems using self-assembly, transfer, and integration of particle. Advanced Materials, 17:2438–2442, 2005.
[18] S. Hur, D. Khang, C. Kocabas, and J. Rogers. Nanotransfer printing by use of noncovalent surface forces: Applications to thin-film tran- sistors that use singlewalled carbon nanotube networks and semi- conducting polymers. Applied Physics Letters, 85(5370):3, July 30
2004.
[19] S. Cross, Y. Jin, J. Rao, and J. Gimzewski. Nanomechanical analysis of cells from cancer patients. Nature, 2:780–783, December 2 2007.
[20] A. Ketene, E. Schmelz, P. Roberts, and M. Agah. The effects of cancer progression on the viscoelasticity of ovarian cell cytoskeleton struc- tures. Nanomedicine, June 6 2011.
————————————————
Mohit Shridhar is an independent researcher in the field of Condensed Ma tter
Physics living in Beijing, China. E-mail: mohit.sridhar@gmail.com
IJSER © 2012