International Journal of Scientific & Engineering Research, Volume 3, Issue 6, June-2012 1
ISSN 2229-5518
Multi-Parameter Analysis and Modeling of Surface Roughness in Electro Discharge Machining of AISI D2 Steel
B B PATEL, K B RATHOD
—————————— ——————————
Electrical discharge machining (EDM) is a non-traditional manufacturing process based on removing material from a part by means of a series of repeated electrical discharges (created by electric pulse generators at short intervals) between a tool, called the electrode, and the part being machined in the presence of a dielectric fluid. At present, EDM is a widespread technique used in industry for high- precision machining of all types of conductive materials [1]. The working principle is based on the thermo electric energy. The thermo electric energy (in form of spark) is created between a workpiece and an electrode submerged in a dielectric fluid with conduction of electric current. The workpiece and the electrode are separated by a specific small gap, the so called ‘spark gap’, and pulsed discharges occur in this gap filled with an insulating medium [2]. During machining, the discharge energy produces very high temperature at the point of the spark on the surface of the workpiece, and removes the material by melting and vaporization. The top surface of workpiece resolidifies and cools subsequently at very high rate. This process leads to the slightly dimpled surface (i.e. increasing surface roughness), which facilitates crack initiation on the surface. After electrical discharge treatment, high tensile residual stresses often induce damage such as micro-cracks or pinholes in the surface layer, reducing its strength. Y.H. Guu et al. [3] proved that AISI D2 steel coated by TiN exhibited considerably increased hardness, a better surface finish, and decreased superficial tensile residual stress, or added compressive residual stress on the surface, increasing their fatigue limit. Y.H. Guu et al. [4]
————————————————
![]() B B Patel is currently Assistant Professor in Sankalchand Patel college of
B B Patel is currently Assistant Professor in Sankalchand Patel college of
Engineering, Visnagar, India, Email: bbpatel.mech@spcevng.ac.in
![]() K B Rathod currently Assistant Professor in Faculty of Engineering
K B Rathod currently Assistant Professor in Faculty of Engineering
Technology and Research, Bardoli, India. E-mail: Rathod_kb@yahoo.co.in
further studied the effect various machining parameters on SR of AISI D2 steel. Experimental results indicate that the thickness of the recast layer, and surface roughness are proportional to the power input. Y.H. Guu et al. [5] studied the three-dimensional images of AISI D2 tool steel machined by the EDM process was analyzed by means of the atomic force microscopy technique. The AFM study of the surface morphology of the EDM specimen has revealed that higher discharge energy results in a poorer surface structure. To avoid excessive machined damage, low discharge energy should be used. M. K. Pradhan and C. K. Biswas et al. [6, 7] developed regression model and two artificial neural networks (ANNs) namely: Back propagation and radial basis function to predict surface roughness in electrical discharge machined surfaces. S. Prabhu and B.K. Vinayagam et al. [8] used single-wall carbon nano tube mixed with dielectric fluids in EDM process to analysis the surface characteristics like surface roughness, micro cracks in AISI D2 tool steel a work piece material which is very much used in moulds and dies. An excellent machined nano finish can be obtained by setting the machine parameters at low pulse energy.
A number of experiments were conducted to study the effects of various machining parameters on EDM process. These studies were undertaken to investigate the effects of various machining parameters on surface roughness. The selected workpiece material for the research work is AISI D2 tool steel. D2 steel was selected due to its emergent range of applications in the field of manufacturing tools in mould industries. During the heat treatment, the material was heated to 1030 0C at a heating rate of 20 0C min-1. Then, the material was held at
1030 0C for 1 h and was quenched. After quenching, the
specimens were tempered at 350 0C for 2 h and then air
IJSER © 2012
International Journal of Scientific & Engineering Research, Volume 3, Issue 6, June-2012 2
ISSN 2229-5518
cooling. Experiments were conducted on JOEMARS Z 50 JM-
322 die sinking machine using reverse polarity. The flushing
pressure was 0.5 Kg/cm2. The copper with a diameter of 15
mm was used as a tool electrode and Die-electric fluid-92 (DEF-92) was used as die electric fluid. The test conditions are depicted in Table-1.
In present analysis surface roughness is measured on a mitutoyo make portable digital surface finish tester (model: surftest set no: 178-923e).
RSM is a collection of mathematical and statistical techniques that are useful for modeling and analysis of problems in which the response of interest is influenced by several variables and objective is to optimize this response [9]. The central composite rotatable design (CCRD) is useful than full factorial designs, since it requires much fewer tests and shown to be sufficient to describe the responses [10]. Thus, CCRD was chosen to determine the relationship between four operating variables namely, pulse current, pulse on-time, pulse off-time and spark gap voltage. In order to study the effects of the EDM parameters on the above mentioned machining criteria, second order polynomial response surface mathematical models can be developed. In the general case, the response surface is described by an equation of the form:
a distance c = k1/2 from the centre point of the design to a star point and no parameter means the number of centre points at the origin and can be get from tables according to the number of independent variables [11].
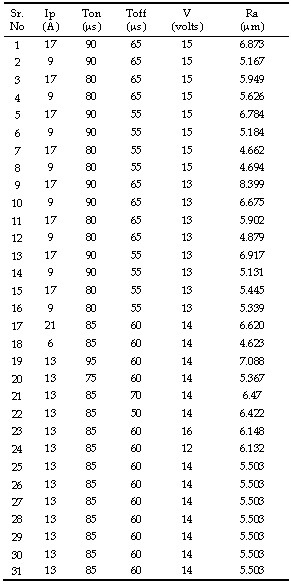
In this case k = 4 and thus nc = 2×k = 16 corner points at ±1 level, na = 2×k = 8 axial points at c = ±2, and a centre point at
zero level repeated 7 times (no). This involves a total of 31
experimental observations. The coded levels for all process
parameters used are shown in Table-1.
TABLE 1
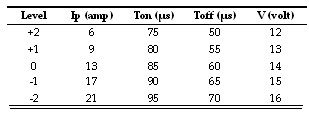
CODING LEVELS OF PROCESS PARAMETERS
![]()
k
Y 0 i xi
i 1
![]()
k
ii xi
i 1
![]()
2
i j 2
ij xi x j ![]() r
r
Where Y is the corresponding response,
X i is the input
variables, X 2i and
X i X j
are the squares and interaction terms,
respectively, of these input variables. The unknown regression
coefficients are![]()
![]()
0 , i ,
![]()
and .
ii
In order to determine the equation of the response surface, experimental design has been developed with the attempt to approximate this equation using the smallest number of experiments possible. In this investigation, experimental design was established on the basis of 2k factorial, where k is the number of variables, with central composite-second-order rotatable design to improve the reliability of results and to reduce the size of experimentation without loss of accuracy. Thus, the minimum possible number of experiments (N) can be determined from the following equations:![]()
![]()
N nc na
![]()
n 2 k
![]()
na 2 k
![]()
n....,
Where nc parameter defines the number of factorial points or corner points. One central composite design consists of cube points at the corners of a unit cube that is the product of the intervals [-1, 1]. The na parameter defines the number of axial points or star points along the axes or outside the cube at
IJSER © 2012
International Journal of Scientific & Engineering Research, Volume 3, Issue 6, June-2012 3
ISSN 2229-5518
TABLE 2
![]()
Ra 54.3206
![]()
1.5077
![]()
![]()
Ip 1.0036
![]()
Ton
PLAN FOR CENTRAL COMPOSITE ROTATABLE SECOND-ORDER DESIGN
![]()
1.2045
![]()
Tof f
![]()
![]()
5.0810 V
![]()
![]()
1.6
![]()
![]()
03 Ip Ip
![]()
![]()
7.1
![]()
03 Ton
![]()
Ton
![]()
8 03
![]()
Tof f
![]()
Tof f
![]()
![]()
1.557
![]()
![]()
01 V V
![]()
![]()
1.88
![]()
02 Ip
![]()
![]()
Ton 6
![]()
03 Ip
![]()
Tof f
![]()
![]()
2.59
![]()
![]()
02 Ip V
![]()
![]()
1.03
![]()
02 Ton
![]()
Tof f
![]()
![]()
7.17
![]()
![]()
02 Ton V
![]()
![]()
4.98
![]()
![]()
02 Tof f V
TABLE-3
ANOVA TABLE FOR SR BEFORE ELIMINATION
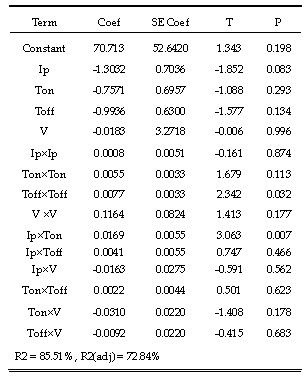
The unknown coefficients are determined from the experimental data as presented in Table-3. The standard errors on estimation of the coefficients are tabulated in the column
’SE coef’. The F ratios are calculated for 95% level of confidence. For improving the value of R2 the unusual observation with large standardized residual (i.e. 7, 8, 10, and
22) were eliminated. The regression model is reevaluated by determining the unknown coefficients, which are tabulated in
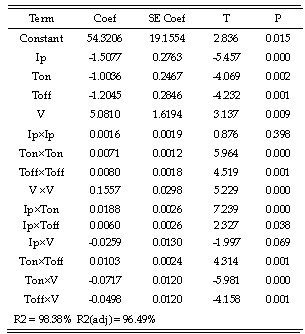
Table-4. The final response equation for SR is given in below equation.
The ANOVA table for the curtailed quadratic model (Table-
4) depicts the value of Coefficient of determination R2 as
98.38%, which signifies that how much variation in the response is explained by the model. The higher of R2,
indicates the better fitting of the model with the data. However, R2 adj is 96.49%, which accounts for the number of predictors in the model describes the significance.
IJSER © 2012
International Journal of Scientific & Engineering Research, Volume 3, Issue 6, June-2012 4
ISSN 2229-5518
TABLE 4
ANOVA TABLE FOR SR AFTER ELIMINATION
come close to form a straight line, it implies that the data are normal. It can be seen that the regression model is reasonably well fitted with the observed values.
9
8
7
6
5
4
4 5 6 7 8 9
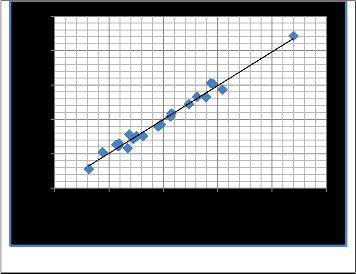
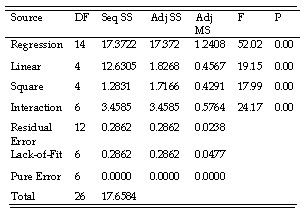
It is important to check the adequacy of the fitted model, because an incorrect or under-specified model can lead to misleading conclusions. By checking the fit of the model one can check whether the model is under specified. The model adequacy checking includes the test for significance of the regression model, model coefficients, and lack of fit, which is carried out subsequently using ANOVA on the curtailed model (Table-5).
Fig.1. Predicted vs. experimental SR
TABLE 5
ANOVA TABLE FOR THE FITTED MODEL
The effect of the machining parameters (Ip, Ton Toff and V) on the response variables SR have been evaluated by conducting experiments as described the previous section and analyzed using Minitab software. ANOVA is used to check the sufficiency of the second-order model. SR obtained from the experiment is compared with the predicted value calculated from the model in Fig. 1. Since all the points on plot
Fig. 2. Effect of Ip & Ton on SR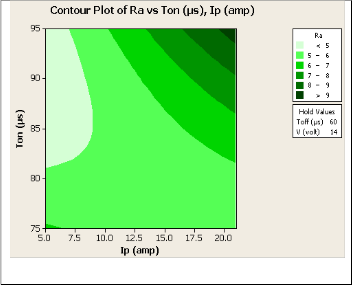
Fig. 2 shows the estimated response surface for Surface Roughness in relation to the process parameters of Ip and Ton while Toff and V remain constant at their middle value. It can be seen from the figure, the SR tends to increase significantly with the increase in Ip for any value of Ton. However, the SR tends to increase with increase in Ton, especially at higher Ip. Hence, minimum SR is obtained at low peak current and low pulse on time. This is due to their dominant control over the input energy, i.e. with the increase in Ip and Ton generates strong spark for longer time, which create the higher temperature and crater, hence rough surface in the workpiece and low Ip creates small crater and therefore smooth surface.
Fig. 3 shows the estimated response surface for Surface
Roughness in relation to the process parameters of Ip and Toff
while Ton and V remain constant at their middle value. It can
IJSER © 2012
International Journal of Scientific & Engineering Research, Volume 3, Issue 6, June-2012 5
ISSN 2229-5518
be seen from the figure, the SR tends to increase significantly with the increase in Ip, the explanation is same, as stated earlier. However, with the increase in Toff, SR decreases. It is because it takes time before next spark and reduces the crater effect due to higher temperature.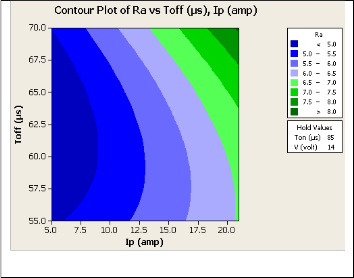
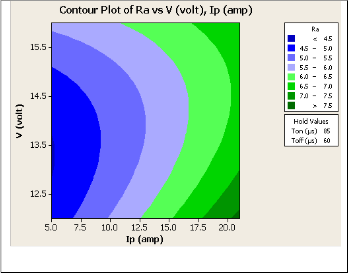
Fig. 5. Effect of Ip & V on SR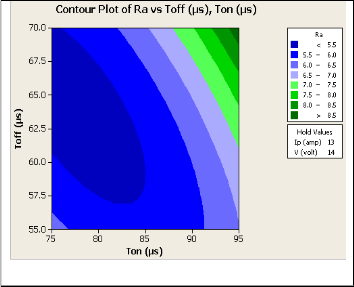
Fig. 3. Effect of Ip & Toff on SR
Fig. 4. Effect of Ip & V on SR
Fig. 4 represents SR as a function of Ton and Toff, whereas the Ip and V remains constant at its middle level. It is observed that the SR values are low when Ton is low with higher Toff or Toff is low with higher Ton. From the analysis it is said that the interaction of Ton and Toff is significant. Although the influence of this two parameter is very less when compared with the effect of Ip on SR.
It can be observed that there is no significant variation of
SR with the variation of voltage. From this observation, it can
be concluded that Ip and Ton are directly proportional, and Toff is inversely to the SR for the given range of experiments conducted for our test.
TABLE 6
COMPARISON OF PREDICTED VS. EXPERIMENTAL
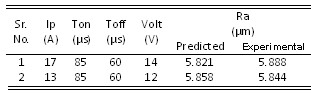
In the present study, the process parameters with significant influence on Surface roughness were determined by using RSM. This paper highlights the development of a comprehensive mathematical model for correlating the interactive and higher order influences of various electrical discharge machining parameters through response surface methodology (RSM), utilizing relevant experimental data as obtained through experimentation of surface roughness. The lower value of surface roughness is achieved with Ip = 6 A, Ton = 75 μs and Toff = 70 μs within the experimental domain. The research findings of the present study based on RSM models can be used effectively in machining of AISI D2 tool steel in order to obtain best possible EDM efficiency.
[1] Puertas. C.J. Luis. G. Villa. 2005. Spacing roughness parameters study on the EDM of silicon carbide, Journal of Materials Processing Technology 164–165: 1590–1596.
[2] R. K. Garg. K. K. Singh. Anish Sachdeva. Vishal S.
Sharma. Kuldeep Ojha. Sharanjit Singh. 2010. Review of research work in sinking EDM and WEDM on metal matrix composite materials, Int J Adv Manuf Technol
50:611–624.
IJSER © 2012
International Journal of Scientific & Engineering Research, Volume 3, Issue 6, June-2012 6
ISSN 2229-5518
[3] Y.H. Guu. H. Hocheng. 2001. Improvement of fatigue life of electrical discharge machined AISI D2 tool steel by TiN coating, Materials Science and Engineering A318: 155–162.
[4] Y.H. Guu, H. Hocheng, C.Y. Chou, C.S. Deng. 2003. Effect of electrical discharge machining on surface characteristics and machining damage of AISI D2 tool steel, Materials Science and Engineering A358: 37-43.
[5] Y.H. Guu. 2005. AFM surface imaging of AISI D2 tool steel machined by the EDM process, Applied Surface
Science 242: 245–250.
[6] M. K. Pradhan and C. K. Biswas. 2009. Predictive modelling and analysis of surface roughness in electro- discharge machining of d2 tool steel using regression and neural networks approach, International Journal on
Design and Manufacturing Technologies.3: 20-29.
[7] M. K. Pradhan, and C. K. Biswas. 2009. Modeling and Analysis of process parameters on Surface Roughness in EDM of AISI D2 tool Steel by RSM Approach, International Journal of Engineering and Applied Sciences
5: 346-351.
[8] S. Prabhu and B.K. Vinayagam. 2010. Analysis of surface characteristics of AISI D2 tool steel material using Electric Discharge Machining process with Single wall carbon nano tubes, International Journal of Engineering and Technology Vol. 2: 35-41.
[9] D. C. Montgomery. 2001. Design and analysis of experiments, John willy and Sons Inc.
[10] Ulaş Çaydaş & Ahmet Hasçalik. 2008. Modeling and analysis of electrode wear and white layer thickness in die-sinking EDM process through response surface methodology, Int J Adv Manuf Technol 38: 1148–1156.
[11] Sameh S. Habib. 2009. Study of the parameters in electrical discharge machining through response surface methodology approach, Applied Mathematical Modelling
33: 4397–4407.
IJSER © 2012