International Journal of Scientific & Engineering Research, Volume 3, Issue 9, September-2012 1
ISSN 2229-5518
Load Estimation and Supporting Energy
Efficiency in Smart Grids
Hossein Shahinzadeh , Hajar Ghotb
Abstract— Today, the smart grids has gain a special interest in the area of distribution system, so the role of accountability programs in operation and development of distributed systems and also, the optimum benefits of these programs are of special importance. Now more power companies around the world tend to provide more infrastructure which is needed for smart grid as a convenient way to appropriate and effective use of network and solve network problems.The present study first, the structure of the smart grid and the way it engages in smart grid environment is reviewed, then the role of smart grid programs in reducing load and load management is examined. In order to demonstrate the feasibility and effectiveness of the role of smart grid, optimization problem on a distributed network of 33 feeders IEEE with 384 subscribers in different modes of operation, by MATLAB software has been investigated.
Index Terms— Smart Grids, Distributed Network, Dstribution Management System, Load Estimation.
—————————— ——————————
1 INTRODUCTION
ACTORS such as increasing electricity demand, shortage of conventional energy sources, government efforts to greater use of renewable resources, etc. has resulted in unac- countability of electricity networks with the current structure
in the future.
Smart design is expressed as one of the recent topics in electricity networks, particularly in the distribution field. Alt- hough many definitions have been proposed for smart grid , but what is clear is that a smart grid is a network which uses a two-way communication, the latest telecommunication tech- nologies and advanced sensors between components and power system components leading to improved efficiency , improved reliability and security of delivered and used elec- tricity. Improving communication between consumers and producers can lead to more consumer participation in De- mand Response Programs and maximum use of distributed generation and renewable energy sources and consequently result in saving investment and operation costs, delays in building new power plants and paving smoothing the net- work load curve.
So far very diverse research has been conducted in de- mand response programs , Including benefits and challenges of implementing this program , for Examples the effect these programs on energy market operations and reserve , produc- tion of renewable resources and the economic modeling pro- grams.
This study aims to the introduce the smart grids and as- sesses their role in report the instantaneous power load to the
————————————————
Hossein Shahinzadeh , Department of Electrical Engineering, Islamic Azad
University , Isfahan , Iran; e-mail : ee_ieee@yahoo.com.
Hajar Ghotb , Department of Electrical Engineering , Najaf Abad Branch ,
Islamic Azad University , Najaf Abad , Iran .; e-mail :
n_ghotb2010@yahoo.com .
power market and consumer participation in demand re- sponse programs and maximum use of distributed generation and renewable energy sources and thus saving on capital costs and operation.
2 FEATURES & FUNCTION OF SMART GRID
The basic concept of smart grid is addition of monitoring, analysis, control and communications capabilities to power system for increased efficiency, while simultaneously con- sumption can be reduced. The smart grids are beneficial, both economically and environmentally. Economically, use of smart grid would reduce consumption through increased sys- tem efficiency, Customer Training and participating them in overall performance of the network, and also through the im- plementation of load management and demand response pro- grams.
With respect to the environment the overall rate of pro- duction and emission of carbon dioxide can be reduced by use of smart grid; this reduction is performed through increased management of load and consumption, reducing the produc- tion in peak time and increasing the use of renewable energy sources. Smart grid provides advantages for electric compa- nies and consumers that some of the most important ones are shown in Table 1.
In terms of economic status this system provides energy transfer with the most efficient and most economic method. Also in this network consumer can reduce his consumption by executing management flexible practices. Moreover by send- ing real time information about the status of consumption, the consumer can be encouraged to reduce carbon dioxide pro- duction and emission, and create a healthier environment for life.
IJSER © 2012
http://www.ijser.org
International Journal of Scientific & Engineering Research Volume 3, Issue 9, September-2012 2
ISSN 2229-5518
Table 1: Advantages of smart grid
Electric Company | Consumer |
* Improve reliability | * Possibility of use of manage- ment practices |
* Possibility of breakdown of costs in different parts of the network | * Advantage of new technologies in smart meters |
* Reduce run costs and mainte- nance | * Saving cost with Reduction peak load |
* Improve efficiency of power network | * Save money with increase effi- ciency |
* Improve system security | * Improve services to customers in the electricity market |
* Use of renewable energy and distributed generation resources in a centralized system | * Reduce the overall cost of in- dustrial consumers |
As fuel prices were sharply increased during recent years, Energy wastes costs more. So efficiency in electric generation, transmission and distribution is more critical. To enhance the efficiency, the following listed approaches are examined:
2.1 Distributed generation (DG) and Micro Grids
Noticeable waste of electricity happens in transmission and distribution level; by enabling DG in micro and island grids these amount of waste will be mitigated greatly.
2.2 DC power instead of AC power
A major part of today`s consumption of electricity is in residential and commercial regions. This energy is used in electronic devices, that consume DC power, so AC power should be converted to DC in such devices. In these conver- sions a large amount of losses occurs. On the other hand, by increasing renewable power plants and distributed sources, hybrid vehicles and battery storages another DC/AC conver- sion should be done in production side. Therefore, a consider-
able amount of losses which is up to 35% will be imposed on
empowers the consumers to interact with the energy man- agement systems to manage their energy use and reduce their energy costs. Smart Grid is also a self-healing system. It pre- dicts looming failures and takes corrective actions to avoid or mitigate system problems. Smart Grid uses information tech- nology to continually optimize the use of its capital assets while minimizing operations and maintenance costs.
Mapping the above definitions to a practical architecture, one can readily see that Smart Grid cannot and should not be a replacement for the existing electricity grid, but a complement to it. In other words, Smart Grid would and should co-exist with the exiting electricity grid, adding to its capabilities, func- tionalities and capacities through an evolutionary path. This therefore necessitates a topology for the Smart Grid that al- lows for organic growth, inclusion of forward looking tech- nologies and full backward compatibility with the existing legacy systems.
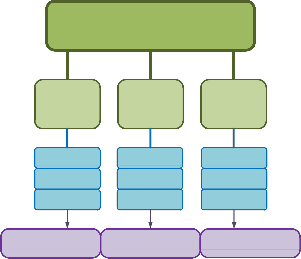
At the core, the Smart Grid is therefore an ad-hoc integra- tion of complementary components, subsystems and functions under the pervasive control of a highly intelligent and distrib- uted commanding and controlling system. Furthermore, or- ganic growth and evolution of the Smart Grid is envisaged to be materialized through plug & play integration of certain basic structures which are called Intelligent (or Smart) Micro- grids. Micro-grids are defined as an interconnected network of distributed energy systems (loads & resources) that can func- tion connected to or separate from the electricity grid. In Fig- ure 1 Some of the key functions of this network are listed.
Smart Grid
the system. On the other hand in this situation so many un- necessary convertors are included in the devices which cause increases in prices. Eliminating the need for multiple conver- sions could also potentially translate into lower maintenance requirements, longer-lived system components, and lower operating costs.
3 Effect of Smart Grid
Smart Grid is the collection of all technologies, concepts,
Demand
Management
Demand Response
Smart Meter
Smart Buildings
Reduction energy consumption in homes, offices and factories
Distributed
Generation
Micro-generators Energy storage Hybrid Vehicle
Motivate for subscribers to use of energy resources renewable
Energy
Quality
Control Network Monitoring Network security
Use IT to improve the distribution network control
topologies and approaches which allows the silo hierarchies of generation, transmission and distribution to be replaced with an end-to-end organically intelligent and fully integrated envi- ronment where business processes, objectives and needs of all stake holders are supported through efficient exchange of da- ta, services and transactions. Smart Grid therefore is defined as a grid which accommodates a wide variety of generation options, e.g. central, distributed, intermittent and mobile. It
Fig. 1. Key Principles of smart grids.
4 Data Management
For the retail sales operation, the most important issue is the interface to the metering systems and to the substation control, or SCADA system. Some information may come from Customer Information System (CIS), some may come from GIS and some may come from SCADA. The engineer has to access
IJSER © 2012
http://www.ijser.org
International Journal of Scientific & Engineering Research Volume 3, Issue 9, September-2012 3
ISSN 2229-5518
several database systems to get the complete information. Se-
cond, the data in the original database may not be in the same form required by analytical tools. These interfaces produce the measurement based information, which mostly is necessary for load estimation and energy balance management. The ex- pansion planning of the power system involves a wide range of tasks, as the following: determination of the number of loca- tions and capacities of the future substations; and the planning of the number, routes and capacities of the feeders. The vari- ous computerized techniques available for distribution plan- ning differ in approach, algorithm, data needs, and quality of results.
However, it requires base line information upon which the analysis can be performed.
The role of distribution and data management system and network automation system is to further increase the demand related information. The communication between these sys- tems and the Distribution Energy Management (DEM) system will be arranged on an hourly basis. Integrating geographic and other corporate data to make maximum use of this valua- ble information has become of the primary interest for the power distribution utilities.
5 A Distribution Energy Management System
The problems of energy management from the standpoint of the energy trading and distributing companies in the new situation are first discussed. For distribution companies these mean big changes, since the network operation and energy selling activities will be separated. The customers have the right to choose between several power suppliers.
The main functions of the DEM system for Distribution
Energy Management are:
1. Distribution load estimation
2. Load forecast, short, medium, and long term
3. Technical energy balance estimate
ary (ML/LV) substations on a real time basis. Recently most
researcher have adopted algorithm of Distribution State Esti- mation for distribution system [5]-[9].
The on line knowledge of loads is essential for the optimi-
zation of power generation and other electricity purchase. However in the free market, all the customers, which partici- pate in the competition, are not necessarily metered real time. The hourly demands are obtained only afterwards, possibly with several weeks delay.
The hourly energy data must be known for calculation of the hourly trade between distribution utility and the energy supplier. Some of the customer loads are metered in real time, at every 15 minutes. Some of eligible customers have not the metering in real time; they have only the load estimates. Their hourly loads are obtained later on, until meter readings will be available. However, on line (one hour ahead) forecasts of loads in the distribution system are needed for the trader’s estimate of power generation and electricity purchase.
The problem of delayed load data can be solved by the on
line estimation of customers’ loads. The estimation is based on the past recordings of hourly demands, customer class load models and if available, on line measurements in the distribu- tion network. On line measurements can be planned for the loads of medium voltage distribution feeders.
By combing the measurement data with load models, an
estimate can be produced for the hourly demands of the cus- tomers.
More severe concerned problem is the uncertainly in the announced estimates of the loads of other traders’ customers in the area of selling company.
By combining network data and customer data load mod- els for customer’s classes was acquired. When linear model is used the resulting load value depends on annual energy con- sumption of the class, parameter obtained from the load mod- el and the error.
4. Commercial energy balance management
W W
sl 11
... W
ml
,...,W
sn
W ... W
1n mn
(1)
5. Load metering handling for billing
And estimates from load models
6. Selling/buying agreement management
7. Monitoring and control of distributed generation
z v
1 1
W x sl 1
,...z v
n n
W x sn n
(2)
8. Electricity purchase optimization
9. Pool price forecasting
We use matrix representation for the customers class
loads z1…zn .
z v W
10. Short term electricity trade optimization
1 1 1
0 0 x
1
11. Tariff design and retail sales planning
. z v W .x
(3)
12. Load control optimization, direct and indirect
13. DSM planning functions
z n v n 0
z
0 W x
n n
14. DSM impact verification
15. DSM impact models (pseudo-loads)
For the measurement we get the following equations where e represents measurement.
Estimation of load flows in the distribution system is
based on the combination of models of type of users load, sta-
S e
1 1
W .x
11 1
W .x
11 1
W .x
12 2
W
1n
.x
n
(4)
tistical data, customer information and measurements.
S e
W .x W
.x W .x
The model produces the best possible estimate of the state m m
m1 1
m2 2
mn n
of the medium voltage distribution network up to the second-
IJSER © 2012
and the matrix representation
http://www.ijser.org
International Journal of Scientific & Engineering Research Volume 3, Issue 9, September-2012 4
ISSN 2229-5518
W
S e 11
1 1 W
W W
12 1n x
W W
4. Large commercial consumers (LC)
5. Industrial consumers (IC)
12
22 2n .
S e W .x s
(5)

23 24 25
Sm e m W W
W x n
26 27 28 29
30 31
32 33
m1
m2
mn
The measurement error variance must be estimated from the reliability of the measurements. When we have measure-
01
02 03
04 05
06 07
08 09 10 11 12 13 14
15 16 17 18
power includes error, which may be estimated to have a standard deviation of 10% from the absolute value of meas- urement. Thus the direct measurement has a smaller error
19 20 21 22

variance than the load models. This means the smaller the er- ror variance the higher the weight and then larger the variance the smaller the weight. The models will change to fit the val-
LC DC DC
DC DC
DC MC DC DC
DC SC
ues of measurements in relation to their model variances. The point estimates of values with high variance are more likely to
MC SC
SC SC
SC SC SC IC
IC MC
DC DC
DC DC
DC MC LC
change than values with low variance.
The general solution of the WLSE (Weighted Least
MC LC
DC LC
Squares Estimation) [10] operation problem z = Ax is
Fig. 2. distributed network studied (33 Feeder IEEE) .
minc - A.bT .R
1.c A.b
(6)
Respectively values -0.15, -0.14, -0.23, -0.30, -0.40 for the
T
xˆ z
R 1
1
z
Wz
R 1 z
(7)
elasticity consumer price and the amount of energy tariffs
0.21, 0.23, 0.24, 0.19, 0.14 of $/kWh for consumers DC ، SC ،
W
W
MC ، LC ، IC is intended. Interest rate of consumers against
s
s
Ws
S
the amount of energy primary tariffs for each consumer is as-
Where
1/σ 2 0
1
0 0
sumed.
Consumer information, including their type and amount
of energy are listed in Table 2. As was pointed out constraints
0
R 1
0
1/σ 2 n
0
0 0
1/σ 2 0
s1
2
(8)
such as maximum allowable reduction of power and maxi-
mum allowable change in energy prices for consumers is con- sidered. In this paper, the maximum allowable power con- sumption equal to 15% reduction in energy consumption of each consumer and maximum allowable change in the price of
0 0
0 1/σ sm
energy equal to 30% of energy tariffs is considered.
With help of this result we can solve the new estimates
for z customer classes and S for feeder loads:
Table 2: Information of consumers
zˆ W x
z
sˆ W x
(9)
(10)
s
These values are now the best estimates for customer class loads and feeder measurements in the WLS sense.
6 Simulation Results
In order to assess the role of the smart grid in the estima- tion of time and energy management, 33 feeder radial distri- bution network which is shown in Figure 2 has been used. The number of consumers is assumed as 384 joint, and in every feeder there are 12 consumers.
Consumers are divided into five main types:
1. Domestic consumers (DC)
2. Small commercial consumers (SC)
3. Medium commercial consumers (MC)
IJSER © 2012
http://www.ijser.org
International Journal of Scientific & Engineering Research Volume 3, Issue 9, September-2012 5
ISSN 2229-5518
Table 3: Impact of smart grid on energy purchase costs, Loss- es and voltage distribution network
| traditional network | Smart Grid |
Energy purchase costs of the electric- ity market ($) | 934.2 | 857.4 |
losses Distribution network (Kwh) | 187.5 | 162.2 |
Low voltage distribution network (pu.) | 0.9659 | 0.9721 |
0.14
0.12
0.1
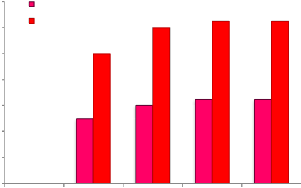
Smart Grid
Traditional Network
0.08
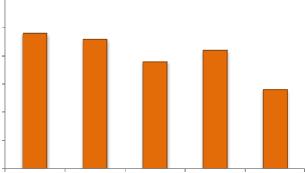
Figure (3) shows the reduced energy consumption for each mode in each type. As it is shown in Figure (3) with in- creasing consumer participation in smart grid energy reduc- tion will be increased.
0.3
0.25
0.2
0.06
0.04
0.02
0
MC SC LC DC IC
Type of consumer
Fig. 4. Rate the expected reduce energy losses.
0.15
0.1
0.05
0
MC SC LC DC IC
Type of consumer
Fig. 3. Energy prices moment for consumers.
As is specified with increasing consumer participation in the smart networks, energy purchase costs and distribution losses has been reduced considerably and the system voltage profile is improved.
In a case that the network load increases 30%, In addition
to the problem of voltage drop in the network the rate of
transmission of power reaches its maximum, the operator is
forced to cut more load in the network. But similar to the pre-
vious mode and While the energy purchase price is lower than
the amount of consumer interest, the smart grids with the op-
timum price spot for the Types of Consumers, can be exploited
in the distribution network in authorized area without Forced
Lack of expected reduction for MC type users is due to
their higher interest in purchasing price of the electricity ener-
gy market.
It is noteworthy, Instantaneous change in consumer prices is more for SC and DC consumers than consumer type of LC and IC;this change is more due to lower capacity of demand prices and the higher initial tariffs for energy for this type of the consumers.
Energy purchase cost of the electricity market, the amount of system losses and the lowest voltage distribution network are shown in Table 3.
Figure 4; also show the reduction of energy consumption in each mode for each type.
outages load.
The results for this mode in the smart grids and conven-
tional networks are specified in Table (4).
Table 4: The effect of smart grid in increasing the network load
7 Conclusion
In the deregulated electricity market, the power trading
IJSER © 2012
http://www.ijser.org
International Journal of Scientific & Engineering Research Volume 3, Issue 9, September-2012 6
ISSN 2229-5518
companies have to face new problems. The biggest challenge is caused by the uncertainty in the load magnitudes. In order to minimize the risk in power purchase and also in retail sales, the power traders should have the most possible reliability and accuracy in estimates for hourly demands of their cus- tomers. New tools have been developed for the distribution load estimation of the trading companies.
These tools are based on the flexible combination of the information available from several sources, like load meas- urements, load models, statistical data in combination with Smart Grid.
The combination of Smart Grid and Distribution Load Es- timation algorithm could be used in conjunction with other operational tools such as:
1. Utilization of Demand Side Management (DSM) to con- trol loads in order to reduce the peak power demand or peak price
2. Accordingly can be used recursively for a better dynamic load models for HV/MV substations
3. Planning of tariff offers and methods to modify the cus- tomer load curve
4. Better utilization of the distribution MV lines and trans- formers ML/LV
5. Saving in network investments
6. Reduction in outage costs
7. Integration of the distribution utility’s and customer’s au- tomation system for load control
8. Better competitiveness in the electricity market.
REFERENCES
[1] P.H.Hsi, S.L.Chen, 1998, “Distribution Automation. Communication
Infrastructure”, IEEE Trans.on Power Delivery, Vol.13, No.3, 728-734.
[2] Market Simulation Programs for the SMD and Genera- tion/Transmission Planning July 14, 2003,Henry Chao, ABB Inc.
[3] Wood. A.J. and Wollenberg. B.F, “Power generation,operation and control” (John Wiley & Sons, 1996).
[4] Sanz, R., Arzen, K. E., Trends in software and control. IEEE Control
Systems Magazine, Vol. 23, No. 3, 2003, pp. 12-15.
[5] A.A.Yaghoti, M.Parsa, 2004,”Placement Limite Measurement for
State Estimation in Distribution Networks”, 19th PSC .
[6] Babu, P. R.; Divya, V. P. S.; Venkatesh K. “Application of ANN and DSM Techniques for peak load management a Case study.”, IEEE Sustainable Energy Technologies, pp. 384-388, 2008.
[7] Vladimiro Miranda, Jorge Pereira, 2000, “Load Allocation in DMS
with a FUZZY State Estimator “, IEEE Tran. On Power systems, Vol.
15 No 2 .
[8] Babu, P.R.; Divya, V.P.S.; Srikanth, P.; Singh, B.D. “Neural network and DSM techniques applied to an industrial consumer a Case study.”, IEEE Compatibility in Power Electronics conferences, pp. 1-4,
2007 .
[9] Jie Wan, Karen Nan Miu, 2003, “Weighted Least Squares Methods for Load Estimation in Distribution Networks”, IEEE Tran. On Power systems, Vol. 18 No 4 .
[10] Atish K. Ghosh, David L. Lubkeman, 1997, ” Distribution Circuit State Estimation Using Probabilistic Approach, IEEE Tran. On Power systems, Vol. 12 No 1.
[11] N. Palaniswamy, D. Dugar, D.K. Jain, R. Sarabhoje, “Enhanced Blow- fish Algorithm using Bitmap Image Pixel Plotting for Security Im- provisation,” ICETC, 2010.
[12] Fundamental of Load Management, IEEE Tutorial Course Text, 1988.
Hossein Shahinzadeh is a researcher in the Electrical Engineering Islamic Azad University. He has authored more than 30 journal and conference papers. His research activities focus on the power system Analysis, power Electronics, Renewable Energies and Network Relia- bility. He has been a consultant with utilities of Esfahan Electricity Power Distribution Company.
E-mail address: ee_ieee@yahoo.com .
Hajar Ghotb : received his BS. and MS. at Islamic Azad University Najaf Abad Branch , Isfahan , IRAN . she is working on the Ph.D. degree in control Electrical Engineering . her teaching and research interest includes Modeling and Control Chaos, Load Modeling Special Arc Furnace Modeling, Power System Analysis, and Power Quality. she has some papers in the Conference .
E-mail address: n_ghotb2010@yahoo.com.
IJSER © 2012
http://www.ijser.org