International Journal of Scientific & Engineering Research, Volume 4, Issue 6, June-2013 2873
ISSN 2229-5518
Line Generation between Existing Contours In
Order to Reduce Stair Case Effect
Mohan P Pradhan, M K Ghose
Abstract— Contours lines are used to represent same elevation points throughout the reference map. These lines plays a pivotal role while determining the shape of the terrain i.e. these lines in combination with its elevation details are used for creating Digital Elevation Model (DEM) for the terrain. Reference maps are released at different scales which imply that objects represented in the reference maps are represented at different scales. Smoothness of the terrain shape created taking into consideration contours and the inter-contour distance hugely depends on the number of contour lines running across the terrain. Greater the scale lesser will be the of lines with larger inter-contour where as lesser the scale greater will be the number of contour lines with smaller inter-contour distance used in-order to cover a terrain of same dimension.Shape extracted from image with a smaller inter-contour distance usually appears smooth as a consequence of increased variation in slope where as shape extracted from image with a greater inter-contour distance suffers from what can be referred to as a Stair Case Effect where the object appears sharper as a consequence of lesser variation in slope. In case of legacy reference data where the inter-contour distance is very large stair case effect will be prominently visible. To overcome the above stated problem this work proposes an efficient contour line generation algorithm based on angular movement technique combined with interpolation after acquiring knowledge of the existing contour lines.
Index Terms—Centroid, Contour, Digital Elevation Model (DEM), Interpolation, Scale, Spiral Traversal, Stair Case Effect.
—————————— ——————————
1 INTRODUCTION
A reference map pertaining to an area of interest hosts various morphological features. These morphological features are used for various inferential studies related to geography and GIS. These morphological features can be broadly classified into either point or line or polygon. Point feature is used to represent landmark and reference point etc. Line feature is used in order to represent road, river and contours etc. Poly- gon feature is used in order to represent enclosed contours and lakes etc. Each of these features in the reference map for the ease of visual interpretation is represented using different color codes. While different color code not only eases visual interpretation, it is also used as a basis for segmenting features using a computational process.
One of the key feature represented in a reference map are con- tour lines. Fundamentally contours line can be thought of a continuous line joining point that are at same height from a reference datum. Actually these lines are not physically pre- sent on the terrain but are rather abstract line linking locations at same elevation. These lines can be used for various morpho- logical studies to name a few such as determination of shape, slope, elevation of a particular point and type of ridge.
Contour line can be of various types. It can be best classified by correlating contours with ridges in the human finger print. The features in the human finger print are often referred to as minutiae’s. These minutiae’s can be either ridges or enclosures etc. Ridge can be either complete ridge or incomplete ridge or
————————————————
• Mohan P Pradhan is currently pursuing Ph. D in Automatic Digitization from Sikkim Manipal University, India, PH+91-9434356799, e-mail:- mo- hanp_pradhan25@yahoo.com.sg
• Prof. (Dr.) M K Ghose is currently working as Dean (R&D) and Professor
& Head of the Department of Computer Science & Engineering at Sikkim
Manipal Institute of Technology, Sikkim Manipal University, email:- mkghose@smu.edu.in
short ridge. Enclosure can be either a simple enclosure or an enclosure within another enclosure. Likewise contour line can also be complete or incomplete or short line as well as it can have enclosures.
The different types of contour lines are attributed by the fact that they have certain length and have different originating and terminating coordinate. Whereas enclosures are attributed by the fact that they have certain length and have originating and terminating coordinate.
These contour lines are used in-order to create Digital Eleva- tion Model pertaining to a terrain. Digital Elevation Model is created by elevating the identified contour lines by associated elevation details in the third dimensional plane. Elevation de- tails are associated with few of the contour lines at certain in- tervals. Once the contour lines are identified the elevation val- ues may be either manually or automatically associated to create the DEM.
The smoothness of DEM created from the identified contours lines highly depends on the inter-contour distance. Greater the distance between the contour lines lesser will be the smooth- ness of DEM and lesser the distance between the identified contour lines greater will be the smoothness. Here smoothness refers to increased variation in slope.
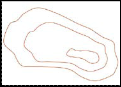
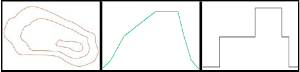
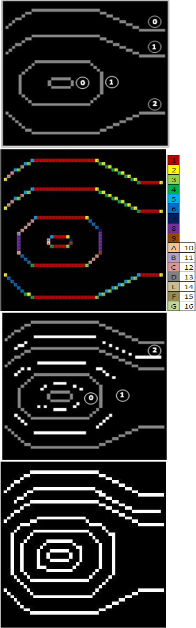
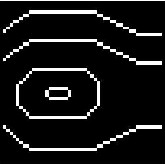
The variation in slope can be used in-order to create a stair case representation. It was observed that when there is less variation in the slope the size of the stair in the stair case in- crease. This problem may be correlated to stair case effect. Consider Fig. 1(a). represents contour lines. Fig. 1(b). repre- sents the elevation model created using contour lines along with the stair case created.
IJSER © 20 13 http://www.ijser.org
International Journal of Scientific & Engineering Research, Volume 4, Issue 6, June-2013 2874
ISSN 2229-5518
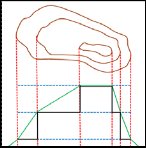
Fig. 1(a). Contour Lines
Fig. 1(b). elevation model along with the stair case created
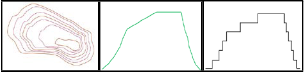
In Fig. 1(b) it is observed that the due to less variation in the slope the size of the stair in the stair case is relatively big. Con- sider Fig. 2(a) represents contour lines. Fig. 2(b) represents the elevation model created using contour lines along with the stair case created
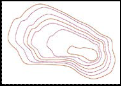
Fig. 2(a): Contour Lines
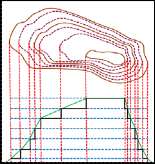
Fig. 2(b). elevation model along with the stair case created
On, comparing the slope and the stair case it can be concluded that the greater the factoring of stair case greater will be the smoothness of the slope or vice versa as represented in Fig. 3.
3(a) 3(b) 3(c)
3(d) 3(e) 3(f)
Fig. 3. Comparison of two cases
So, in-order to overcome this problem either reference map which has contour with smaller inter-contour distance can to
be taken into consideration or intermediate contour lines are to be generated using the knowledge of the existing contours
that are already present. In situation where the former ap- proach is not applicable (in case of legacy maps) the later ap- proach may be deployed where are intermediate contours are generated based on the knowledge of the existing contours.
In order to generate intermediate contour, first knowledge of
the existing contours are to be acquired with its relevant in- formation and are subsequently stored in a repository. Then the knowledge is used in-order to interpolate a set of points. Upon inflation the dataset with interpolated points an appro- priate line construction algorithm is to be used for connecting the interpolated point’s in-order to create a continuous line
This proposed work in abstraction involves the following
steps,
• Color segmentation of extracting only the contours
• Application of morphological operation for skeleton-
izing the pattern representing feature using single pixel width
• Identification of minutiae’s representing the contour lines
• Interpolate intermediate points
• Resolve hit and miss
• Connect the interpolated points with continuous line
for creating contour.
for effective use of memory all the data structure used by the
process is jazzed in nature.
2 RELATED WORK
Interpolation is essential in order to create additional contour line in case where the scale of representing the object is very high for enhancing DEM representation. [1] As DEM is used in order to describe the relief form of the earth’s surface includ- ing various parameters such as elevation, slope etc. A. P. Ozah et. al. [2] proposed a method for performing accuracy tests of contours interpolated from the two different sources. It was performed taking into consideration different terrain configu- ration and context fro determining their suitability for topo- graphical mapping in different scenarios. Gill Barequet [3] proposed a method for performing surface interpolation in order to create an elevation model of an object based on con- tour information contained by multiple slices pertaining to the object. In order to create the elevation model first the contours in the slices were oriented towards same direction then the overlapping contours in each of the slices were analyzed in order to interpolate. Further triangulation was used in order to join the contour and to elevate it in third dimensions to create the elevation model. Chin-Shung Yang [4] performed compar- ative assessment of various interpolation methods for enhanc- ing data representation based on Inverse Distance to a Power , Kriging , Minimum Curvature, Modified Shepard's, Natural Neighbor, Nearest Neighbor, Polynomial Regression, Moving Average, Radial Basis Function Interpolation, Data Metrics, Local Polynomial, Triangulation with Linear Interpolation.
IJSER © 20 13 http://www.ijser.org
International Journal of Scientific & Engineering Research, Volume 4, Issue 6, June-2013 2875
ISSN 2229-5518
Each of the algorithms were analyzed from the perespective of applicability, algorithm, efficiency and advantage and con- cluded that the different interpolation algortihms performs best under certain desired circumstances.
Inorder to interpolate intermediate contour line it is of utmost importance to identify the existing contours and their infor- mation Chao-hsiung Wu et. al [5] proposed a technique for labeling the various contour lines by first creating a undi- rected contour tree and then applying a set of heuristic rules were applied to derive minimum set of height information required in order label the contours in the reference map. Interpolation between lines based on profile, proportional dis- tance, window or tin methods [6]. In case of profile method first a profile is generated through the interpolated point and then spline curve is used. Applicability of profile method de- pends on the type of curves in the contour lines. In case of proportional distance points are interpolated based on dis- tance ratio. In case of window based method a circular win- dow along with the adjacent contours are used to interpolate using polynomial. In case of TIN approach TINs are created using terrain points along contour lines. Jianyun Chai et. al. proposed a technique that takes the gradient conditions across contours into consideration in order to generate interpolated lines [7]. Michael B. Gousie et. al. [8] proposed a way for de- termining location where intermediate contours can and can- not be generated using Hermite splines and then gaps are filled by inverse distance weighting taking into consideration elevation points along cardinal directions. Türkay Gökgöz et. al. [10] stated that the skeleton line extracted related to the contour provides information regarding the contour to be generated.
3 METHODOLOGY
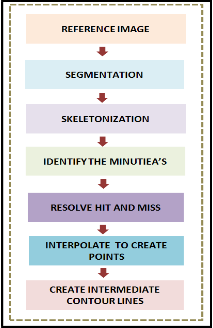
The methodology can be represented using the following schematic diagram
Fig. 4. Approach initiated
In order to initiate any of the data manipulation operation firstly the image is to be read and stored in a 3D dataset where the layers represents blue, green and red layers. In-order to ease the computational process the image is converted in sin- gle layer (representing shades of gray) image from a multi layer image. A coordinate in the single layer image (i.e. inten- sity) is a result of the proportion contribution of the red, green and blue at the same coordinate and is implemented as sum of products.
So, intensity at a given coordinate x,y in a gray image G is equal to
G(x,y)=proportion contribution of blue * Blue(x,y) + propor- tion contribution of green * Green(x,y) + proportion contribu- tion of red * Red(x,y)
Where, proportion contribution of blue + proportion contribu- tion of green + proportion contribution of red = 1
3.1 Segmentation
Segmentation process is used in-order to highlight on the re- quired feature and suppress all other features i.e. it partitions the data set. The partitioning is done based on the value of the intensity (or range) representing a particular feature. This pro- cess is referred to as thresholding. This process takes as basis the range of intensity value representing the feature of interest as a parameter for segmentation.
3.2 Skeletonization
Skeletonization or thinning is a morphological operator in image processing is the process of representing the feature of interest using single pixel width. The advantage of Skeleton- ization process is that it eases computation procedure.
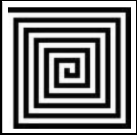
Fig. 5. Spiral Traversal
3.3 Spiral Traversal Technique
The traditional technique of row column data set traversal technique has O(f) and o(f) in order of m*n. On analyzing the input set pertaining to the pattern was observed that the leaf of the pattern would be efficiently identified by a spiral tra- versal technique rather than row column technique. In addi- tion spiral traversal is also capable of identifying enclosure within another enclosure without any additional complexity. Lastly in this case the O(f) would remain the same that is m *n, o(f) can be much less than m * n.[9]
This process has four sub modules Traverse right, Traverse down, Traverse left, and Traverse up
• Traverse right: This process was used in order to traverse right by keeping the row intact and incre-
IJSER © 20 13 http://www.ijser.org
International Journal of Scientific & Engineering Research, Volume 4, Issue 6, June-2013 2876
ISSN 2229-5518
menting the column by one until and unless a signifi- cant value is not encountered or the column bound is not reached.
• Traverse down: This process was used in order to traverse down by keeping the column intact and in- crementing the row by one until and unless a signifi- cant value is not encountered or the row bound is not reached.
• Traverse left: This process was used in order to trav- erse left by keeping the row intact and decrementing the column by one until and unless a significant value is not encountered or the column bound is not reached.
• Traverse up: This process was used in order to trav- erse up by keeping the column intact and decrement- ing the row by one until and unless a significant value is not encountered or the row bound is not reached.
After every spiral the row and column bound values are dec- remented.
3.4 Identification of minutiae’s
Minutiae’s are different types of elementary morphological element contributing to morphological features. There are var- ious categories of minutiae:
• Lines- Line better known as Ridge is linear feature that runs in the morphological terrain. Ridges in morphological study of terrain can be used for identi- fication of contours, rivers and water bodies etc. There are different types of ridges namely
o Complete Ridge - Complete ridge is a ridge that runs through the terrain i.e. it starts from either of the edges and ends at the other, it can start and end in the same edge as well.
o Ridge Ending - Ridge ending is a ridge that starts at either of the edges but ends at a coordinate po- sition that fall into neither of the edges.
o Ridge Enclosure - Ridge enclosure is a ridge that slits and again joins.
o Short Ridge - Short ridge is a ridge that starts and ends at non edge coordinates.
o Bifurcations- Bifurcation or slit is a division of a ridge into two or more ridges. Bifurcation in morphological study of terrain can be used for identification of river convergence and diver- gence etc.
• Enclosures - Enclosure or Island is a ridge that starts and ends at same point. Enclosure in morphological study of terrain can be used for identification of closed contour etc. An enclosure with a ridge exten- sion is referred to as a lake.
• Point - Point or dot is a feature that starts and ends at same coordinate without intermediate coordinates. Points in morphological study of terrain can be used for identification of landmark etc.
In case of contours the possible set of minutiae’s that may be associated are Lines and Enclosures.
Line (or ridge) detection
• Complete Ridge: If both the starting coordinate and the terminating coordinate fall onto either of the boundary then the ridge is identified as complete ridge.
• Ridge Ending: If either of the starting coordinate or the terminating coordinate fall onto either of the boundary then the ridge is identified as ridge ending.
• Short Ridge: If neither of the starting coordinate nor the terminating coordinate fall onto either of the boundary then the ridge is identified as short ridge.
Enclosure detection
If a ridge start from a particular coordinate and after reaching certain length terminates at the same coordinate position from where it had started then the ridge is identified as an enclo- sure. Most of the enclosure tracking algorithm implemented are either not capable of identifying the holes within an enclo- sure or does identify with greater complexity (such as, trian- gulation, minimum distance, interval scaling to name a few). One of the most significant achievement of this process is that it is efficiently identifies the holes. This has been possible be- cause of the spiral scheme designed for data traversal. Hence with no additional complexity involved the holes can be de- tected.
Determination of trail pattern
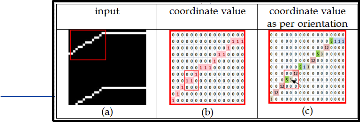
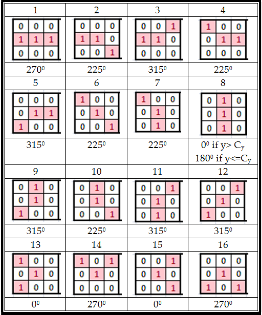
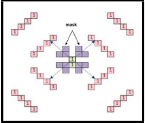
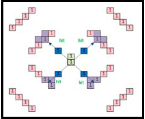
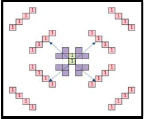
After identifying all the minutiae’s the next task is to identify the trail pattern. Here trail basically refers to the continuous chain of values that represent the orientation at different coor- dinate. In this work we have identified 16 such coordinate orientations considering a mask of 3x3. On reaching a particu- lar coordinate 3x3 values centered at the coordinate is extract- ed then it is compared with the sixteen masks a suitable match replaces the coordinate with the value associated with the mask. Table 1 represents the 16 masks.
TABLE 1
16 MASKS
TABLE 2
(A) IMAGE (B) BINARY VALUE OF SELECTED AREA (C) REPLACING
THE COORDINATE WITH VALUE MAPPED WITH MASK
(B)
IJSER © 20 http://www.ijser
International Journal of Scientific & Engineering Research, Volume 4, Issue 6, June-2013 2877
ISSN 2229-5518
If the coordinate value Xc (Centroid of object) is greater than or equal to X (coordinate) of the coordinate then movement will be along,
Table 2 (a) is a binary image where the features are represent- ed using single pixel width. Table 2 (b) is coordinate values in the binary image from the selected are demarked in red. Table
3 represents the coordinate value after replacing the coordi- nate location the values mapped with the matching mask.
After associating the values with the sixteen masks we need to determine the direction of movement when such orientations are encountered.
3.5 Direction of movement for enclosures
While determining direction of traversal for enclosure (along the angle specified) it was observed that direction of traversal entirely depends on the position of the significant value in the pattern with respect to the Centroid. In order to resolve the conflict the Centroid of the enclosure is taken into considera- tion.
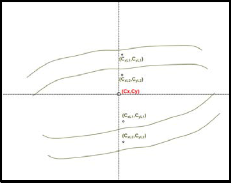
Centroid of a pattern can be determined by using the Centroid formulae. Let us consider a pattern represented by G, then the Centroid i.e. G(xc,yc) where in Xc and Xc are the coordinate of the Centroid, is given by
Xc= (∑xi )/ no of instances where xi represents x coordinate of significant value.
Xc= (∑yi )/ no of instances where yi represents y coordinate of significant value.
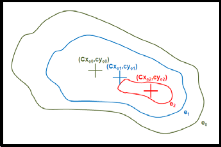
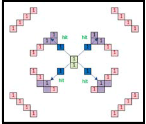
Fig. 6. Determination of the Centroid
On analyzing the problem it was observed that the movement has to always start from the innermost enclosure and should always converge outwards. So in-order to ensure proper tra- versal, the data structure used to store the coordinate values of the significant pixels was sorted as per the count of significant pixel i.e. enclosure having lowest significant pixel count is selected first and in the successive steps enclosures are select- ed in increasing value of count. As in case of Fig. 6, e1 is select- ed, then e2 followed by e3.
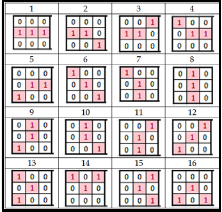
The following 3x3 16 masks were designed taking into consid- eration different possible orientation in order to determine movement,
First Consideration:
TABLE 3
DIRECTION OF TRAVERSAL W HEN XC IS GREATER THAN OR EQUAL TO X
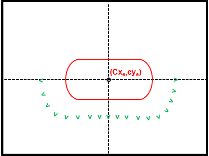
Fig. 7. xc >=x
Second Consideration:
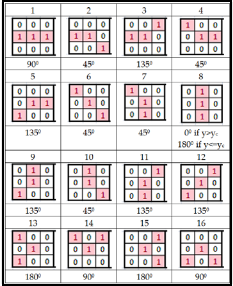
If the coordinate value Xc (Centroid of object) is lesser than X (coordinate) of the coordinate then movement will be along,
TABLE 4
DIRECTION OF TRAVERSAL W HEN XC IS LESSER THAN X
IJSER © 20 13 http://www.ijser.org
International Journal of Scientific & Engineering Research, Volume 4, Issue 6, June-2013 2878
ISSN 2229-5518
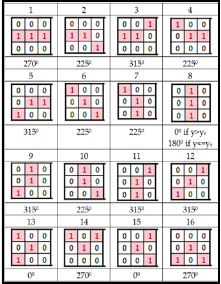
TABLE 5
DIRECTION OF TRAVERSAL W HEN Cx IS GREATER THAN OR EQUAL TO XC
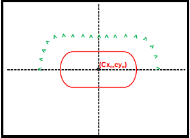
Fig. 8. xc <x
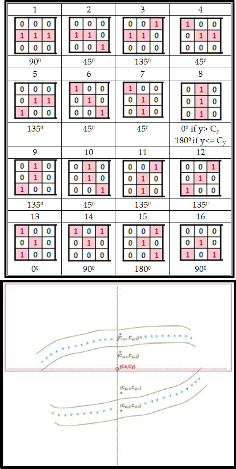
Direction of movement for lines
While determining direction of traversal for line (along the angle specified) it was observed that direction of traversal en- tirely depends on the position of the line in the image. In order to resolve the conflict the Centroid of the entire reference data is taken into consideration along with the Centroid of the line.
Second Consideration:
Fig. 10. Cx >= xc
Fig. 9. Determination of the Centroid
On analyzing the problem it was observed that the movement has to always directed outwards from the lines depending on the Centroid of the image and the Centroid of the line
The following 3x3 16 masks were designed taking into consid- eration different possible orientation in order to determine movement,
First Consideration:
If the coordinate value Cx (image) is greater than or equal to Xc
(line) of the coordinate then movement will be along,
If the coordinate value Cx (image) is lesser than XC (line) of the coordinate then movement will be along,
TABLE 6
DIRECTION OF TRAVERSAL W HEN Cx IS LESSER THAN XC
IJSER © 20 13 http://www.ijser.org
International Journal of Scientific & Engineering Research, Volume 4, Issue 6, June-2013 2879
ISSN 2229-5518
Fig. 13. Directions of movement
The problem of Hit and Miss
Movement from a particular location may be either angular or along the axis’s. While traversing along the axis’s the movement would definitely hit a significant value or the boundary coordinate but would not miss a coordinate with significant value. Hence the interpolated value would repre- sent the actual intermediate value as represented in Fig. 14 where the pixel in green represent the starting point, the pixels in pink represents the intermediate stopping point and the pixels in blue represent the interpolated value.
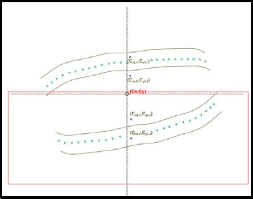
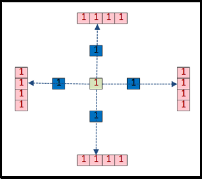
Fig. 14. Movement along axis’s
Direction of movement
Fig. 11. Cx < xc
Whereas, while traversing along the angles, the chances of hitting and missing a significant value is equally likely. Hence the interpolated value may represent the actual intermediate value in case of hit or it may represent false intermediate value
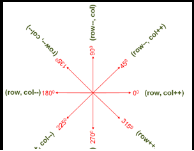
In case of either type of objects the movement considered is along 00,
450, 900, 1350, 1800, 2250, 2700 and 3150.
• in order to move towards 00 only the column is incremented
• in order to move towards 450 the row is decremented and the column is incremented
• in order to move towards 900 only the row is decremented
• in order to move towards 1350 the row is decremented and the column is also decremented
• in order to move towards 1800 only the column is decre- mented
• in order to move towards 2250 the row is incremented and the column is decremented
• in order to move towards 2700 only the row is incremented
• in order to move towards 3150 the row is incremented and the column is also incremented
until a significant value is encountered or the bound is not reached.
as a consequence of miss. As represented in Fig. 15 the pixel in
green represent the starting point, the pixels in pink represents
the intermediate stopping point and the pixels in blue repre-
sent the interpolated value. As a consequence of miss the in-
terpolated values are wrongly placed.
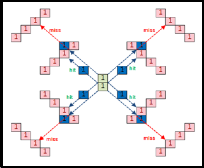
Fig. 15. Movement along axis’s with hit and miss.
In order to resolve this problem for angular movement an enhanced mask is to be designed that takes into consideration additional coordinates for determining the intermediate stop-
IJSER © 20 13 http://www.ijser.org
International Journal of Scientific & Engineering Research, Volume 4, Issue 6, June-2013 2880
ISSN 2229-5518
ping point for interpolation along the direction of the tra- versal. Fig. 16 represents the approach designed to overcome miss in case of angular movement.
(a) (b)
(c) (d)
Fig. 16. Design of mask to eliminate miss.
This mask prevents miss and thus results in generation of actual interpolated value.
3.6 Reconstruction of broken lines
After the process has successfully interpolated the value us- ing the advanced masks the broken generated lines are to be reconnected to create continuous contour lines.
For creating continuous contour from the set of interpolat- ed values it is mandatory to store the interpolated values in sequence in-order to preserve correctness. A data structure was used to store successively interpolated value and the re- connection point was determined by analyzing the successive values in the data structure i.e. if the difference of x’s and dif- ference of y’s of successive stored values sum yields value greater than 2 then there reconnection is required.
4 RESULTS
TABLE 7
INTERPOLATION STEPS
5 CONCLUSION
Automatic reconstruction of feature plays a significant role in GIS based application for improvised data representation. Recreation of features plays a significant role especially in sit- uation where the scale at which the reference data is repre- sented is very high. This work aims at generating intermediate contour lines by creating various orientation masks followed by assignment of movement directions in accordance with the position of the coordinate at the center of the mask with refer- ence to the Centroid. An enhanced mask was also designed for angular movement to overcome the problem of miss. The spi- ral data traversal scheme adds to the ability of the process to efficiently identify features. The process thus implements suc- cessfully interpolates lines in between existing lines to over- come stair case effect by reducing the stair size.
IJSER © 20 13 http://www.ijser.org
International Journal of Scientific & Engineering Research, Volume 4, Issue 6, June-2013 2881
ISSN 2229-5518
REFERENCES
[1] FEI Lifan, HUANG Lina, HE Jin, “An Indirect Generalization of Contour Lines Based on DEM Generalization using the 3D Douglas-Peucker Algo- rithm”, The International archives of the Photogrammetry, Remote Sensing and Spatial Information Sciences. Vol. XXXVII. pp-751-755 Part B1. Beijing
2008 . (Conference proceedings)
[2] A. P. Ozah, O. Kufoniyi, “Accuracy Assessment of Contour Interpolation
from 1:50,000 Topographical Maps and SRTM Data For 1:25,000 Topo- graphical Mapping”, The International archives of the Photogrammetry, Remote Sensing and Spatial Information Sciences. Vol. XXXVII. pp- 1347-
1354, Part B7. Beijing 2008. (Conference proceedings)
[3] Gill Barequet, Michael T. Goodrich,Aya Levi-Steiner, Dvir Steinerd, “Con- tour Interpolation By Straight Skeletons”, Graphical Models Vol. 66 (2004) pp- 245–260 (Journal)
[4] Chin-Shung Yang, Szu-Pyng Kao, Fen-Bin Lee, Pen-Shan Hung, “Twelve Different Interpolation Methods: A Case Study of SURFER 8.0” XXth IS- PRS Congress Technical Commission II July 12-23, 2004 Istanbul, Turkey, pp- 778-785 . (Conference proceedings)
[5] Chao-Hsiung Wu, William Mackaness, “ Automatic Contour Labeling for
Scanned Topographic Maps” XVIIth ISPRS Congress Technical Commis- sion IV: Cartographic and Data Base Applications of Photogrammetry and Machine Vision August 2-14, 1992, Washington, D.C., USA PP-665-269 (Conference proceedings)
[6] http://stlab.iis.u-tokyo.ac.jp/~wataru/lecture/rsgis/giswb/vol2/cp3
/cp3-4. htm(Link).
[7] Jianyun Chai,Takaharu Miyoshi, Eihachiro Nakamae, “Contour Interpola-
tion and Surface Reconstruction of Smooth Terrain Models” Visualization
'98. Proceedings 1998 , Page(s): 27 – 33 (Conference proceedings)
[8] Michael B. Gousie Wm. Randolph Franklin, “Constructing a DEM from Gridbased Data by Computing Intermediate Contours” Proceedings of the Eleventh ACM International Symposium on Advances in Geographic In- formation Systems, November 7–8, 2003, New Orleans, Louisiana, USA (Conference proceedings)
[9] Mohan P. Pradhan, M.K. Ghose, “Automatic Association of Stream Order for Vector Hydrograph Using Spiral Traversal Technique”, IOSR Journal of Computer Enginering, Volume 1, Issue 5, pp 09-12, 2012. (Journal)
[10] Türkay Gökgöz1, Mehmet Selçuk, A New Approach for the Simplification of Contours, Cartographica: The International Journal for Geographic In- formation and Geovisualization, University of Toronto Press, Volume 39, Number 4 / Winter 2004, pp-37-44. (Journal)
IJSER © 20 13 http://www.ijser.org