
Temperature Range (deg C ): Summer: Max 39.4ºC, Min 23.3ºC Winter: Max 32.8ºC, Min 20.7ºC Rainfall: Normal : 327mm(NE monsoon) 192.9mm (SW monsoon) Actual : 205.4mm(NE) and 90.1mm (SW).
The research paper published by IJSER journal is about LandUse LandCover change detection Using Remotely Sensed data for coimbatore district,india 1
ISSN 2229-5518
LANDUSE LANDCOVER CHANGE DETECTION USING REMOTELY SENSED DATA FOR COIMBATORE DISTRICT,INDIA
Assistant professor, Department of CSE, PPG Institute of Technology, Coimbatore,India. ybkalps@gmail.com
Dr.K.Thanushkodi
Director, Akshaya College of Engineering & Technology, Coimbatore,India.
Many innovative techniques can be used to create dramatic images of Land sat data combined with other kinds of remotely sensed or ground-based data. Digital elevation models (DEM) are especially useful in this regard. DEMs may be displayed as contour maps, block diagrams, or shaded-relief images. Possible combinations include:
Land sat image draped over DEM block diagram; perspective view of the landscape with color coding from Land sat image. Land sat image added to shaded-relief image; enhancement of topography visible in Landsat image.
Separation of water and land areas; color-coded DEM to show bathymetry of water bodies; land areas depicted by remotely sensed data (Shanks 1992).
Any of these approaches requires considerable computation, in which the remotely sensed data must be rectified for accurate fit onto the ground coordinate system of the DEM. Resampling of pixel size, shape, and position may be necessary. The effort necessary to produce such merged images is well worth the investment of time. Landsat/DEM images may be particularly valuable for geomorphic interpretation.
National Remote Sensing Agency(NRSA) Govt. of India has devised a generalized LULC classification system respect to the Indian conditions based on the various categories of Earth surface features , resolution of available satellite data, capabiliti es of sensors and present and future applications.
The environmental factors reflect the importance of land as a key and finite resource for most human activities including agriculture, industry, forestry, energy production, settlement, recreation and water sources and storage. Often improper land use is causing various forms of environmental humiliation. For sustainable utilization of the land ecosystems, it is essential to know the natural characteristics, extent and location, its quality, productivity, suitability and limitations of various land uses. Land use i s a product of interactions between a society’s cultural background, state and its physical needs on the one hand, and the natural potential of land on the other. In order to improve the economic condition of the area without further deteriorating the bio environment, every bi t of the available land has to be used in the most rational way. This requires the present and the past land use/land cover data of the Coimbatore district.
Keywords: Land cover, high resolution, profusion information, multi-scale amalgamation, change detection, Remote sensing images.
IJSER © 2012 http://www.ijser.org
The research paper published by IJSER journal is about LandUse LandCover change detection Using Remotely Sensed data for coimbatore district,india 2
ISSN 2229-5518
Land use / Land cover change has become an important component in current strategies for managing natural resources and monitoring environmental changes. The advancement in the concept of vegetation of the spread and health of the world’s forest, grassland and agricultural resources has become an important priority. Viewing the earth from space is now crucial to the understanding of the influence of man’s activities on his natural resource base over time. Over past years, data from Earth sensing satellites has become vital in mapping the Earth’s features and infrastructures, managing natural resources and studying environmental change.
The LULC classification system is designed according to the following criteria:-
1. The minimum level of interpretation accuracy using remotely sensed data should be at least 85%.
2. The accuracy of interpretation for the several categories should be about equal. For this paper 2003 and 2008 data have been taken for classifying.
3. Repeatable results should be obtainable from one interpreter to another and from one time of sensing to another
4. The classification system should be applicable over extensive areas.
5. The categorization should permit land use to be inferred form the land cover types.
6. The classification system should be suitable for use with remote sensor data obtained at different times of the year.
7. Categories should be divisible into more detailed sub categories that can be obtained from large-scale imagery or ground surveys.
8. Aggregation of categories must be possible
9. Compression with future land use land over data should be possible.
10. Multiple uses of land should be remitted when possible.
For efficient planning and management, the classified data in a timely manner, in order to get the classified data of the ground; satellites are the best resources to provide the data in a timely manner.
Significance is that the data can be acquired by our eyes and the energy can be analyzed. But satellites are capable of collecting data beyond the visible band also. This will help us to analyze the new things which are not possible in visible band[3].
Climate: Tropical
Temperature Range (deg C ): Summer: Max 39.4ºC, Min 23.3ºC Winter: Max 32.8ºC, Min 20.7ºC Rainfall: Normal : 327mm(NE monsoon) 192.9mm (SW monsoon) Actual : 205.4mm(NE) and 90.1mm (SW).
IJSER © 2012 http://www.ijser.org
The research paper published by IJSER journal is about LandUse LandCover change detection Using Remotely Sensed data for coimbatore district,india 3
ISSN 2229-5518
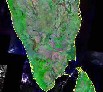
Fig. Study Area of Coimbatore district
The process includes image acquisition, image enhancement, segmentation, Clustering and classification, data modeling etc.
Below, the maps show the locations of ground stations operated by USGS International Cooperators (ICs) for the direct downlink and distribution of Landsat 7 (L7) and/or Landsat 5 (L5) image data. The red circles show the approximate area over which each station has the capability for direct reception of Landsat data. The green circles show the components of the U.S. Geological Survey (USGS) ground station network, while the dashed circles show stations with dual status.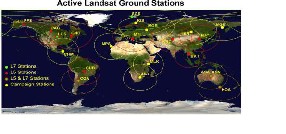
Many innovative techniques can be used to create dramatic images of Land sat data combined with other kinds of remotely sensed or ground-based data. Digital elevation models (DEM) are especially useful in this regard. DEMs may be displayed as either contour maps, block diagrams, or shaded-relief images. Possible combinations include:
Land sat image draped over DEM block diagram; perspective view of the landscape with color coding from Land sat image. Land sat image added to shaded-relief image; enhancement of topography visible in Land sat image.
To correct distorted or degraded image data to create a more faithful representation of the original scene, image rectification and restoration process is necked which is always termed as preprocessing.
The preprocessing include : ![]() Determining ROI
Determining ROI![]() Convert the real image to gray-scale . This is to
Convert the real image to gray-scale . This is to
limit the computational requirements. ![]() Histogram stretching.
Histogram stretching.
An edge is a set of connected pixels that his on the boundary between two regions, Edge detection is performed on the image by the construction of edge detection operators like sobel edge detection, laplacian edge operator etc. Here in this paper , the canny edge detection methodology is taken with a little change. For a continuous image f(x,y), where x and y are the row and column coordinates respectively, consider 2D derivatives δyf(x,y) and δxf(x,y) . Two functions can be expressed :
1. Gradient magnitude
IJSER © 2012 http://www.ijser.org
The research paper published by IJSER journal is about LandUse LandCover change detection Using Remotely Sensed data for coimbatore district,india 4
ISSN 2229-5518
| Δf(x,y) | = √ ( ∂x f(x,y)) 2 + ( ∂y f(x,y) )2
2. Gradient orientation
∟Δf(x,y) = ArcTan (∂y f(x,y) /∂x f(x,y) )
Local maxima of the gradient magnitude identify edges in f(x,y). The first derivative achieves a maximum and the second derivative is zero. For this reason, an alternative edge detection strategy is to locate zeros of the second derivatives of f(x,y) [2].
edge detection for thondamuthur image
The Algorithm can be developed based on the following criteria:
Step 1. Detection : The probability of detecting real edge points should be maximized while the probability of falsely detecting non-edge points should be minimized. This corresponds to the maximizing the signal-to-noise ratio.
SNR = N/√N where N is the mean and √N is the standard
deviation.
2. Localization : The detected edges should be as close as to the real edges of the image.
3. Number of responses : Only one response is there for the one real image.
The clustering technique attempts to access the relationships among patterns of the LANDSAT data set by organizing the patterns into groups or clusters such that patterns within a cluster are more similar to each other than patterns belonging to different clusters. That is , clustering refers to the classification of objects into groups according to certain properties of these objects. In a clustering technique , an attempt is made to extract a feature vector from local areas in the images as Fig 1,2,3,4. A standard procedure for clustering is to assign each pixel to the class of the nearest cluster mean.There are numerous clustering algorithms that can be used to determine the natural spectral groupings present in a data set. One common form of clustering, called the “k- means” approach accepts from the analyst the number of clusters to be located in the data[6].
The algorithms then arbitrarily “seeds” or locates that number of clusters centers in the multidimensional measurement space[8]. Each pixel in the image is then assigned to the cluster whose arbitrary mean vector is closet.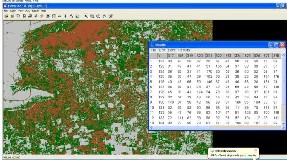
Image segmentation is the partition and pick-up of the homogeneous regions of image. In the results of segmentation, the consistency of gray the smoothing of boundary and the connectivity are fulfilled. The classical method of segmentation is the spatial cleaning based on the measurement space[2].
Image segmentation is crucial processing procedure for the classifications and feature extraction of high resolution remote
IJSER © 2012 http://www.ijser.org
The research paper published by IJSER journal is about LandUse LandCover change detection Using Remotely Sensed data for coimbatore district,india 5
ISSN 2229-5518
sensing image[5]. The segmentation result is able to sway the effect of subsequent processing.
The edge-based segmentation is taken into account which is namely grounded on discontinuity of gray-level in imagery. The image is segmented by the edge of the different homogenous areas[4].
Adopting this method, the accuracy of edge positioning is high whereas the consecutive edge composed of a serial of unique pixels cannot produced, so a sequent process including bulky the detected edge points should he requisite.
5. Supervised classification
This requires up-front knowledge of the area in order to provide the compute with unique material groups or what are called “ training classes”. Regions containing a material of interest within a scene are delineated graphically and stored for use in the supervised classification algorithm. The resulting classification maps should be checked using
groundtruth information and field validation surveys if
hyper spectral data cloud[7]. The algorithm is based on the well-known observation that spectra of large, distinct land covers tend to cluster around a mean spectrum.
This is the basis for unsupervised classification parcel on cluster analysis[2]. The pixel density around the mean spectrum depends on the spectral variability of the land cover and the areas extent of the land cover.
The LANDSAT algorithm is similar to the k-means algorithm with the distinct difference that the LANDSAT algorithm allows for different number of clusters while the k- means assumes that the number of clusters is known a priori.![]()
The objective of the k-means algorithm is to minimize the within cluster variability. The objective function (which is to be minimized) is the sums of squares distances (errors) between each pixel and its assigned cluster center.
where C(x) is the mean of the cluster that pixel x is assigned to.
possible.
Minimizing the SSdistances
is equivalent to minimizing
Normally, supervised classification are more accurate than unsupervised.
Unsupervised classification algorithms compare spectral signatures to the signatures of computer determined clusters and assign each pixel to one of these clusters. Knowledge of the materials contained within the scene is not needed beforehand as the computer assess the inherent variability and determines cluster identification. Classified distribution maps then require knowledge of the scenec area in order to determine what each class may represent in the real world.
The unsupervised classification algorithm is designed to automatically said dense regions within the n-dimensional
the Mean Squared Error (MSE). The MSE is a measure of the within cluster variability.
where N is the number of pixels, c indicates the number of clusters, and b is the number of spectral bands[13].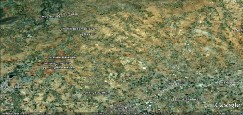
IJSER © 2012 http://www.ijser.org
The research paper published by IJSER journal is about LandUse LandCover change detection Using Remotely Sensed data for coimbatore district,india 6
ISSN 2229-5518
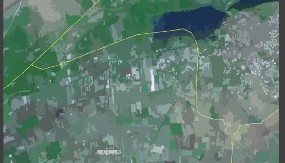
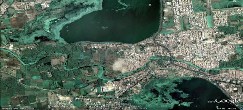
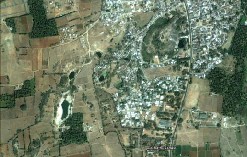
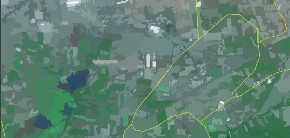
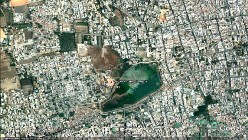
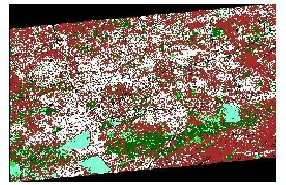
Fig. 1 to 4 . Different images of Coimbatore district 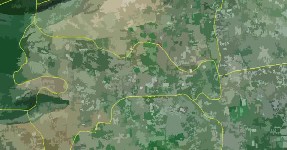
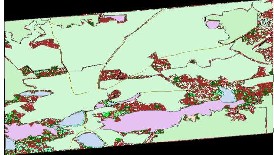
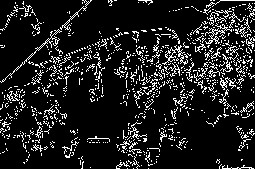 Fig.6. Segmented image
Fig.5. Edge detected image
IJSER © 2012 http://www.ijser.org
The research paper published by IJSER journal is about LandUse LandCover change detection Using Remotely Sensed data for coimbatore district,india 7
ISSN 2229-5518
LAND COVER | HECTARES |
Water | 21870 |
Agriculture | 64707 |
Residential area | 74500 |
Grassland | 200000 |
Dry land | 4923 |
Forest | 6782 |
Industries | 100000 |
Total | 472782 |
Findings:
• Land is an essential factor of production.
• It has been tightly coupled with economic growth.
• Land is becoming a scarce resource due to immense agricultural and domestic pressure.
• Hence, information about LULC is necessary for planning & implementing of LU schemes
• Since the agricultural area is going down in their surface and it is found that the sold area becomes the residential surface.
• This paper assists in monitoring the dynamic land use resulting out of change in increasing population.
• It is found that the residential area has its growth spontaneously. Hence the under earth water ratio is going very down.
• It is done using various algorithms in Image processing & remote sensing.
The remote sensing data have been analyzed to fixed the land cover classification of our district, and to know how the use of land changes according to time and also performed the temporal analysis to analyze[3] all these things, the unsupervised classification method is used. This is very fast and useful analysis method. It is widely used for the crops[10] classification in the world and this classification method is used for land cover and land use because vegetation components are important in the images[9].The basic axis is also to preserve the greenery of the city for the healthy environment.
The authors are grateful to the Director , IRS, Anna university,Chennai who helped in this excellent work. The authors are thankful to Anna university Research centre delegates who helped them in all this work since 2007.![]() Mrs. Y.Baby Kalpana is a research scholar. She is pursuing in Anna university of Technology, Coimbatore under
Mrs. Y.Baby Kalpana is a research scholar. She is pursuing in Anna university of Technology, Coimbatore under
the guidance of Dr. K.Thanushkodi. She is currently working
as an Assistant Professor in the Department of computer
IJSER © 2012 http://www.ijser.org
The research paper published by IJSER journal is about LandUse LandCover change detection Using Remotely Sensed data for coimbatore district,india 8
ISSN 2229-5518
Science & Engineering of PPG Institute of Technology,Coimbatore. She has published more than 10 papers in this work in 10 different national and international journals. She has guided more than 15 M.E projects amd 30
B.E projects. She is grateful to the Chairman Dr.L.P.Thangavelu and Correspondant Mrs.Shanthi Thangavelu for their continuous encouragement in pursuing this research work.![]() Dr. K.Thanushkodi , is the Director of Akshaya College of Engineering & Technology , Coimbatore . He worked as the Principal, Government college of Engineering, Bargur and
Dr. K.Thanushkodi , is the Director of Akshaya College of Engineering & Technology , Coimbatore . He worked as the Principal, Government college of Engineering, Bargur and
as a Principal of CIET , Coimbatore. He has got 30 ½ yrs of teaching experience in Government Engineering Colleges Has published 45 papers in International Journal and Conferences. Guided 1 Ph.D and 1 MS (by Research), Guiding 15 Research Scholars for Ph.D Degree in the areas of Power System Engineering, Power Electronics, Computer Networking & Virtual Instrumentation and One Research Scholar for MS (Research). Principal in-charge and Dean, Government College of Engineering, Bargur Served as Senate Member, Periyar University, Salem. Served as member, Research Board, Anna University, Chennai. Served as Member, Academic Council, Anna University, Chennai Serving as Member Board of Studies in Electrical Engineering, Anna University, Chennai. Serving as Member, Board of Studies in Electrical and Electronics & Electronics and Communication Engineering, Amritha Viswa Vidya Peetham, Deemed University, Coimbatore. Serving as Governing Council Member SACS MAVMM Engineering College, Madurai.
1.Y.Babykalpana Supervised/Unsupervised Classification of LULC Using Remotely Sensed data, Paper-ID : iCIRET-0106, CiiT Internationals Journals-iCIRET-2010
2. Y.Babykalpana , Dr. K.ThanushKodi , Classification of
LULC change detection using Remotely sensed data
Coimbatore city , India ,Journal of Computing, Volume 2, Issue 5, May 2010.
3.Jifen Liu, Maoting Gao, “ An Unsupervised Classification Scheme Using PDDP method for network Intrusion Detection”, 978-0-7695-3497-8/08, IEEE transactions
2008,vol 8, pp. 658-662.
4.John Cipar,R.L.Wood, T.Cooley,” Testing an Automated Unsupervised Classification Algorithm with Diverse Land covers”, 1-4244-1212-9/07,IEEE Transactions 2007, vol.1, pp.
2589-2592.
5.LI.Jia-cun, QIAN Shao-meng, CHEN Xue,” Object Oriented Method of Land Cover Change Detection Approach Using High Spatial Resolution Remote Sensing Data”, vol 3, IEEE transactions 2003, pp. 3005-3007.
6.S.K.Srivastava,H.K.Singh, A.K.Sinha , “ Agriculture land estimation from Satellite Images Using Hybrid Intelligence: A case study on Meerut City”, IJCSKE, Vol 3, no1, Serials publications, Jan-June’09.
7.Thomas M.Liiesand, R.W.Kiefer, “ Remote sensing and Image Interpretation”, 4th edition, John Wiley & sons , Inc., pp. 473-488, 532-558.
8. Yokoyama, Kurosu T., SHI., and Fujita, M., 2001: Land use classification with textural analysis and the aggregation technique using multi-temporal JERS-1 L -band SAR images. International Journal of Remote Sensing, 22, No. 4, pp. 595 -
613.
9..http://www.gisdevelopment.net/tutorials/software/index.htm
10..http://www.csc.noaa.gov/crs/lca/faq_gen.html#WIRS
11.http://www.eicinformation.org/data/requestform.asp?id=0
12.http://books.google.co.in/books?id=JeDGn6Wmf1kC&pg= PA376&lpg=PA376&dq=clustering+techniques+in+dip
13. http://www.yale.edu/ceo/Projects/swap/landcover/Unsupervise d_classification.htm
IJSER © 2012 http://www.ijser.org