International Journal of Scientific & Engineering Research, Volume 6, Issue 1, January-2015 648
ISSN 2229-5518
Kinetic Study of the Methylene Blue Adsorption on White Clay as a Local Absorbent
Egbuna S.O, Ugadu E, Chime T.C
Abstract : The adsorption isotherm and kinetics of the sorption pigment (Methylene Blue) from aqueous solution onto Enugu W hite Clay as a local adsorbent was investigated. The kinetics and isotherm were carried out using batch experiments. The experimental data was analyzed in terms of intra-particle diffusion, rate of adsorption, isotherms and thermodynamics. The results showed that Methylene Blue (MB) adsorption follows second order kinetic model with adsorption rate constant of 0.2279g/(mg.min). The adsorption rate was within about 100 minutes, and 96 percent of the pigment was removed from the solution. The activation energy showed that the MB adsorption was endothermic and that the rate limiting step is surface diffusion. The results indicated that Enugu W hite Clay has good adsorptive potentials and can be used as a local, cheap and effective adsorbent for the removal of pigments from aqueous solutions.
Key Words: Adsorption Isotherm, Adsorption Rate. Diffusion, Kinetics Models, Local Adsorbent, Methylene Blue, W hite Clay,
—————————— ——————————
1.0 INTRODUCTION
Adsorbents are solid substances, usually porous in nature, with a high surface area, that can adsorb chemical substances onto its surface by intermolecular forces, and the process of attracting chemical substances onto the surfaces of adsorbents is adsorption, Warren [1]. Adsorption is present in many physical, biological and chemical systems and is used extensively in industrial processes for the purposes of
adsorption isotherm is that it shows how the adsorbate molecules (Methylene Blue in aqueous solution) is distributed between the solution and the adsorbent (solid) at equilibrium concentration on the loading capacity at different temperatures. Langmuir adsorption isotherm is often used for the adsorption of a solute from a Liquid solution. It is best known of all isotherms describing adsorptions, process, [Nagham][8]. The adsorption isotherm may be expressed as;
separation and purification. The high cost of commercial
adsorbents, especially activated carbon, restricts their uses and

qe =
qo

qeCe
1 + k1Ce
(1)
applications Malik,[2], and hence the need to substitute them
The above equation can be rearranged to the Linear form;
with the unconventional, locally available, cheaper and
environmentally friend adsorbents. The utilization of locally
available materials as a raw material in the production of
Ce =
qe
1

q o k l

+ C e q o
(2)
adsorbents, is in line with Nigeria’s economic transformation agenda.
A wide range of materials have been researched for that purpose, Nde-Age [3], Itodo[4], Kyziol [5]. Adsorption kinetic studies are important in predicting the rate of pollutant removal from aqueous systems. [Michael][6]. provides information for selecting optimum operating conditions, identifying reaction pathways, understanding rate limiting steps and, are also essential for scaling-up of laboratory studies to industrial applications.
Adsorption isotherm or equilibrium data are fundamental requirements for the design of adsorption system. The equilibrium is achieved when the capacity of the adsorbent material is reached, and the rate of adsorption equals the rate of desorption. The theoretical adsorption capacity of an adsorbent can be calculated with an adsorption isotherm.
Although, there are many adsorption isotherms, there are two basically well established types of isotherms; the Langmuir and Freundlich isotherms [Mohammed][7]. The significance of
Where, q e – Amount of adsorbate adsorbed at equilibrium
mg/g, C e – Equilibrium concentration mg/l, kL –Langmuir adsorption constant related to energy of adsorption (L/mg), q o – Maximum adsorption capacity corresponding to complete monolayer coverage (mg/g).
The Linear form can be used for Linearization of experimental data by ploting Ce /q e vs Ce . The Langmuir constants q o and k L can be obtained from the slope and intercept of the Linear plot respectively, [Esmaeli][10].
The freundlieh isotherm is the earliest known relationship describing the adsorption equation, [8]. The work of Freundlich on Liquid solid adsorption led to the formation of the experical equation.
q e = kf Ce ½ (3)
Where, q e = amount adsorbate adsorbed at equilibrium mg/g
Ce = equilibrium concentration mg/L, kf and n are empirical constants depending on several environmental factors and n is greater than one. The Linerized form is obtained by taking logarithm of both sides of the equation (3).
IJSER © 2015 http://www.ijser.org
International Journal of Scientific & Engineering Research, Volume 6, Issue 1, January-2015 649
ISSN 2229-5518
n e n f 1
V

e o e
L q = L k
+ 2 LnCe
(4)
q = (C
m
- C ) (5)
A plot of Ln qe vs Ln C e will be a straight Line, if the data follows Freundlieh adsorption isotherm. The constants can be determined from the slope and intercept of the linear plot [Erdem][11].
In this work,
The physicochemical properties of Enugu White Clay
was determined
The kinetic of MB adsorption by Enugu White Clay,
which is important in predicting the rate of pollutant
removal by the adsorbent was established.
The activation energy for MB adsorption was also
determined.
2.0 MATERIALS AND METHODS
Where, q e - Amount of methylene blue adsorbed at
equilibrium mg/g, V -Initial volume of MB (litre), m–Mass of
adsorbent (2g), Co– Initial concentration of MB mg/L, Ce– Equilibrium concentration of MB mg/L,The experiment was repeated at 40, 50 and 60oC.
2.5 Residence Time Distribution
The effect of contact time on the uptake of MB by Enugu White Clay was investigated at MB concentration of 50mg/L at adsorbent dosage of 2g per 50ML of the MB solution. The experiment was carried out by shaking the adsorbent suspension in the methlene blue solution for 20,40,60,80,100 and 120 minutes. The suspension was filtered and the filtrate analyzed for the residual methylene blue using UV- spectrophotometer at 661nm wave length, a length corresponding to maximum absorbance, and the MB removal efficiency determined.
2.1 Sample Collection and Characterization
The adsorbent for this research is Enugu White Clay collected

% MB removal efficiency qe = (Co - C t )x100
C
(6)
from Enugu in South East providence of Nigeria. The
adsorbent was collected at the peak of dry season (April) and
stored in a polyethylene bag. It was characterized for
moisture and volatile matter contents, fixed carbon, specific gravity, pH value, and bulk density, using standard methods, and the results are shown in tables I to V
2.2 Acid Activation of the Adsorbent
The dry sample of the raw clay was treated with 1.5m H2 SO4 at acid to adsorbent ratio of 1:1. The activation was carried out in a around bottom flesk. The slurry was continuously stirred at a temperature of 90oC for 3 hours. When activation was completed, the slurry was filtered and washed several times with distilled water until neutral PH was obtained. The sample was dried at 105oC to reduce moisture content. The dry sample was stored in an air tight container.
2.3 Methylene Blue Solution Preparation
A stock soludion of 100 mg/L was prepared by dissolving 1g of methylene blue in 1000cm3 (Litre) of distilled water. The desired concentrations for adsorption were made by dilution of the stock solution.
2.4 Methylene Blue Adsorption
The adsorption was carried out using batch adsorption method of [7]. A fixed amount of adsorbent (2g) was mixed with 50ml of MB solution with initial concentrations of 50 mg/L, 90 mg/L, 110mg/L and 150 mg/L at 30oC. The system was agitated for 2hours, and the resultant solution filtered. The filtrate was analyzed with UV-spectrophotometer for the residual MB. The uptake of MB was calculated from the relationship, as given by, [Volesky] [12].
The uptake of MB was calculated from [6], with the relationship given by;
q t = v (C0 – Ct ) (7)
Where q t = MB adsorbed at time t (mg/g), v = Initial volume of MB (Litre), m = Mass of adsorbent used (2g), Co =Initial concentration of MB mg/L, Ct = Concentration of MB at time t
> 0 mg/L
3.0 RESULTS AND DISCUSSION
The physicochemical properties of an adsorbent usually affects its adsorptive capacity, since they have profound influence on the specific surface area. The physicochemical properties of white clay is shown in table I.
Table I The physicochemical properties of white clay, Egbuna et al[13].
IJSER © 2015 http://www.ijser.org
International Journal of Scientific & Engineering Research, Volume 6, Issue 1, January-2015 650
ISSN 2229-5518
It was observed that natural white clay was ideal in terms of non-clay residue, moisture content, ignition loss and titrable acidity, but low in bulk density.[13], also noted that physical properties of clay influence their ability to adsorb carotenoids. Nutting,[14], Richandson,[15], indicated that low misture content is an indication of good adsorptive capacity. Low ignition loss and non clay residue of the white clay, indicate that the clay is free from inorganic substances which would naturally hinder its adsorptive properties. Soon,[16], in his experiment on natural clays observed that high level of S1 O2 (about 65%), in a clay sample proves it to be montmorillonite, and hence, the chemical properties of the clay presented here as analyzed, proved it to be montmorillonite.
3.1 Resident Time
The residence time is presented in table II as a function of concentration, and removal efficiency.
Table II, Residence Time
3.2 Kinetic Treatment of the Sorption Process
The kinetic treatment of the experimental data was discussed in terms of intra-particle diffusion and the rate of adsorption.
From table II it was observed that the rate of MB adsorption was faster at the residence time of 20 to 60 min. and becomes slower towards equilibrium. This is obvious from the fact that large number of recent surfaces were available for adsorption at the initial stage. After some time, the remaining vacant sites become difficult to be occupied due to repulsive forces between the absorbate molecules on the adsorbent and the bulk phase. Table II, also indicates an increase in the percentage removal efficiency of the methylene blue. This may be attributed to the fact that longer residence time means time until about 100 minutes when, the adsorptive removal of MB reached equilibrium.
According [10], a long contact time is necessary to reach equilibrium indicating that the predominant mechanism is physical adsorption, and hence, the relatively long contact time observed for the MB removal by Enugu White Clay.
more complete adsorption. The data showed a rapid drop in the amount of initial MB concentration remaining after each
3.3 Intra-Particle Diffusion
Besides adsorption on the outer surface, there is also possibility of intra-particle diffusion from the outer surface into the pores of the adsorbent. The possibility of intra- particle diffusion was explored based on the weber-morris model equation [Michael][6].
qt = Kd t½ + C (8)
According to Weber, [17], if the weber-morris plot of qt vs t½ gives a straight line, then the adsorption process is controlled by surface diffusion only. However, if the data exhibit multi- liner plots, two or more steps influence the adsorption process. The mathematical dependence of the adsorbate uptake on t½ is shown in figure 1.
IJSER © 2015 http://www.ijser.org
International Journal of Scientific & Engineering Research, Volume 6, Issue 1, January-2015 651
ISSN 2229-5518
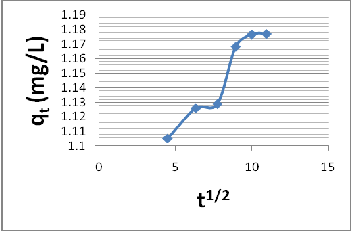
Fig, 1 Plot of adsorbate uptake qt against t1/2
The plot shows a curvature for the initial period, usually attributed to boundary layer diffusion effects [McKey[18] and Strivastave, [19]. The multilinearily of the plots indicates the presence of two or more steps taking place. The first sharper portion is the instantaneous adsorption stage (External adsorption), the second portion is the gradual adsorption stage where intra particle diffusion is the rate limiting, and the third portion is the final equilibrium stage, where intra- particle diffusion starts to slow down due to extremely low MB left in the solution. [Michael][6], carefully examination of the plot observed that the third stage is the limiting step. Extrapolation of the plot, gives the intercept, which provides the measure of the boundary layer thickness. Kannan [20], noted that the larger the value of Ct, the greater the boundary effect.
3.4 Adsorption Rate Constants
The sorption kinetic of the experimental data was evaluated in terms of the rate of adsorption. The adsorption constants were evaluated using the following kinetic models.
3.5 Kinetic Model
Near linear fit was observed, indicating that the kinetic
model may be approximated by first order kinetic mode. The rate constant and co-efficient of determination are presented in table III.
Pseudo-First order kinetic model
The pseudo first order kinetic was examined by the differential equation of [6]
First Order Models: The sorption kinetic may be described

d 2t =
dt
kp (qe
− qt )
(11)
by a simple first order equation. The change in bulk
concentration of the system was done using the simple first order rate equation.
Ct = Co ekt (9)
Understanding the above equation for the boundary condition t = 0 and q t = q e
t
This can be re-arranged to obtain the linear form

Log(qe − qt ) = Logqe − Kp
2.303
(12)
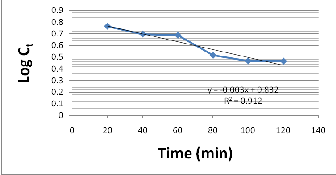
LogCt =

K1t
2.303
+ LogCo
(10)
Where, q 1 = amount of solute adsorbed at equilibrium
(mg/g), q t = amount of solute adsorbed at time t (mg/g)
Where, Co and Ct are the initial and finalconcentrations of
the solute at time t in (mg/t), K1 = first order rate constant
(mm-In order to obtain the rate constant, a straight line plot of log Ct vs t at 30oC was made as shown in figure 2.
kp = pseudo first order equilibrium adsorption constant
(min-1), t = time
In order to obtain the rate constant, linear plot of log (q -q )
e t
vs t was made, (Fig. 3).
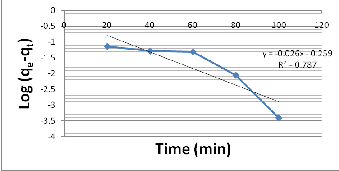
Fig. 2 Plot of log ct vs t at 30oC
IJSER © 2015 http://www.ijser.org
Figure 3 Pseudo – 1st order kinetic model.
International Journal of Scientific & Engineering Research, Volume 6, Issue 1, January-2015 652
ISSN 2229-5518
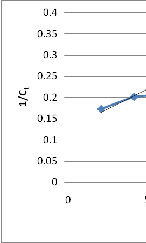
Table III, Rate law constants and activation energy for the adsorption of MB by Enugu White Clay
1st Order | Pseudo 1st order | 2nd order | Pseudo second order |
K1 | -0.00678 | Kp | -0.0576 | K2 (L/(mg.mm) | 0.0021 | Kp2 (g/(mg.mm) | 0.2279 |
Co | 6.531 | q e (mg/g) | 0.5012 | Ce (mg/L) | 7.4174 | q e (mg/g) | 1.2093 |
R2 | 0.912 | R2 | 0.787 | R2 | 0.893 | R2 | 0.999 |
| | | | | | E (J/Mil.k) | 303.49 |
Second Order Kinetic Model:
The typical second order rate equation [Octave][21], was used.
Fig. 4 Linear plot of 1/Ct vs t
Near Linear fit was observed indicating that the kinetic
model may be approximated by the second order kinetic model. The adsorption rate constant and coefficient of determination are presented in table III.

dC t dt
= k2C2
(13)
Pseudo-Second Order Kinetic Model
Here, it is assured that the adsorption capacity is proportional to the number of binding sites occupied on the adsorbent, [Horsfall][22], and the kinetic model becomes,
Integrating when Ct = 0, t = 0 and Ct = Ct at t = t
dq t
Implies that


1 = k2t + 1
(14)

= kp (qe − qt )2 dt
(15)
C t C D
Co and Ct (mg/L) are initial and final concentration of solute.
Integrating for boundary conditions t = 0, q t = 0, and t = t, when q t = q t and re-arranging,
In order to obtain the rate constant K2 , linear plot of 1/Ct vs t was made as shown in figure 4.
t =


1 + t
2 q e
(16)
q t k p 2q e
Where, t = time (minutes), qt amount adsorbed at time t, in (mg/g), kp2 pseudo 2nd order rate constant [mg/(g.min)], q e amount adsorbed at equilibrium (mg/g). The initial
absorption rate as t→0 can be defined by the Ho-constant (h0 )
(Ho )[23] as
ho = kp2 q2 e (17)
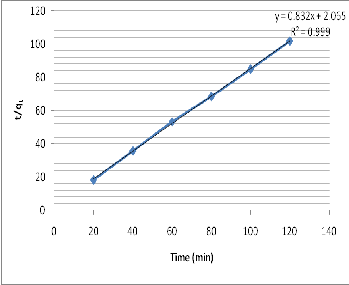
The Linear plot of t/q t vs t is shown in figure 5.
IJSER © 2015 http://www.ijser.org
International Journal of Scientific & Engineering Research, Volume 6, Issue 1, January-2015 653
ISSN 2229-5518
Fig. 6 linear plot of qt vs Ln t
None linear fit was observed, indicating that the MB
adsorption cannot be approximated by elovic kinetic model.
3.6 Evaluation of Activation Energy
The pseudo second order adsorption rate constant was used to evaluate the activation energy using an Arrhenius form equation [6],
Kp2 = ho exp (-∑/RT) (20)
Fig. 5 Linear plot of t/qt vs t
The initial adsorption rate, ho , the equilibrium amount
adsorbed, q e , the pseudo-second order rate kinetic kp2 and
the coefficient of determination r2 were determined and
presented in table III.
Figure 5 shows that the MB absorption by Enugu White
Clay can be appropriately approximated by the pseudo –
2nd order kinetic model.
Elovic Kinetic Model: In Liquid phase adsorption reaction,
the rate decreases with time due to an increase in surface coverage. One of the most useful models for describing such condition is the elovic model, [6],
Kp2 pseudo second order rate constant, ho initial pseudo second order rate constant, ∑ activation energy, R gas
constant (8.314 J1K.Mol) T absolute temperature (303K or
30oC).
The value of E, was computed from the above equation and presented in table III.The activation energy is positive indicating endothermic reaction. That is, the adsorption of Methylene Blue by Enugu White Clay is favoured, Octave,[20] noted that the reactions with high activation energies are more temperature sensitive than those with lower activation energies. Therefore, the lower activation energy observed for MB adsorption by Enugu White Clay means that its sensitivity to temperature may not be too high.
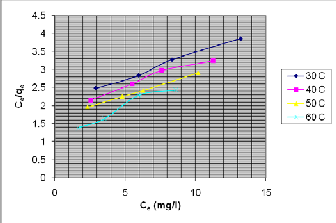
3.7 Sorption Isotherms for Mb Adsorption By Enugu White
Clay
The adsorption isotherms were studied at different temperatures of 30, 40, 50 and 60oC. The experimental data

dq t
d t
= ∝ β exp (- β q t ) (18)
were investigated using Langmuir and Freundlich, adsorption isotherms, Fig 7
Integrating and rearranging at q t = 0, + = 0,

q = 1 Ln(αβ ) +
t β
1Lnt

β
(19)
The applicability of the Elovic model to the experimental data was tested by the linear plot of q t vs Ln t, (Fig.6)
Figure 7, The Langmuir adsorption isotherms.
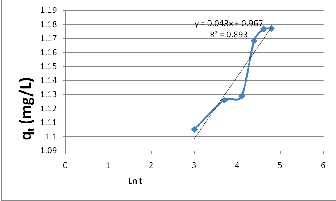
Figure 7, shows the Langmuir adsorption isotherms. The
values of q 0 and kL at different temperatures were obtained
IJSER © 2015 http://www.ijser.org
International Journal of Scientific & Engineering Research, Volume 6, Issue 1, January-2015 654
ISSN 2229-5518
for the linear plot of Ce /q e vs C e and tabulated in table IV.
LnK


= ΔS − ΔH
(23)
The plot of Ln q e vs L n Ce is shown in figure 8.
d
R RT
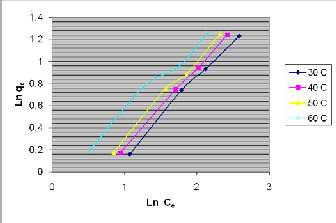
Fig. 8 The plot of Ln qe vs Ln C e
The Freundlich constants k f and n, which indicate the adsorption capacity and intensity were calculated from the slope and intercept of the plot as shown in table IV.
kd is the ratio of the amount adsorbed (mg/g) to the adsorptive concentration (mg/L).
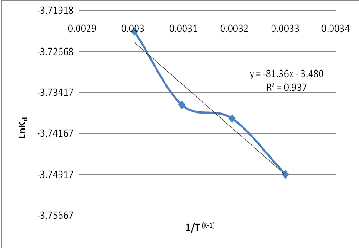
R is the universal gas constant, T is absolute temperature. The linear plot of Ln Kd vs 1/T is shown in figure 9.
Fig. 9: Graph of Ln Kd Vs 1/T
The enthalpy change (∆H) and entropy change (∆S) were calculated from the slope and intercept of the linear plot and presented in table V. The entropy change at different temperatures was evaluated from equation 21 and presented in table V. The negative value for entropy change indicate decrease in the degree of freedom. The positive value of the free energy indicate non-spontaneous process.
Table V
Table IV: Langmuir and Fredindlich adsorption Isotherms constants with their correlation coefficients.
It was observed that k f increases with temperature. The
L 0
increase in the values of kf with increases in temperature
confirm, that the MB adsorption was favoured by temperature. From table IV, it can be seen that the correlation factor r2 is close to unity for both models, indicating that the experimental results can be
/n R
approximated by Langmuir or Freundlich Isotherm.
In order to understand the nature of the adsorption of MB
by Enugu White Clay very well, thermodynamic parameters such as free energy change, (∆G) enthalpy change (∆H) and entropy change (∆S) were evaluated.
These parameters for the adsorption were evaluated by considering the equilibrium constants under different experimental conditions. They were calculated using the following equations [Sirichote][24]
∆G = - R Ln Kd (T) (21)
∆G = ∆H - T∆S (22)
Combining the two equations and rearranging,
4.0 CONCLUSION
The results show that Enugu White Clay could be used as an effective adsorbent for the removal of pigments like methylene blue from aqueous solution. The removal efficiency was very high and fast. The kinetic of methylene blue adsorption can be best approximated to pseudo second order kinetic model.The equilibrium isotherm for the MB adsorption agrees with both langmuir and Freumlich isotherm and the adsorption was favoured by increase in temperature.
5.0 REFERENCES
[1] Warren, L.M., Jullian, C.S and Peter, H., 2001. Unit Operation of Chemical Engineering, 6th Edition, McGraw Hill Book Co-Singapore.
IJSER © 2015 http://www.ijser.org
International Journal of Scientific & Engineering Research, Volume 6, Issue 1, January-2015 655
ISSN 2229-5518
[11] Erdem, E., Karapinar, N. and Donat, R. 2004. The
Removal of Heavy Metal Cations by National Zeolites. Journal of Colloid and Interface Science 280, pp. 309 – 314.
[12]Volesky, B., 1990. Bisorption and Biosorbents in
Biosorption of Heavy Metals. CRC Press: Boca Ration, pp. 3-5.
[2] Malik, R., Ramteke, D.S and Water, S.R. 2006. Physicochemical and Surface Characterization of Adsorbent Prepared from Groundnut Shell by N Zn Cl2 , Activation and its Ability to Adsorb Colour. Indian Journal of Chemical Technology. Vol. 13, pp. 319-328.
[3] Nde – Age, B. J. , Kamga, R, and D, Nguetnkam, j. P.,
2007, Adsorption of Palm Oil Carotene and Free Fatty
Acids onto Acid Activated Cameroonian Clay. Journal of
Applied Science 7 (17); 2462 – 2467.
[4] Itodo, A. V., Abudulrahman,F. W., Hassan, L. G., Margandi., S. A., Itodo, H. U, 2010, Physicochemical Parameters of Adsorbent from locally sorted H3 PO4 and ZnCl2 , modified Agricultural Waste. New York Science Journal. Vol.5, Pp 17 – 24.
[5] Kyziol, J. 2002., Effect of physical Properties and Xation Exchange Capacity of Sorption of Heavy Metals onto Pear. Polish Journal of Environmental Studies, Vol.11, Pp713 –
718.
[6] Michael, H.J and Jose, L.V. 2007. Kinetic Study of Liquid-Phase Adsorptive Removal of Heavy Metal ions by Almond Tree Leaves Waste Bulletin of Chemical Society of Ethiopia, pp 349 – 362.
[7] Mohammed, A.A 2012. Thermodynamic Approach in
Adsorption of Heavy Metals. Muta University Jordan pp
737 – 764.
[8] Nagham A.A., 2010. The Use of Local Sawdust as an Adsorbent for the Removal of Copper Ion from Waste Water using Fixed bed adsorption, Engineering and Technology Journal. Vol. 28 pp 224-235.
[9] Esmaeli, A. Ghasemi, S. and Rustaiyan, A. 2008. Evaluation of the Activated Carbon Prepared from Algae Gracilaria for Biosorption of Cu(II) for aqueous Solution. African Journal of Biotechnology Vol. 7 (12).
[10] Gardea – Torresdey, J.L. Tang, L., Salvador, J. M. 1996. J. Hazard Material 48, pp. 191.
[13] Egbuna S. O 2014, Effects of Thermal Activation on the
Physico-Chemical Properties of Natural White Clay as a Local Adsorbent, International Journal of Engineering and Science Invention, Vol. 2 issue 11, Pp
[14] Nutting, P.G. 1945. Adsorbed Clay, USA Ecological
Survey Bulletin, 928, pp. 127.
[15] Richardson, L.L. 1988, Use of Bleaching Clays in
Processing Edible Fats and Oils. J.AOCS pp. SS, 777-789.
[16] Soon, T.c and Shaw, P.B 1993. Factors Affecting the Stability of Oil During Physical Refining of Palm Oil Laporte, Malaysia.
[17] Weber Jr, W.J.; Digiano, F.O 1996. Process Dynamics in Environmental System, Environmental Science and Technology Series, John Wiley and Sons; New York pp. 89-94.
[18] HO, Y.S, Wase, D.A.J. 1995. Wat Resources 29, 1327.
[19] McKay, G., Offerburn, M.S and Sweeney, A.G. 980. Watt. Resources. pp 14, 15.
[20] Strivastava, V.C.; Swamy, M.M., Mall, I.D Prasad, B. and Mishra, I.M, 2006. Colloids and Surfaces. A. Physicochemical Engineering Aspects 272, 89.
[21] Kannan, K., Sundram, M.M. 2001. Dyes Pigments pp 25-
51.
[22] Octave Levenspiel (2003). Chemical Reaction Engineering, 3rd Edition. John Wiley & Sons (Asia) Pte. Ltd, Singapore.
[23] Horsfall Jr. M., Spiff, A.I 2005. Bulletin of Chemical
Society of Ethopia pp 19-85.
[24] Sirichote, O. Innajitaraw, Chuemchom, L. and Ngweejan,
2002, Songklanakkarin, Journal of Science and Technology;
24(2)
IJSER © 2015 http://www.ijser.org
International Journal of Scientific & Engineering Research, Volume 6, Issue 1, January-2015 656
ISSN 2229-5518
1 Egbuna S.O, 2Ugadu E, 3Chime T.C
1Department of Chemical Engineering, Enugu State University of Science and Technology, ESUT, Enugu.
2Department of Chemical Engineering, Enugu State University of Science and Technology, ESUT, Enugu.
3Department of Chemical Engineering, Enugu State University of Science and Technology, ESUT, Enugu.
IJSER © 2015 http://www.ijser.org