International Journal of Scientific & Engineering Research, Volume 3, Issue 11, November-2012 1
ISSN 2229-5518
Investigation of Physicochemical and
Bacteriological Characteristics of Water Samples
From Irigu River Meru South, Kenya
Ombaka, O; Gichumbi, JM
Index Terms— Water pollution, dissolved solids, electrical conductivity, faecal coliforms, pH, Seasons, Total coliforms
—————————— ——————————
Water is considered absolutely essential to sustain life, since the protoplasm of many living cells contain about 80 percent water and any substantial reduction in this level is disastrous [1],[2],[3],[4],[5]. Most of the biochemical reactions which oc- cur in metabolism and growth of living cells involve the me- dium of water, hence it is referred as the universal solvent [6], [7].Water is required for the satisfactory performance of phy- siological organisms, as circulatory fluid, as carrier of nourish- ing food and for the removal of product wastes [8].
A small percentage of water is available for drinking, bathing, washing laundering, culinary, heating and air conditioning, irrigation, gardening, industrial processing, power
generation, fire fighting ,waste disposal ,fishing ,swimming,
boating and other recreational purposes, navigation, fish and wild life propagation [9],[10].The rest of the water is locked up in oceans as salt water, polar ice-caps, glaciers and under- ground[9].
————————————————
Ombaka, O Department of Chemistry, Chuka University College, Kenya, P.O.Box 109-60400-Chuka. E-mail: ombaka2020@yahoo.com
Gichumbi, JM1 Chuka University College, Kenya, P.O.Box 109-60400-
Chuka.
Every activity of man involves some use of water. Further, as water is often drawn from springs, rivers, lakes which give rise to sites for human habitation and settlement, water has a political significance also [1].
The demands of water supply have been increasing tremend- ously due to increasing industrialization and exploding popu- lation [9].Moreover, considerable part of this limited quantity of water is polluted by sewage ,industrial wastes and a wide array of synthetic chemicals[11],[12].
The menace of water-borne diseases and epidemics still threatens the well being of the population, particularly in un- der-developed and developing countries like Kenya [13],[14].This implies that the quality as well as the quantity of clean water supply is of vital significance for the welfare of mankind.
Therefore, the present study was undertaken to evaluate the levels of physicochemical and microbiological parameters and their seasonal pattern in the water samples from Irigu river and its tributaries.
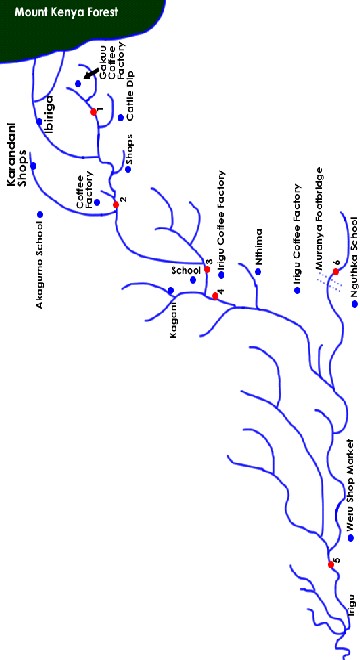
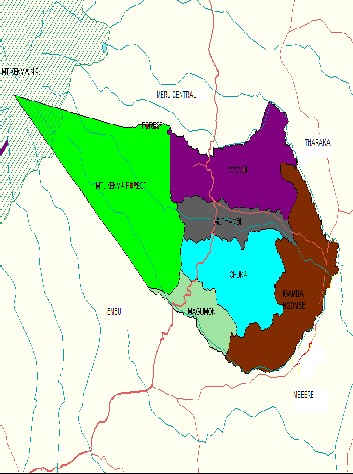
2.0 STUDY AREA
Meru South is situated between longitudes 3718’ 37’’ and 37
28’33’ East and latitude 0007’23’’ and 0026’19’ south. The
IJSER © 2012
International Journal of Scientific & Engineering Research Volume 3, Issue 11, November-2012 2
ISSN 2229-5518
total area of the district is 1092.9 km2 and this includes 360
KM2 of Mt. Kenya forest. It borders Meru Central to the North, Embu to the South. Tharaka and Mbeere to the East, Kirinyaga and Nyeri to the west at the peak of Mt. Kenya
IJSER © 2012
International Journal of Scientific & Engineering Research Volume 3, Issue 11, November-2012 3
ISSN 2229-5518
3.1 SAMPLING TECHNIQUES
Water samples were retrieved at the depth of 15cm from the surface a long Irigu river. Grab samples were taken at every 15 minutes intervals for one hour and thereafter, they were com- bined to form composite samples. Separate samples were col- lected for physicochemical and bacteriological analysis, since the sampling and preservation methods are different for each. In this particular case, the standard method for the examina- tion of water and waste water was followed [15]. 1 litter polye- thylene bottles for assessment of physicochemical quality test and 1 litter glass bottles for bacteriological quality test were thoroughly cleaned and rinsed three times with water to be collected. A total of 48 samples were collected from 6 sam- pling sites and subjected to analysis. In situ data measurement was recorded using water quality meter model (WQC- 24). The data included temperature, turbidity, pH and electrical conductivity. Other water quality parameters were analyzed in laboratory. The sampling sites were chosen at random a long river Irigu and its tributaries. At each sampling sites, se- diment sample was also collected.
The collected water samples were analyzed for various physi- cochemical and bacteriological parameters. The standard pro- cedure for analysing water and waste water [15],[16],[17],[18],[19] was followed. Sediment samples were analyzed using {Varian Spect-AA-10-Model) and XRF {Minip- al QC model}. The techniques used for the analysis are sum- marized in Table 1.
3.3 RESULTS AND DISCUSSION
The seasonal average of the physical and chemical characteris- tics of water samples from Irigu river are given in Table 2.The results of physicochemical parameters which were outside the limit set by WHO are presented graphically(Fig 3 to 5). Tem- perature affects the amount of dissolved oxygen in water, the rate of photosynthesis by aquatic plants and the sensitivity of organisms to toxic waste, parasites and diseases. Warm waters allow pathogenic parasites to increase their population sizes enough that people become ill by contacting the dense parasite populations while swimming, diving or participating in other water sports. The temperature in rivers is influenced by ripa- rian vegetation, flow rate, industrial coolant discharge and sewage outflow. In the present study, the temperature values ranged from 21.8 to 24.6 ˚C in wet season and 20.4 to 22.7˚C in dry season. These values are below 27˚C which indicates that
water from Irigu is suitable for drinking purposes. Wet max-
IJSER © 2012
International Journal of Scientific & Engineering Research Volume 3, Issue 11, November-2012 4
ISSN 2229-5518
iama and dry maxima were observed at all the sites with the marginal variations. Increase in water temperature during wet season could be attributed to increase in turbidity because the suspended particles absorb sun’s heat hence increase in water temperature.
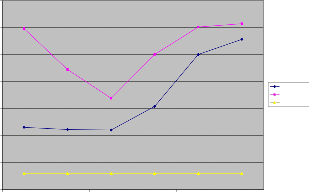
The pH of river water is the measure of how acidic/basic wa- ter is on a scale of 0-14. pH of less than 7 indicates acidity whereas a pH of greater than 7 indicates a base. The pH of natural water falls between 6.5 and 8.5 on this scale with 7.0 being neutral. The pH of water depends on chemical and bio- logical contributions-CO2 from air, carbonate salts in water and decaying of biomass, SO2 and H2SO4 or other acids from any source. Factors that can cause fluctuations in the river pH include acid rain, presence of limestone along river banks and in soil, agricultural runoff, acidic mine drainage and fossil fuel emissions such as carbon dioxide, which creates a weak acid when dissolved in river water. Drastic changes in pH can have detrimental effects on river health.
The Irigu river had a measured pH ranging from 7.38 to 8.41
in wet season and 5.27 to 7.94 in dry season. The dry minima could be attributed to increase in respiration and decomposi- tion rate of organic matter leading to production of CO2, which dissolves in water as carbonic acid, thereby lowering the pH. The wet maxima may be due to the geology of the area, increase in photosynthesis, agricultural runoff and sewer overflow.
The pH of water samples during wet season was found to be within the limit prescribed by WHO while in dry season the pH of water samples from some sampling points were not within the limits set for domestic use as prescribed by APHA and this might have a negative impact on the users.
Electrical conductivity is a measure of water capability to transport electric current. The value depends on the concentra- tion and degree of dissociation of electrolytes. Electrical con- ductivity is an important water quality measurement because it gives a good idea of the amount of dissolved material in the water. High values indicates high dissolved solids concentra-
tions, dissolved solids can affect the suitability of water for
domestic, industrial and agricultural uses.
At higher levels, drinking water may have unpleasant taste or odour or may cause gastrointestinal distress. Additionally, high dissolved solids concentrations can cause deterioration of plumbing fixtures and appliances. Relatively expensive water- treatment processes, such as reverse osmosis are needed to remove excessive dissolved solids from water. The values of electrical conductivity in the present study ranged between
5.11 to 12.90 μmho/cm in wet season and 0.32 to 1.35
μmho/cm in dry season.
Electrical conductivity maxima in wet season might be due to increase in decomposition and mineralization of organic mate- rials. It can also be due to high temperature observed during this season. The values of electrical conductivity observed dur- ing wet and dry seasons are within the range prescribed by WHO. The correlation coefficient for the electrical conductivi- ty and dissolved solid values is 0.99 which implies that the presence of the total dissolved solids is a major contributing factor to the electrical conductivity of water. The total dis- solved solids ranged between 0.08 to 11.71 mg/l in wet season and 0.13 to 0.63 mg/l in dry season. These values are within the prescribed limit given by WHO. It can therefore be con- cluded that river water from Irigu does not pose a health con- cern due to dissolved solids.
Suspended sediment is the amount of soil moving along a steam/river. It is highly dependent on the speed of the water flow, as fast flowing water can pick up and suspend more soil than calm water. During storms, soil is washed from the streams /river banks into the stream/river. The amount that washes into a stream/river depends on the type of land in the river’s watershed and the vegetation surrounding the river. Excess sediment can harm the water quality. The values of the total suspended solids in this investigation ranged between
3.52 to 8.00 mg/l in wet season and 0.10 to 0.91 in dry season. High values in wet season can be attributed to increase in the speed of the water flow of the river. These values are within desirable limits set by WHO.
Turbidity is the physical property of reduced light transmis-
IJSER © 2012
International Journal of Scientific & Engineering Research Volume 3, Issue 11, November-2012 5
ISSN 2229-5518
sion through water due to absorbance and scattering by solid particles in suspension. Material that causes water to be turbid include: clay, silt, finely divided organic and inorganic matter, soluble coloured organic compounds, plankton and micro- scopic organisms. Such particles absorb heat in the sunlight, thus raising water temperature, which in turn lowers dis- solved oxygen levels.
They also prevent sunlight from reaching plants below the surface. This decreases the rate of photosynthesis, so less oxy- gen is produced by plants. Turbidity may harm fish and their
larvae. It is caused by soil erosion, excess nutrients, various
The observed range of alkalinity in the present investigations was between 3.86 to 10.00 mg/l in rainy season and 1.67 to
6.23 mg/l in dry season. Total alkalinity values from all the
investigated samples from sampling sites 1 to 6 were found to be within the value prescribed by WHO. From these values, a water sample from river Irigu is safe for domestic purposes. Alkalinity values are high during wet season and this could be attributed to surface runoff containing alkaline substances. Acidity of natural water refers to the total acid content that can be titrated to pH 8.3 with NaOH. Acid-neutralizing capac-
ity (ANC) of natural water is defined as follows
wastes and pollutants and the action of bottom feeding organ- isms which stir sediments up into the water. The turbidity
ANC=[OH-]+[HCO -]+2[CO All proton acceptors
32-
]+[B(OH) -]+
-]+[HPO 2-]+[HS-]+[NOM-]-[H O+]-3[Al3+]
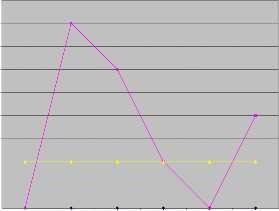
values of river Irigu for wet season ranged between 30.48 to
96.3 NTU whereas for dry season, it ranged between 21.84 to
29.32 NTU. These results revealed that, turbidity level in the water samples from Irigu river is above the WHO standard and this could lead to serious environmental and health ha- zard.
Alkalinity is the capacity of water to accept H+ to reach a pH
of 4.5,which is the second equivalence point in the titration of carbonate with H+. Alkalinity is controlled by the concentra-
[H3SiO4 4 3
All proton donors
Where NOM- is natural organic material that is able to accept a proton. Acid contribute to corrosiveness and influence chemi- cal reaction rates, chemical speciation and biological processes. The measurement also reflects a change in the quality of the source water. Acidity values obtained ranged between 11.37 to
22.0 mg/l in dry season while in wet season the levels were
below the detection limit of analytical techniques employed.
tion of OH-, CO 2- and HCO3-
in water. Because these ions can
Surface runoff and dilution of river water might have inter-
act as pH buffers and as a reservoir for inorganic carbon, the determination of the alkalinity of natural water is a measure of
its ability to support aquatic life.
fered with the detection of acidity during rainy season.
Total hardness is the property of water which prevents the lather formation with soap and increases the boiling point of
-]+2[CO
]-[H O+]
water. Hardness of water mainly depends upon the amount of
Alkalinity=[OH-]+[HCO3
32- 3
Proton acceptors proton donors
Alkalinity takes into account the proton accepting components of natural waters and is a very important indicator of the ex- tent of acidification of rivers. The main sources of natural alka- linity are rocks. Borates, silicates and phosphates may also contribute to alkalinity .Limestone is rich in carbonates, so waters flowing through limestone regions generally have high alkalinity-hence its good buffering capacity. Conversely, gra- nite does not have minerals that contribute to alkalinity. Therefore, areas rich in granite have low alkalinity and poor
buffering capacity.
calcium or magnesium salts or both. The hardness values showed range from 0 to 7.23 mg/l in wet season and 7.01 to
19.47 mg/l in dry season. The hardness values of water sam-
ples from Irigu were within the prescribed limit set by WHO. In the present study, total hardness of all the sampling sites showed dry maxima due to reduced inflow and evaporation and wet minima was due to increasing inflow and dilution.
The sulphate content of natural waters is an important consid-
eration in determining their suitability for public and industri- al supplies. Sulphate occurs naturally in water as a result of
leaching from gypsum and other common minerals. Discharge
IJSER © 2012
International Journal of Scientific & Engineering Research Volume 3, Issue 11, November-2012 6
ISSN 2229-5518
of industrial wastes and domestic sewage tend to increase its concentration. The sulphate concentration varied between 4.71 to 14.65 mg/l in wet season and in dry season the levels of sulphate were below the detection limit of the analytical me- thod applied. The wet maximum can be attributed to surface runoff.
Excess amounts of nitrates in water cause an increase in algae
growth. Algae can rob the water of dissolved oxygen and eventually can kill fish and other aquatic life. Sources of ni- trates may include human and animal wastes, industrial pol- lutants and non point source, run off from heavily fertilized croplands and lawns. Under certain conditions high levels of nitrates in drinking water can be toxic to humans. High levels of nitrates in drinking water have been linked to serious ill- ness and even death in infants. The nitrate levels in the present study varied in the range 1.28 to 6.00 mg/l in wet season and
0.11 to 4.94 mg/l in dry season. The high values in wet season
can be attributed to non point source run off from heavily fer- tilized croplands and lawns. It can also be due to manure from livestock and animal wastes.
The results obtained in the present study showed that nitrate
content in all water samples were within permissible limit by
WHO.
Nitrites are relatively short-lived because they are quickly converted to nitrates by bacteria. Nitrites produce a serious illness (blood disease) in fish. Nitrites also react directly with haemoglobin in human blood to produce methemoglobin, which destroys the ability of blood cells to transport oxygen. This condition is especially serious in babies less than three months of age as it causes a condition known as methomoglo- binemia or blue baby disease. Water with nitrite levels exceed- ing 1.0 mg/l should not be given to babies.
Nitrites had concentrations ranging between 0.39 to 0.67 mg/l
in dry season and its concentration levels in wet season ranged between 0.0 to 0.10 mg/l. Maxima value in dry season could be attributed to decrease in the levels of bacteria for convert- ing nitrate to nitrite. The levels of nitrite are below the limit set
by WHO.
Ammonia is extremely soluble in water. It reacts with water to produce ammonium hydroxide, which further dissociates into ammonium and hydroxyl ions. It is influenced by biological activities. Ammonia is toxic to fish and aquatic organisms even in very low concentrations. Ammonia levels greater than approximately 0.1 mg/l usually indicate polluted waters. The danger ammonia poses to fish depends on the waters tempera- ture and pH and the warmer the temperature, the more toxic the ammonia. Ammonia is much more toxic to fish and aqua- tic life when water contains very little dissolved oxygen and carbon dioxide. The values of ammonia in the present study ranged between 0.45 to 1.00 mg/l in wet season and 1.05 to
1.71 mg/l in dry season. High ammonia concentration during dry season could be attributed to increase in anaerobic de- composition of organic matter.
Chloride is invariably present in small amounts in almost all natural waters and its contents go up appreciably with in- creasing salinity. High concentration of chlorides is considered to be the indicators of pollution due to organic wastes of ani- mal or industrial origin. Chlorides are troublesome in irriga- tion water and also harmful to aquatic life. The levels of chlo- rides in the present investigation varied from 5.56 to 9.00 mg/l in wet season and 6.90 to 11.21 mg/l in dry season .Low val- ues in wet season might be due to increase in dilution. High chloride levels in some sampling sites could be due to human contamination. The values obtained in the present study are well within prescribed limit set by WHO.
Fluoride inhibits enzymes that breed acid-producing and bac-
teria whose acid eats away tooth enamel. Excessive fluoride intake leads to loss of calcium from the tooth matrix, aggravat- ing cavity formation throughout life rather than remedying it and so causing dental flourosis. Severe, chronic and cumula- tive overexposure can cause the incurable crippling of skeletal flouriosis.
Analysis of water samples from Irigu river indicates that ,the
fluoride levels ranges from 0.09 to 0.32 mg/l in wet season and 0.11 to 0.48 mg/l in dry season. Probable source of fluo-
ride in some sampling sites of the Irigu river might be that,
IJSER © 2012
International Journal of Scientific & Engineering Research Volume 3, Issue 11, November-2012 7
ISSN 2229-5518
during weathering and circulation of water in rocks and soil, fluorine is leached out and dissolved in water. The content
from each sampling site varies depending on the type of rocks
Figure 3: pH water samples in wet and dry season
Turbidity in Wet and Dry Season Compared to WHO Limit
from which it originates. The WHO Guideline value of 1.5 mg/l for fluoride in drinking water was exceeded by some water samples from Irigu. Low values in wet season could be attributed to increase in dilution.
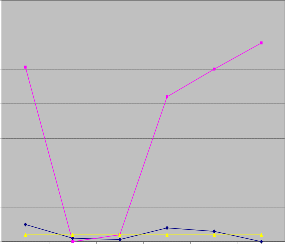
Phosphorus is an essential element for all life. It is part of the backbone of DNA.ATP is the fuel or energy currency of cellu- lar metabolism. Phosphorous at different energy states is orig- inally bound and essential to the operation of photosynthesis, metabolism and catabolism. Phosphorous stimulates algal growth. When algal growth is excessive other aquatic forms of life are endangered. Algae blooms limit recreational use by reducing water clarity and aesthetic qualities. Algae have a negative effect on reservoir fisheries because of periodic oxy-
gen depletion associated with algae respiration and decompo-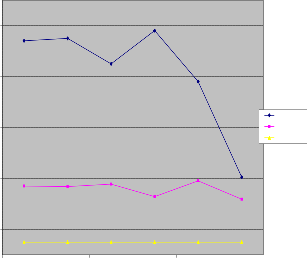
100
90
80
70
60
50
40
30
20
10
0
1 2 3 4 5 6
Sampling sites
WET DRY
WHO LIMIT
sition .Phosphorous levels varied from 0.00 to 5.69 mg/l in wet season and 26.36 to 29.40 mg/l in dry season. The lower values of phosphorous in wet season suggest that the runoff water only contributes to dilution .This results suggests that the levels of phosphorous in water samples from Irigu during dry season is likely to trigger periodic blooms (P levels >0.05 mg/l)and long term eutrophication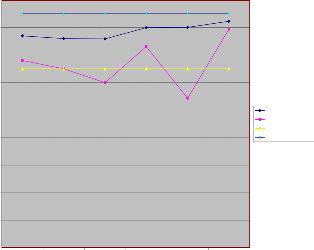
9
8
7
6
Figure 4: Turbidity of water samples in wet and dry season
Phosphorous Concentartion in mg/l

35
30
25
20
15
10
5 WET DRY
Lower WHO limit=6.5
4 Upper WHO limit=8.5
3
2
5
0
1 2 3 4 5 6
Sampling sites
1
0
1 2 3 4 5 6
Figure 5: Phosphorous concentration of water samples in wet
and dry season
IJSER © 2012
International Journal of Scientific & Engineering Research Volume 3, Issue 11, November-2012 8
ISSN 2229-5518


IJSER © 2012
International Journal of Scientific & Engineering Research Volume 3, Issue 11, November-2012 9
ISSN 2229-5518
mg/l) | |||||||
Ni- trates(m g/l) | 2.53 | 0.14 | 2.50 | 0.11 | 6.00 | 4.94 | 50 |
Nitri- tes(mg/l ) | ND | 0.60 | ND | 0.62 | 0.10 | 0.39 | 3.0 |
ammo- nia(mg/l ) | 0.45 | 1.34 | 0.58 | 1.05 | 0.56 | 1.30 | 35 |
chlo- ride(mg /l) | 9.00 | 11.2 1 | 8.62 | 7.00 | 8.00 | 8.77 | 250 |
Fluo- ride(mg /l) | 0.17 | 0.19 | 0.32 | 0.11 | 0.22 | 0.48 | 1.5 |
Phos- phor- ous(mg/ l) | ND | 27.2 0 | 5.50 | 28.3 0 | 5.69 | 28.3 9 | 0.5 |
3.4 LEVELS OF TRACE METALS IN WATER SAMPLES
A summary of the results of the trace element concentrations in the sampled water are depicted in Table 3.The results of trace elements which were not within the limit set by WHO are presented graphically(Fig 6 to 9).. A close examination of Table 3 reveals that the levels of Cu, Cr, Sb, Cd, Mo, B, V, Sr were below their respective detection limits for the analytical method used while the levels of other trace elements were below WHO maximum guideline values for the respective elements in drinking water, except for Fe, Mn, Pb and Al
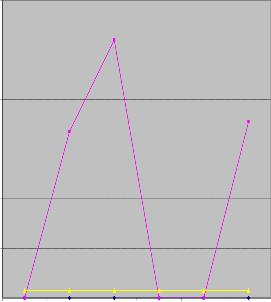
The iron content of water is of considerable concern because small amounts seriously affect the water’s usefulness for some domestic and industrial purpose. Iron in water causes staining of plumbing fixtures; staining of clothes and plugging of pipes. Iron bearing waters also favour the growth of iron bac- teria, such as crenothrix. Iron bacteria are of several kinds but
crenothrix is the most common.
Iron in water sufficiently indicates presence of E-Coliforms that is the indications of sewage contamination. Due to this there are many cases of dysentery; typhoid etc can be heard of. The values of iron in water samples from Irigu ranged be- tween 1.09 to 2.78 mg/l in wet season and 1.69 to 3.07 mg/l in dry season. In both seasons, the levels of iron in water samples were above the limits set by WHO. The high levels might be contributed to the weathering of the rocks and also to the dis- posal of waste water. Minima iron levels in wet season might be due to dilution of the river water.
Excess manganese interferes with the absorption of dietary iron. Long-term exposure to excess levels may result in iron deficiency anemia. Increased manganese intake impairs the activity of copper metallo-enzymes. Water rich in manganese can increase bacterial growth in water. Manganese concentra- tion in water samples from Irigu river were found to be rang- ing between 0.0 to 0.25 mg/l in wet season and 0.0 to 2.88 mg/l in dry season. Water samples from some sampling sites were having manganese levels greater than the set limit by WHO. This could be due to the type of the rocks undergoing weathering at the sampling sites.
Lead interferes with a variety of body processes and is toxic to many organs and tissues in the body. Lead interferes with a variety of body processes and is toxic to many organs and tis- sues including the heart, bones, intestines, kidneys, reproduc- tive and nervous systems. It interferes with the development of the nervous system and is therefore particularly toxic to children, causing potentially permanent learning behavior disorders. One of the routes of exposure to lead is water. Lead levels ranged from 0.01 to 0.05 mg/l in dry season while its levels in wet season are below the detection limit of the tech- nique used. The high levels during the dry season could be attributed to decrease in dilution.
High concentration of aluminium in water might be harmful to health. High concentration of aluminium might affect the nervous system, with possible connections to several diseases, such as Parkinson’s, Alzheimer’s and Lou Gehrings’s disease.
Aluminium may also cause skeletal problems .The concentra-
IJSER © 2012
International Journal of Scientific & Engineering Research Volume 3, Issue 11, November-2012 10
ISSN 2229-5518
tion of aluminium ranged from 0.51 to 1.12 mg/l in dry season and no values of aluminum was detected during wet season. The levels of aluminum during dry season were above the limits set by WHO. These levels during dry season could be attributed to the weathering of the rock.
Fe Concentartion in mg/l
3.5
3
2.5
0.045
0.04
0.035
0.03
0.025
0.02
0.015
0.01
Concentration of Pb in mg/l
2
1.5
WET DRY
WHO LIMIT
0.005
0
1 2 3 4 5 6
Sampling sites
1
0.5
0
1 2 3 4 5 6
Sampling sites
Figure 8: Pb concentration of water samples in wet and dry season
Al concentration in mg/l
Figure 6: Fe concentration of water samples in wet and dry
season
Mn Concentration in mg/l
3.5
3
2.5
2
1.5
1
0.5
1.2
1
0.8
0.6
0.4
0.2
0
![]()
1 2 3 4 5 6
Sampling sites
0
1 2 3 4 5 6
Sampling sites
Figure 9: Al concentration of water samples in wet and dry season
Figure 7: Mn concentration of water samples in wet and dry
season
IJSER © 2012
International Journal of Scientific & Engineering Research Volume 3, Issue 11, November-2012 11
ISSN 2229-5518
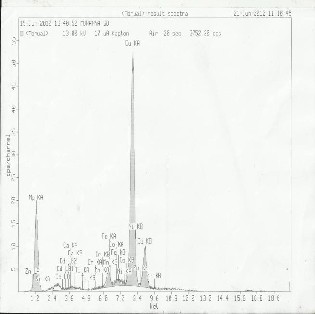
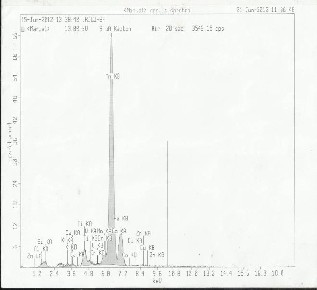
![]()

Table 4 and 5 contains the results of trace metals in sediment samples from river Irigu. Semi quantitative analysis was car- ried out using XRF in order to characterize the sediments. The results obtained are represented in Fig.9, 10 and 11 and were confirmed using AAS. A close examination of these tables re- veals that Al, Si, Fe are present in major quantities and other remaining elements exist in trace levels. These levels could be attributed to the type of rock undergoing weathering. High levels in dry season might be due to the settling effects as a result of reduced velocity of the river water. Loss on ignition ranges from 2.84 to 12.58 in wet season and 6.69 to 24.12% in dry season. High values during dry season could be due to settling effect. These values indicate that the sediments from river Irigu consist mainly of mineral matter content and the
amount of carbonaceous matter is low.
IJSER © 2012
International Journal of Scientific & Engineering Research Volume 3, Issue 11, November-2012 12
ISSN 2229-5518

Season parameters X10-2 | SITE 1 | SITE 2 | SITE 3 | |||
Season parameters X10-2 | WET | DRY | WET | DRY | WET | DRY |
Na | 5.59 | 2.50 | 1.50 | 2.58 | 1.90 | 22.60 |
Ca | 4.89 | 1.78 | 2.10 | 5.53 | 1.85 | 7.70 |
Mg | 1.50 | 3.21 | 1.80 | 3.75 | 1.75 | 2.03 |
Fe | 105.10 | 462.72 | 23.58 | 477.50 | 27.90 | 145.25 |
Mn | 7.50 | 3.28 | 7.10 | 6.18 | 3.22 | 3.25 |
Zn | 1.02 | 0.72 | 1.10 | 0.58 | 0.48 | 1.49 |
Cu | ND | 0.09 | ND | ND | ND | 0.08 |
K | 6.52 | 4.51 | 6.70 | 4.79 | 6.78 | 7.47 |
Cr | ND | ND | 0.08 | ND | ND | 0.74 |
Pb | 0.47 | 0.18 | 0.21 | 0.50 | 0.22 | 0.23 |
Sb | ND | ND | ND | ND | ND | 1.42 |
Co | 0.18 | 0.21 | 0.41 | 0.35 | 0.53 | 0.67 |
Cd | ND | ND | ND | ND | ND | ND |
Mo | ND | ND | ND | ND | ND | 0.01 |
B | ND | ND | ND | ND | ND | 3.53 |
V | 0.01 | 0.08 | ND | ND | ND | 0.09 |
Sr | ND | ND | ND | ND | ND | 0.20 |
Al | 118.50 | 240.30 | 120.72 | 245.75 | 121.55 | 186.50 |

IJSER © 2012
International Journal of Scientific & Engineering Research Volume 3, Issue 3, March-2012 13
ISSN 2229-5518

TABLE 5: FULL ASSAY ANALYSIS
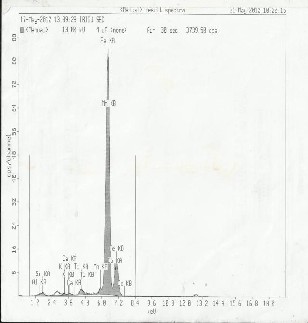

TABLE 4: FULL ASSAY ANALYSIS
The coliform bacteria group consists of several genera of bac- teria belonging to the family enterobacteriaceae. Fecal coliform bacteria belong to this group and can enter water bodies from human and animal waste. If a large number of fecal coliform bacteria (over 299 colonies/100 ml of water sample) are found in water, it is possible that pathogenic organisms are also present in the water. Fecal coliform are the indicator organ- isms, which means they indicate the presence of other patho- genic bacteria. Swimming in water with high levels of fecal coliform bacteria increases the chance of developing illness from pathogens entering the body through the mouth, nose, ears or cuts in the skin. Diseases and illnesses that can be con- tracted in water with high fecal coliform counts include typho- id fever, hepatitis, gastroenteritis, dysentery and ear infec- tions. Factors affecting fecal coliform include wastewater and septic system effluent, animal waste, sediment load, tempera- ture and nutrients.
MPN of coliform organisms/100 ml in water samples from
IJSER © 2012
International Journal of Scientific & Engineering Research Volume 3, Issue 3, March-2012 14
ISSN 2229-5518
Irigu river were found to be greater than 2420 in both seasons while E.Coli/100 ml ranged between 209.1 to >2420 in wet sea- son and 205 to 691 in dry season .There was variation in E.Coli
/100 ml between rainy and the wet seasons. The high number of total coliform during the rainy season might be due to the entrance of animal and human wastes into the water bodies by surface run off.
High temperature observed during wet season and increase in nutrients in water body brought about by run off might also contribute to this. The values obtained in both season deviated from the standard recommended by WHO. The high values of coliforms are suggestive of the likelihood of pathogenic organ- isms being present in the water samples from Irigu river. This implies that, the people utilizing water from Irigu could con- tact diseases like typhoid fever, hepatitis, gastroenteritis, dy- sentery and ear infections .These diseases have high morbidity and mortality rates and the population mostly residing in poor communities is at risk. In the study area, water born diseases are common.
Sampling Sites | WET SEASON | DRY SEASON | ||
Sampling Sites | MPN Of Coli- form Organ- isms/100 | E.Coli/100 ml | MPN Of Coli- form Organ- isms/100 | E.Coli/100 ml |
1 | >2420 | >2420 | >2420 | 461.1 |
2 | >2420 | 920.6 | >2420 | 579.4 |
3 | >2420 | 209.1 | >2420 | 205 |
4 | >2420 | >2420 | >2420 | 248 |
5 | >2420 | 1120 | >2420 | 691 |
6 | >2420 | 517 | >2420 | 613 |
pH ,turbidity, phosphorous, iron, manganese, Pb and Al levels in water from Irigu river are not within the limits recommend- ed by WHO standards. These levels may have adverse effects on the health of people using the water without purification over a long period of time.
Water from River Irigu also contains higher coliform counts,
which requires monitoring and treatment process if the water
is to be used for drinking purposes. Some steps and awareness programs to educate local villagers to safeguard the precious river and its surrounding must be put in place. Al, Si, Fe are present in major quantities in sediment from river Irigu and other trace elements exist in trace levels. The sediments from Irigu consist mainly of inorganic matter.
4.1 ACKNOWLEDGMENT
The authors wish to thank Chuka University College for fi- nancing the research. The Principal of Chuka University must also be thanked for the interest he had shown on water quality of the rivers in Meru South district.
4.2 REFERENCES
[1] Duggal, KN (2010).”Elements iof Environmenal Engineer- ing”.S.Chand and Company ltd, Ram Nagar, New Delhi
[2] James, EG (2005).Princples of Environemntal Chemi- stry.Jones and Barlett Publishers, Inc, Canada, 2005 [3]Anyanwu, CU and Okoli,EN(2012).”Evaluation of the bac- teriological and physiochemical quality of water supplies in Nsukka, Southeast.” Nigeria.African Journal of Biotechnology
11(48),10868-10873
[4]Venkateshraju,K;Ravikumar,P,Smashekar,RK;Prakash,RL(
2010)..”Physicochemical and baxteriological investigation on the river Cauvery of Kollegal stretch in Karnataka.Kathmandu “University Journal of Science, Engineering and Technology
6(1),50-59.
[5]Shama,S;Naz,I,Ishtiaq, MA and Ahmed,S(2011)..”Monitoring of physicochemical and micro- biogical analysis of underground water samples of District Kallar”,Stedan.Rawalpindi Pakistan,Research Journal of Chemical Sciences 1(8),24-30.
[6] Mckee, T and Mckee, JR(2003).Biochemistry.3rd ed.McGraw
Hill.30-31
[7] Campbell, MK and Farrell, O (2009).Biochemistry, 6th
IJSER © 2012
International Journal of Scientific & Engineering Research Volume 3, Issue 3, March-2012 15
ISSN 2229-5518
ed.Brooks/cole Engage learning, 35-42
[8] Nagendra, KC and Tiwari, RM (20110.”Effcet of industrial effluents and wastes on physicochemical parameters of river rapti”.Advances in Applied Science Research,2(5):207-211
[9] Dara, SS and Mishra, DD (2011). A textbook of Environ- mental Chemistry and Pollution control,9th ed.S.Chand and company ltd,Ram Nagar,New Delhi
[10] Gupta, PK(2007).Methods in Environmental Analysis of water, soil and air.1ST ed. Agrobios, India [11]Demeestere,K;K’oreje,K.O;Wispelaere,PD;Vergeynst,L;De wulf,J;Langenhove,HV(2012)..”From multi-residue analysis of pharmaceuticals in water:development of a new approach on magnetic sector mass spectrometry and application in the Nai- robi River basin ,Kenya.”.Science of the total Environ- ment,437,153-164.
[12] Waseem,A;Mahmood,Q;Malik,AH;Zeb,BS(2011).Water quality assessment of Siran,Pakistan 6(34)7789-7798.
[13] Abouleish, MYZ (2012)..”Concentartion of selected
Anions in bottled water in the United Arab Emirates”.Water
4,496-509.
[14] Aydani, A (2007).”The microbiological and physicochemi- cal quality of ground water in West thrace”,Turkey.Polish J.of Envirinmental Stud 163,377-383.
[15] APHA-AWWA-WEF (2005).Standard methods for the
examination of water and waste water,20th ed.Washington
DC,usa;American Public Health Association
[17] Naidya,K and Gadhia,M(2012).Evaluation of drinking water quality .Afrocan Journal ofPure and Applied Chemistry
691),6-9.
[18] Daso,AP;Osibanjo,O;Gbadebo,AM(2011).The impact of industries on surface water quality of river Ona and River Alaro in Oluyole Industrial Estate Ibadan, Nigeria. African Journal of Biotechnology 1094),686-702.
[19] Adeleka,BA(2010).Water quality of domestic wells in typ- cal African communities: case studies :Case studies from Ni-
geria. International Journal of Water Resources and Environ-
mental Engineering, 296), 137-147.
[20]Amanatiue,E;Adamidou,K;Triloilidou,E;Katsiouli,F,Patrik aki,O;Tsikritzi,SL(2006).Physicochemical and microbiological characteristic of the portable water supply sources in the area of Kozani, Western Macedonia.Desalination,213,1-8.
.
IJSER © 2012