possible that the output is equal to the input. H1

International Journal of Scientific & Engineering Research, Volume 5, Issue 12, December-2014 1204
ISSN 2229-5518
Intrusion Detection System Using Improved
Ensemble Technique with DAG Approach
*Deepak Kumar Singh, Beerendra Kumar
Our proposed work is implemented in MATLAB. For implementation purpose write various function and script file for implementation of our proposed architecture. For the test of our hybrid method, we used DARPA KDDCUP99 dataset. This data set is basically set of network intrusion and host intrusion data. This data provided by UCI machine learning website.
Proposed method compare with exiting ensemble techniques like simple ensemble technique and Hybrid ensemble Techniques and generate the improved ensemble technique to getting better result such as detection rate, precision and recall Rate.
———————— ——————————
approach or a multi-variable approach to detect Intrusion depending on the algorithm used. In the single variable
Intrusion data classification and detection process is very complex process in network security. In current network security scenario various types of Intrusion attack are available some are known attack and some are unknown attack. The attack of know Intrusion detection used some well know technique such as signature based technique and rule based technique. In case of unknown Intrusion attack of attack detection is various challenging task. In current trend of Intrusion detection used some data mining technique such as classification and clustering. The process of classification improves the process of detection of Intrusion. In this dissertation used graph based technique for Intrusion classification and detection. The continuity of chapter discusses feature extraction process of Intrusion data, directed acyclic graph technique, support vector machine and proposed methodology.
Intrusion classification can either have single variable
————————————————
• Deepak Kumar Singh is currently pursuing masters degree program in Computer Science Engineering, CSE College,Jhansi, India, E-mail: deepakk005@gmail.com
•
• Beerendra Kumar is Assistant Professor in CSE College, Jhansi, India
approach a single variable of the system is analyzed. This
can be, for example, port number, CPU usage of a local machine etc. In multi-variable approach a combination of several features and their inter-correlations are analyzed. In addition based on the method the way in which features are chosen for the IDS can be divided into two groups; into feature selection and feature reduction.
In the feature selection method the features are either picked manually from the data monitored or by using a specific feature selection tool. The most suitable features are selected by handpicking from the feature spectrum based on the prior knowledge about the environment that the IDS are monitoring. For example features that can distinguish certain type of traffic from the traffic flows are picked for the network traffic model training. The idea behind the feature selection tools is to reduce the amount of features into a feasible subset of features that do not correlate with each other. Examples of feature selection tools are Bayesian networks (BN) and classification and regression tree (CART). Feature selection process is illustrated in Fig. on the left there are the features (F0…FN) that are available from the data monitored, which is, for example, from network traffic. On the right side is the output (F0...FM) of the selection tool. The number of features in the output varies based on the selection tool used and the inter- correlation of features in the input. Following the basic principles of feature analysis the number of features in the
IJSER © 2014 http://www.ijser.org
International Journal of Scientific & Engineering Research, Volume 5, Issue 12, December-2014 1205
ISSN 2229-5518
output (M in Fig.) is in most of the cases less than the number of features in the input (N in Fig.). However, it is
possible that the output is equal to the input. H1
H H2
Margin=2/||
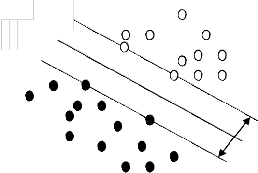
Fig. 2 The SVM Binary Classifications
For training data set ( x1 , y1 ),..., ( xl , yl ), yi ∈ {− 1,1}
, to
Support Vector Machine (SVM) is a novel machine learning
method based on statistical learning theory developed by
V.N.Vapnik, and it has been successfully applied to numerous classification and pattern recognition problems such as text categorization, image recognition and
find the optical hyper-plane H, a nonlinear transform, Z = Φ( x) , is applied to x, to make x become linearly dividable. A weight w and offset b satisfying the following criteria will be found:
bioinformatics. It is still in the development stage now.
SVM can be used for pattern recognition, regression
wT z
T
+ b ≥ 1,
yi = 1
analysis and principal component analysis. The
achievements of SVM in training have Platt’s the sequential minimal optimization method, Osuna’s the method of
w
i.e.
zi + b ≤ −1,
T
yi = −1
(1)
Chunking, Joachims’ SVM light method and so on. These methods are directed at the training process, and not
yi (w
zi + b) ≥ 1,
i = 1,2,..., l
(2)
related to classification process. In the process of SVM
Assume that the equation of the optical hyper plane H
T
training, all the samples are used. So it has no effect on the
w
(Fig.4.1) is 0
z + b0 = 0 , then the distance of the data
speed of the classification. Lee and others propose a
point in any of the two classes to the hyper plane is:
method of reduction SVM training time and adding the
speed of training, reduced support vector machines.![]()
ρ (w, b) = min z
![]()
w − max z w
At the same time, because of the reduction of the support
x| y =1 || w ||
x| y =−1 || w ||
(3)
vector quantity, the speed of classification is improved to some degree. However, due to the loss of some support
w
![]()
A 0 is to be found to maximize
T
vector classification, precision has declined, especially when the number of support vector is so many that the
ρ (w0 , b0 ) = 2 / || w0 ||= 2 /
w0 w0
(4)
accuracy of its classification will decline. The concept of SVM is to transform the input vectors to a higher dimensional space Z by a nonlinear transform, and then an
Then the search of the optimal plane H turns to a problem
of a second order planning problem.![]()
min Φ(w) = 1 (wT w)
optical hyper-plane which separates the data can be found.
This hyper-plane should have the best generalization
capability. As shown in Fig. 2, the black dots and the white
w,b
Subject to
2
yi (w
z i +b) ≥ 1,
(5)
i = 1,2,..., l
(6)
dots are the training dataset which belong to two classes.
The Plane H series are the hyper-planes to separate the two
If the sample data is not linearly dividable, find the minimum value of
classes. The optical plane H is found by maximizing the 1 l
margin value 2 / || w || . Hyper-planes H1
and
H 2 are the
Φ(w)
![]()
= wT w +
2
C ∑ξ i
i =1
(7)
planes on the border of each class and also parallel to the
ξ
optical hyper-plane H. The data located on
H1 and
H 2 are
Whereas
can be understood as the error of the
called support vectors.
classification and C is the penalty parameter for this term.
By using Lagrange method, the decision function of
IJSER © 2014 http://www.ijser.org
International Journal of Scientific & Engineering Research, Volume 5, Issue 12, December-2014 1206
ISSN 2229-5518
l
w0 = ∑ li yi zi
i =1
will be
l
(8)
Where Wij is the d-dimensinal vector, ∅(x) is a m apping function that maps x into the d-dimensional feature space bij is the bias term and Dij(x)= --Dji(x) The regions Ri are
shown in Fig. 4.4 .1 with labels of class I, II and III.
Ri = {x|Dij(x) > 0, j = 1,2, … … . . n, j ≠ i} (15)
f = sgn[∑ li yi ( z
i =0
zi ) + b]
(9)
If x is in Ri, we classify x into class i. if x is not in
Ri(i=1,2,……,n), x is classified by voting. Namely ,for the
From the functional theory, a non-negative symmetrical
input vector x,Di(x) is calculate at follow:
n
function
K (u, v) uniquely define a Hilbert space H, K is
Di(x) = � sign(Dij(x))
the rebuild kernel in the space H:
K (u, v) = ∑αϕ i (u)ϕi (v)
i
(10)
i≠j,j=1
Where sign(x) = � 1 for x ≥ 0,
−1 for x < 0,
This stands for an internal product of a characteristic space:
And x is classified into class
i z = Φ( xi )
Φ( x) = K ( xi , x)
(11)
arg max Di(x)
i = 1,2, … , n
Then the decision function can be written as:
l
If xϵ Ri.Di(x) =n -1 and Dk(x)<n-1 for k≠I. thus x is
classified into I, but if any of Di(x) is not n-1,may be
f = sgn[∑ li yi K ( xi , x) + b]
i =1
(12)
satisfied for plural is. In this case x is unclassified.
In the shaded region in Fig. 3, Di(x) =0 (i=1, 2 and 3).
Therefore, this region is unclassified, although the
The development of a SVM image classification model depends on the selection of kernel function K. There are many kernels which can be used in modeling of Support Vector Machines. These models consists linear, polynomial, radial basis function (RBF) and sigmoid function:
T
unclassified region is much smaller than that for the one- against-all support vector machine.
In pair wise SVMs, classification reduces the unclassifiable regions that occur for one-against-all support vector machines but it still exists. To resolve this problem, Vapnik proposed to use continuous decision functions. Namely, we
xi x j
Linear
classify a data into the class with maximum value of the
K ( x , x ) =
(gx T x
+ coefficient )deg ree
Polynomial
decision functions. Inoue and Abe proposed fuzzy support
i j
exp(−g | xi − x j |
RBF
vector machines, in which Membership functions are defined using the decision functions. Another popular
tanh(gxi
x j + coefficient )
Sigmoid
solution is DAG SVM that uses a decision tree in the testing stage. Training of a DAG is the same as conventional pair
Currently the RBF is the most popular used kernel in
Support Vector Machines because of their localities and
finiteness responses over the whole range of the real x-axis.
Improper kernel function might generate poor
performance. Currently there is no effective “learning”
method to choose a proper kernel function for a specific problem. The selection is decided by the experiment result at this time. In our proposed system, two kernel functions are tested: Radial Basis Function-RBF and Polynomial Function.
wise SVMs.
K poly ( x1 , x2 ) = ( x1 * x2 + 1)

(13)
K RBF
( x1 , x2
) = exp(− p || x1
− x2
||2 )
Due to its better performance, RBF was chosen as the kernel function in the model.
A DAG is a graph based multi-classification technique in this technique pair-wise SVMs used, let the decision function for class i against class j, with the maximal margin, be:
Dij(x) = wijT∅(x) + bij (14)
Fig. 3: Unclassifiable Regions By The Pair-Wise
Formulation.
Classification by DAGs is faster than by conventional pair-
wise SVMs or pair-wise fuzzy SVMs. Fig. 4 shows the
decision tree for the three classes shown in Fig. 5. In the Fig
4 show that x does not belong to class i.
IJSER © 2014 http://www.ijser.org
International Journal of Scientific & Engineering Research, Volume 5, Issue 12, December-2014 1207

ISSN 2229-5518
Fig. 4: DAG Classification.
As the top-level classification, we can choose any pair of classes. And except for the leaf node if Dij(x)>0, we consider that x does not belong to class j, and if Dij(x)<0 not class i.
Fig. 5: Generalization Region By DAG Classification.
Thus, if D12(x)> 0, x does not belong to class II. Therefore, it belongs to either class I or class III, and the next classification pair is classes I and III. The generalization regions become as shown in Fig. 5. Unclassifiable regions are resolved, but clearly the generalization regions depend on the tree formation.
In this section discuss the graph based ensemble based intrusion detection technique. The graph based technique basically work with collection of features of attribute of network data. The network traffic data passes through the graph set, the set collect the similar type of attribute and discard the dissimilar attribute. The discarded attribute used as feature of collection attribute for ensemble process. The ensemble point fist select the all feature attribute for selection and pass through the classification. The process of algorithm discuss in two phase first phase discuss the collection of attribute and second phase discuss the ensemble of attribute for classification.
Phase-I:
Step1: Initially input Intrusion data passes through
preprocessing function and extracted feature part of
Intrusion data in form of traffic type.
Step2: the extracted traffic feature data converted into
feature vector.
Step 3: In phase of feature mapping in feature space of
DAG create a fixed class according to the group of data.
Step 4: steps of processing of DAG.
Initialize Gaussian hyper plane margin.
Choose a random vector from training data and present it
to the DAG.
The weight of the plane support vector is estimated. The
size of the vector decreases with each iteration.
Each vector in the SV’s neighborhood has its weights adjusted to become more like the SV. Vector closest to the SV are altered more than the vector furthest away in the neighborhood.
Repeat from step 2 for enough iteration for convergence.
Calculating the SV is done according to the Euclidean distance among the node’s weights (W1, W2, … , Wn) and the input vector’s values (V1, V2, … , Vn).
The new weight for a node is the old weight, plus a fraction (L) of the difference between the old weight and the input vector… adjusted (theta) based on distance from the SV.
Phase-II:
Input: N_list: collection of intrusion attributes
Output: N_type: number of classified class
G = (V, E) ←empty //define the feature data in
graph mode![]()
3: h.nn ← Nearest-neighbor (NP_list - {h})
4: h.sc←Compute-SC(h,h.nn) //Reduction of![]()
attribute
5: V←V {h} //commutate number of attribute
6: V←V {h.nn}
7: if h.sc < ![]() then //check class group
then //check class group
8: E←E ![]() {(h,h.nn)} //add this DAG
{(h,h.nn)} //add this DAG
9: endif
10: end for
11: for each pair of components (g1,g2) ∈ G d o
12: ←mean-dist (g1), ←mean-dist (g2)
13: If > 1 then g1←Merge (g1,
g2)
14: end for // Now allot the class labels
15: N_type ← empty![]()
16: for ![]() ∈ N l ist d o
∈ N l ist d o
17: h ← PseudopointOf ( )
18: N_type ← N_type ![]() {(( ) , h.ccomponent )}
{(( ) , h.ccomponent )}
IJSER © 2014 http://www.ijser.org
International Journal of Scientific & Engineering Research, Volume 5, Issue 12, December-2014 1208
ISSN 2229-5518
19: end for
Step 5: After processing of support vector finally Intrusion data are classified

Fig. 7: Flow Diagram of A Proposed Model
In this dissertation we perform experimental process of proposed improved ensemble for intrusion detection system. The proposed method implements in matlab and tested with very reputed data set from UCI machine learning research centre. In the research work, I have measured detection accuracy, true positive rate, false positive rate, true negative rate and finally false negative rate error of classification ensemble method. To evaluate these performance parameters I have used KDDCUP99 datasets from UCI machine learning repository namely intrusion detection dataset.
For the purpose of implementation and performance
evaluation i implement the simple Ensemble technique and the Hybrid Ensemble technique and we implement a new ensemble algorithm named improved ensemble technique and we compare third algorithm with previous two and the result shown in tables 1.
Table 1: Comparison analysis of three algorithms on the basis of detection rates, Precision Rates, and Recall Rates.
On the basis of result outcomes we can say that the improved ensemble algorithm performs better than Simple Ensemble and Hybrid Ensemble algorithms and Improved Ensemble reaches to the detection rate up to 98% better than previous two algorithms.
In this thesis proposed a feature based intrusion data classification technique. The reduce feature improved the classification of intrusion data. The reduction process of feature attribute performs by RBF function along with feature correlation factor. The proposed method work as feature reducers and classification technique, from the reduction of feature attribute also decrease the execution time of classification. The decrease time increase the performance of intrusion detection system. Our experimental process gets some standard attribute set of intrusion file such as port type, service, sa_srv_rate, dst_host_count, dst_host_sa_srv_rate. These feature attribute are most important attribute in domain of traffic area. The classification rate in these attribute achieved 98 %.
In this thesis reduction computational time of feature selection process is main objective. Because of this consumed time of each algorithm with different reject threshold measured. As evaluation result shows, although FFR cannot defeat other methodologies in accuracy of
IJSER © 2014 http://www.ijser.org
International Journal of Scientific & Engineering Research, Volume 5, Issue 12, December-2014 1209
ISSN 2229-5518
classification and accuracy didn’t changed very much, but in speed FFR outperformed all other feature selection method with great differences. We used ID3 classifier for developing efficient and effective IDS. For improving the detection rate of the minority classes in imbalanced training dataset we used standard sampling and we picked up all of the important features of the minority class using the minority classes attack mode.
The proposed algorithm is a combination of feature selection and feature reduction for intrusion detection system. The feature selection and reduction both improved the performance of classification algorithm, but it not achieved the classification ratio 100%. The process of data sampling improved the reduction process and improved the classification ratio up to 100%. The sampling process design as mixed sampler corresponding to the nature of network traffic data, the network traffic data is mixed data type some are continuous and discrete.
[1] Abebe Tesfahun, D. Lalitha Bhaskari “Intrusion Detection using Random Forests Classifier with SMOTE and Feature Reduction” International Conference on Cloud
& Ubiquitous Computing & Emerging Technologies, 2013.
[2] Deepak Rathore and Anurag Jain “a novel method for intrusion detection based on ecc and radial bias feed forword network” in Int. J. of Engg. Sci. & Mgmt. (IJESM), Vol. 2, Issue 3: July-Sep.: 2012.
[3] Anshul Chaturvedi and Prof. Vineet Richharia “A Novel Method for Intrusion Detection Based on SARSA and Radial Bias Feed Forward Network (RBFFN)” in international journal of computers & technology vol 7, no 3.
[4] Hachmi Fatma, Limam Mohamed “A two-stage technique to improve intrusion detection systems based on data mining algorithms” IEEE, 2013. Pp 1-6.
[5] Terrence P. Fries “A Fuzzy-Genetic Approach to
Network Intrusion Detection” in GECCO 08, July12–16,
2008, Atlanta, Georgia, USA.
[6] Zorana Bankovic, Dusan Stepanovic,Slobodan Bojanic and Octavio Nieto-Taladriz “Improving network security using genetic algorithm approach” in Published by Elsevier Ltd 2007.
[7] Ren Hui Gong, Mohammad Zulkernine and Purang
Abolmaesumi “A Software Implementation of a Genetic
Algorithm Based Approach to Network Intrusion
Detection” in IEEE 2005.
IJSER © 2014 http://www.ijser.org