
International Journal of Scientific & Engineering Research, Volume 4, Issue 4, April-2013 1180
ISSN 2229-5518
Interventions for Zero-Error Operation in a
Digitally Controlled warehouse.
Dr. Tridib R. Sarma#, Puneet Chaudhury@
Abstract
This paper, presented as a case analysis, is based on first-hand observations and examines dispatch in a digitally controlled warehouse of a manufacturing unit, which is a subset of an MNC and is locat ed in Eastern India. Essentially, it aims to suggest enhanced visual control in the Cartons for Local Delivery (CLD)s to reduce interchange of Stock Keeping Unit(SKU)s during dispatch. Even though the num ber of incidences is very low, but for an organization striving for Zero-Defect operations, each incident is viewed in all seriousness.
Keywords
FMCG; Mat erials Managem ent; W arehousing; Pareto Analysis; Interventions; Six Sigma level
—————————— ——————————
The Fast Moving Consumer Goods (FMCG) industry is a very unforgiving one. If a retailer’s shelves are empty of a manufacturer’s products he will simply fill them with a competitor’s product. Shelf availability of the right product in the right place at the right time is one of the biggest challenges that FMCG supply chains are constantly strive to resolve. The process begins with planning and ends when the right item is delivered at the right place on time and in the required quantity. One of the important functions instrumental in accomplishing this goal effectively is the warehousing function. Efficient warehouse operation is crucial for the success of a FMCG supply chain. An efficient warehouse management system helps companies cut expenses by minimising the amount of unnecessary parts and products in storage and helps them keep lost sales to a minimum. One small slip up can result in loss of a consumer and in the FMCG industry a consumer once lost, seldom returns. With this perspective a study was taken up in a digitally controlled warehouse at a manufacturing facility of a major multi- national FMCG Company, located in the state of Assam, India. (Actual name of the organization is kept classified for obvious reasons.)
The objective of the study was to find out the errors in finished goods dispatch from the warehouse; identify the most error prone Stock Keeping Unit (SKU) and find out the underlying causes of these errors.
A multifunctional warehouse such as the centralised warehouse of the manufacturing unit studied, undertakes many functions and activities. The scope of this study has been limited to the finished goods dispatch process. This study examines the errors in finished goods dispatch, identify the causes for this error, identify which product is most prone to error and suggest mechanisms to reduce such errors.
# Associate Professor, Operations and Systems, at Dept. Of Business Administration, Tezpur University (A Central University), Tezpur – 784 028, Assam / India;
Email : tridib@tezu.ernet.in, tridib_rs@rediffmail.com; Mobile : +91 94350 80075
@ Pursuing Masters at Dept. Of Business Administration, Tezpur
University (A Central University), Tezpur – 784 028, Assam / India
The methodology used in this study was the direct observation of the warehouse functions; personal interaction with the people working in these functions. The study also involved use of flowcharts to structure the warehouse processes sequentially.
Mapping of the physical area of the warehouse was done to visually analyse the possible areas for occurrence of errors.
Pareto’s Principle was used to analyse secondary data on dispatch errors. The finding of the primary data was compared with the findings of the secondary data to arrive at a conclusion.
There are seven main functions being performed in the warehouse under purview of this study.
4.1.1. Raw material/ Packing material receiving and put-away: Material is sent by local vendors via trucks and by up country suppliers via train. All the raw material and packing material required by the manufacturing unit is directly received at the warehouse.
4.1.2. Quality checking and clearance: Once the material has been received at the warehouse and placed at the designated storage bins a quality checking and clearance procedure ensues. Material cannot be issued to the factory unless it is cleared by the quality checking team.
4.1.3. Picking and dispatch of materials to factory: As per the indents received from the production units, material is picked and dispatched to the factory.
IJSER © 2013 http://www.ijser.org
International Journal of Scientific & Engineering Research, Volume 4, Issue 4, April-2013 1181
ISSN 2229-5518
4.1.4. Finished goods receiving and put-away: Cartons for Local Delivery (CLD) of finished goods are received at the warehouse from the production units via conveyor belts.
4.1.5. Micro-clearance of finished goods: Finished goods received at the warehouse have to undergo a micro-clearance procedure before they can be cleared for dispatch.
4.1.6. Finished goods dispatch process: Finished goods are dispatched from the warehouse via road and rail as per the indents received from the central planning team.
4.1.7. Control : Control at each of the above mentioned points.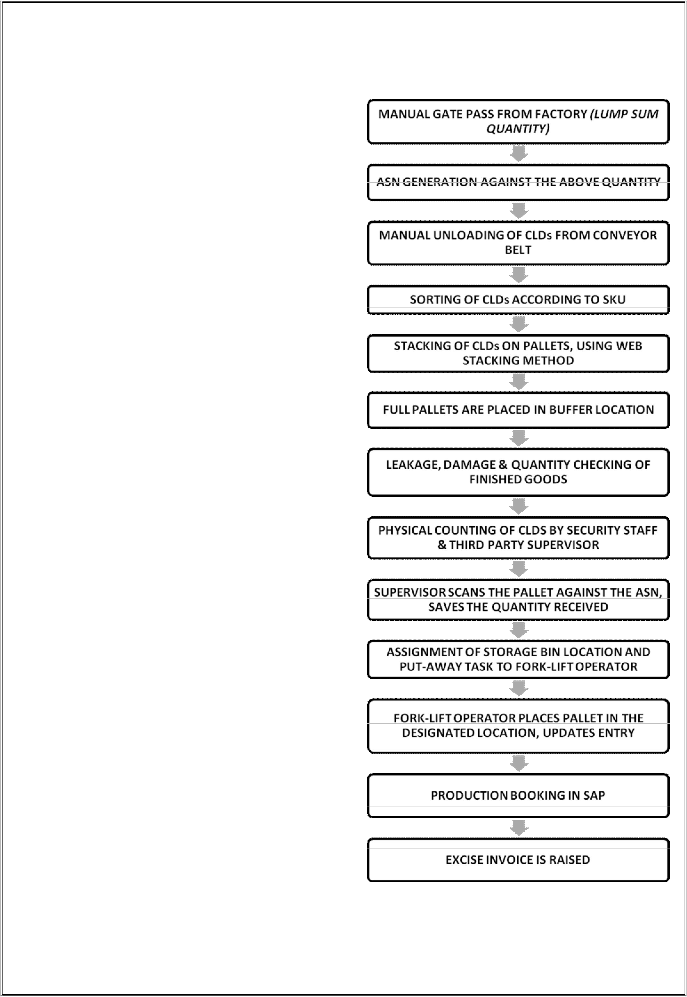
Focus in this study is to analyse the errors in finished goods dispatch.
The finished goods receiving process at the warehouse and process of finished goods dispatch from warehouse is mapped in detailed flow charts at Figure 1. This process is
4.2.1. Finished goods are sent from the factory on the conveyor belt.
4.2.2. Manual gate pass and Advanced Shipment Note
(ASN) generated against these goods.
4.2.3. CLDs of finished goods are manually unloaded from the conveyor belt.
4.2.4. CLDs are sorted according to their SKU.
4.2.5. Stacking on pallets is done using web stacking method.
4.2.6. Once the pallet quantity is reached, full pallets are placed in the buffer location for interim storage.
4.2.7. Leakage, damage and quantity checking of finished goods.
4.2.8. Physical counting of CLDs by security staff and third party supervisor.
4.2.9. Supervisor scans the pallet with his Hand Held Terminal (HHT) and updates the received quantity.
4.2.10. Storage bin location is marked on the pallet and put-away task is assigned to the fork-lift operator.
4.2.11. Fork-lift operator places the pallet in the designated storage bin and updates the entry in the system.
Production is booked in SAP and the excise invoice is raised.
Once the items are received in the warehouse, there are some items (mainly toothpaste) that have to undergo micro- clearance.
IJSER © 2013 http://www.ijser.org
International Journal of Scientific & Engineering Research, Volume 4, Issue 4, April-2013 1182
ISSN 2229-5518
I INDENTS FROM CENTRAL PLANNER
CHECKING FOR QC CLEARED STOCK AVAILABILITY
I CHECKING FOR TRUCK AVAILABILITY
TRUCK FITNESS CHECKING BY SECURITY STAFF
TRUCK LOADABILITY CHECKING (COMPARING CLD VOLUME WITH TRUCK VOLUME)
o-
WAREHOUSE ORDER AND MANIFEST GENERATION
FORK -LIFTOPERATO R
ASSIGNED TASK TO PICK
PALLETS FROM STORAGE BIN
0 FORKLIFT OPERATOR PICKS PALLET, & PLACES THEM IN THE AISLE. UPDATES THE ENTRY IN THE
SYSTEM
USING HHT
HAND PULLED TROLLEY TAKES PALLET TO THE LOADING BAY (MATERIAL IS LOADED IN THE
PRESENCE OF •S
ECURITY STAFF).
CLDs ARE UNLOADED INTO THE TRUCK ONE BY
ONE
SECURITY & THIRD PARTY SUPERVISER WILL COUNT THE LOADED QUANTITY & MAINTA IN
SEPARATE•
REGISTERS
WMS WILL BE UPDATED WITH BATCH NUMBER
AND QUANTITY
CHECKING BY GATE SECURITY AND SEALING OF TRUCK
STN GENERATION AND TRUCK IS ALLOWED TO EXIT
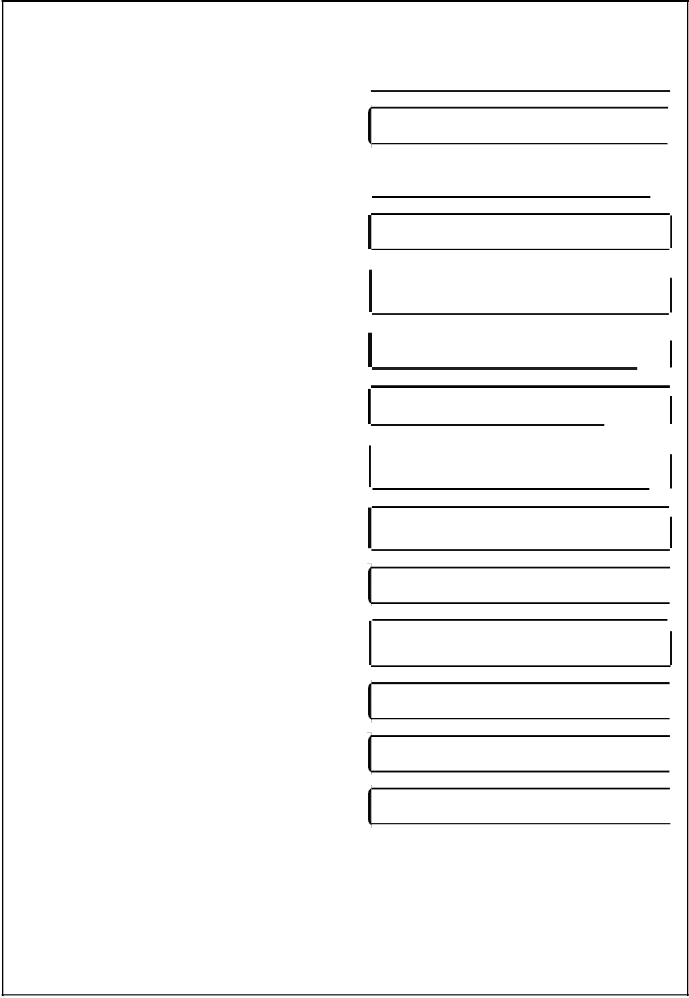
Figure 2: The finished goods dispatch process from the warehouse.
IJSER © 2013
International Journal of Scientific & Engineering Research, Volume 4, Issue 4, April-2013 1183
ISSN 2229-5518
As depicted in Figure 2., finally at end of this stage, the finished goods are ready for dispatch. The dispatch process begins with -
4.3.1. Indents from central planner
4.3.2. Checking for availability of quality cleared stock
4.3.3. Checking for truck availability
4.3.4. Truck fitness checking by security staff
4.3.5. Truck load-ability checking ( Comparing carton volume with truck volume)
4.3.6. Preparation of manifest (loading program) and generation of warehouse order
4.3.7. Assignment of task to fork-lift operator to pull pallets from storage bins
4.3.8. Fork-lift operator picks pallets and places them in the aisle and updates the entry in the system using his HHT
4.3.9. Hand pulled trolley takes pallet to loading bay
4.3.10. CLDs are unloaded into the truck one by one
4.3.11. Security and WC staff count the loaded quantity and maintain separate registers
4.3.12. WMS software is updated with details of the batch number and quantity of the material
4.3.13. Truck moves to exit gate for exit gate count and re- verification
4.3.14. Sealing of truck
4.3.15. Generation of final Stock Transfer Note (STN) in
SAP
4.3.16. Truck is allowed to exit from the gate
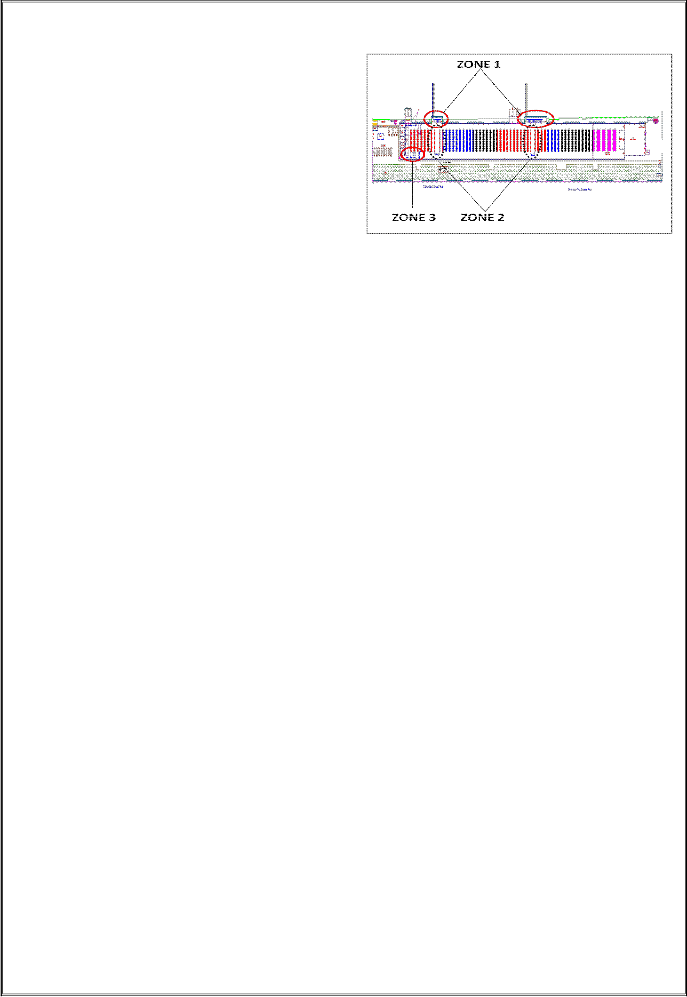
In the physical area of the warehouse three zones were found where potential errors in finished goods dispatch could be occurring. The zones were marked in the physical area map at Figure 3, viz.
1. Zone 1: End-of-Line (EOL) of the conveyor belts
2. Zone 2: Buffer Locations
3. Zone 3: Fork-Lift Area
Finished goods are received in the warehouse through the conveyor belts. There are separate conveyor belts for each production unit. Each conveyor belt has one window from which all the SKUs for that unit are received. Labourers – who are mostly illiterate – manually sort the CLDs and stack them in separate pallets.
There are three parameters by which labourers can distinguish CLDs of one SKU from the other.
1. SKU Code: This is a unique code for an item and each item has this unique code. Within the company, it is the name with which the item is referred to. For example: for Beauty Cream 1 (original trade name changed) with advanced multivitamin, the SKU code is FNVK1R7
2. Printing on the CLD: Labourers distinguish between different items by looking at the colour of printing on the CLD.
3. CLD Dimension: CLDs are stacked on the pallets using the web stacking method. In case, a carton is placed on a wrong pallet, it can be identified as its dimensions will not match with the others and web stacking will not be possible.
In practice, intermixing on a pallet is happening since there is inadequate visual control on the cartons; i.e., if the three parameters used by labourers to visually distinguish the cartons are ineffective.
Once the pallet quantity has been reached, the pallet is pulled from the EOL conveyor and placed in the buffer locations for interim storage. The supervisor marks the location of the storage bin where it is to be placed and fork-lift operator places the pallet in the designated storage bin.
All dispatches from the warehouse are in pallets. When a particular item is to be dispatched, the system indicates the location of the storage bin and the pallet number.
During sorting of cartons (CLD) at the EOL conveyor belt if a wrong item gets mixed in the web stack it will get dispatched as such.
IJSER © 2013 http://www.ijser.org
International Journal of Scientific & Engineering Research, Volume 4, Issue 4, April-2013 1184
ISSN 2229-5518
Zone 2 in Figure 3. denotes buffer locations near EOL conveyor belts of both units. These locations are meant for interim storage of full pallets of finished goods before they are put-away into the designated storage bins by the fork lift operators. The space in the buffer locations is not sufficient to accommodate all the pallets. Thus they have to be placed elsewhere; in the sides and in between other racks.
In a random check during the course of the study 165 full pallets of finished goods were found in these places. Pallets placed between racks block the aisles and the fork- lifts cannot access these racks. As a result materials placed in these racks cannot be dispatched even if the system indicates that.
Fork-lifts are the life blood of warehouse, including material receiving, put-away, picking and dispatch. At the time of this study, there were five fork-lifts operating in the warehouse to handle all the requisite functions.
It was observed that insufficient and inefficient fork-lift activity was one of the main causes of bottlenecks in the warehouse operations. There is tremendous pressure on the fork-lift operators and the management has set a standard of 200 pallets per fork-lift per shift. Data on fork-lift activity is summarised in Table 1, and Shift Efficiency depicted in Figure 4.
three shifts. As a result of inefficiency in fork-lift activity, the number of full pallets of finished awaiting put-away increases and thus they cannot be accommodated in the buffer locations. When they are placed in between other racks, they obstruct fork-lift movement and thus affecting the performance of the fork-lifts. This leads to violation of FIFO and dispatch hygiene in the warehouse, and treatment of this aspect is kept outside the purview of the present study.
To substantiate the findings of the preceding sections primary data was collected at
i. End-of-Line of the Conveyor Belts ii. Truck Loading Bay
At the EOL of the conveyor belts, the process of sorting of
CLDs and stacking them on pallets was observed.
Observations were recorded for a total of 7009 CLDs
comprising a total of 41 SKUs.
7 cases of error were found in the observations made. This translates into an error rate of 998.7 ppm, if we convert the figures into Six Sigma terminology, i.e. DPMO (Defects per Million Opportunities), and that proportion is depicted as a proportion in Figure 5.
PERCENTAGE EFFICIENCY OF MHE ACTIVITY | |||
SHIFT | A | B | C |
AVERAGE/DAY | 956 | 1033 | 567 |
AVERAGE/PERSON/DAY | 159 | 172 | 94 |
STANDARD/PERSON/DAY | 200 | 200 | 200 |
SHIFT EFFICIENCY | 80% | 86% | 47% |
of the conveyor belts; proportion.
At the truck loading bay, four trucks loaded with finished goods were partly unloaded to check for interchange of SKUs. As depicted in Table 2, out of a total of 5187 cartons checked, it was found that 26 of them didn’t match with the Stock Transfer Note (STN).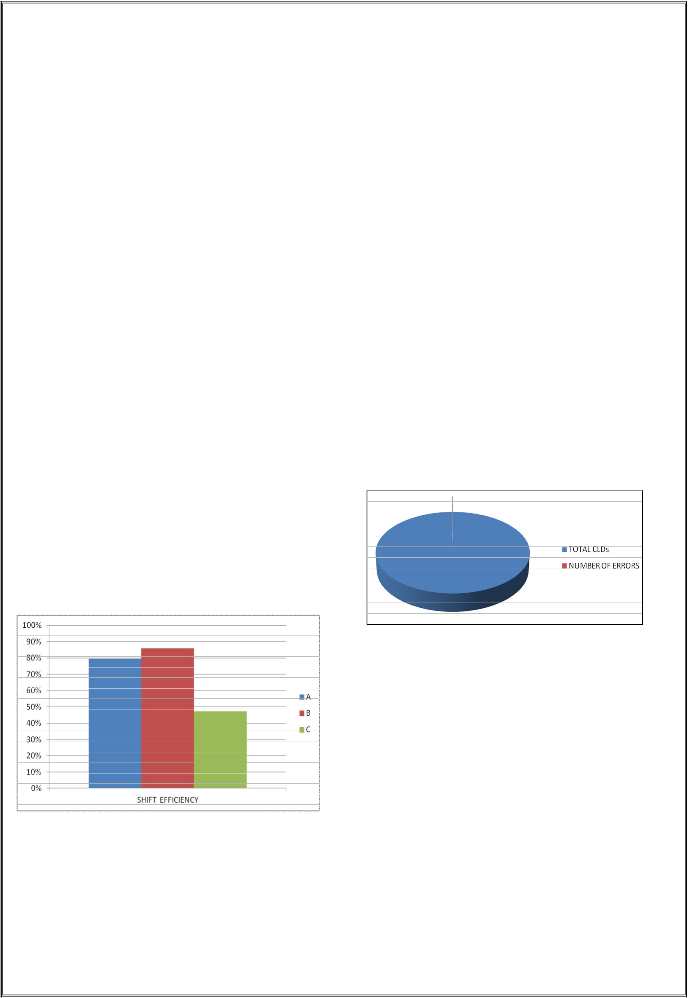
It was seen that operational efficiency of fork-lift activity was below the standard in all the shifts. However, in the night shift (Shift C) the efficiency was extremely low at merely 47%.
There is a circular causal relationship between the problems is zone 2 & 3. Cartons of finished goods are being received continuously in the warehouse during all
IJSER © 2013 http://www.ijser.org
International Journal of Scientific & Engineering Research, Volume 4, Issue 4, April-2013 1185
ISSN 2229-5518
This translates to an error rate of 0.50%, or 5013 ppm, again a high proportion in terms of Six Sigma accuracy target, as depicted in Figure 6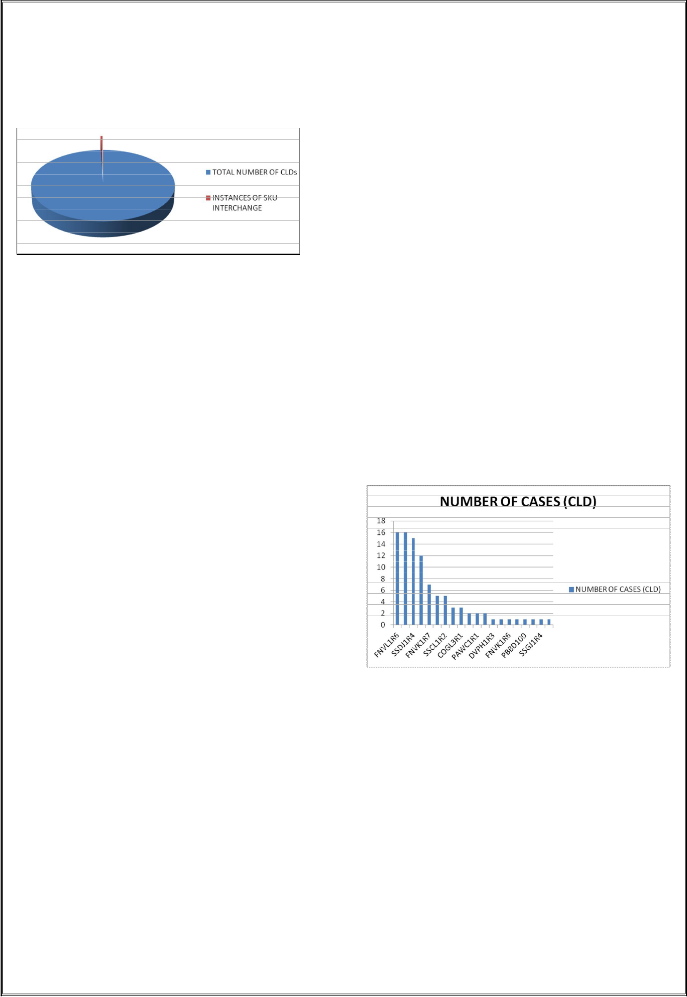
Apparently these numbers are extremely low, and almost negligible. However for an organization striving for Zero- Defect operations in line with Six Sigma philosophy, even this small number is of high concern.
In the first case, errors of the order of nearly 1000 ppm can be loosely translated to 1000 DPMO (defects per million opportunities) – a number of high concern within the ambit of Six Sigma.
In the second case, errors are of the order of more than
5000 ppm, or equivalent DPMO, which is of even more
concern.
To confirm veracity of our claim that items with inadequate visual control mechanisms on the CLDs had maximum chances of error we analyse the report on dispatch errors using Pareto analysis. This would allow us to identify the specific causes of concern, as well as the quantum of impact. One can add the financial implications if related information is supplemented with. However, as a first level study, this study limits itself only with volume of discrepancies, rather than value of the same.
(We assume the classic Pareto distribution of 70 : 20 : 10, on a approximation basis)
SKUs as per secondary data, using.
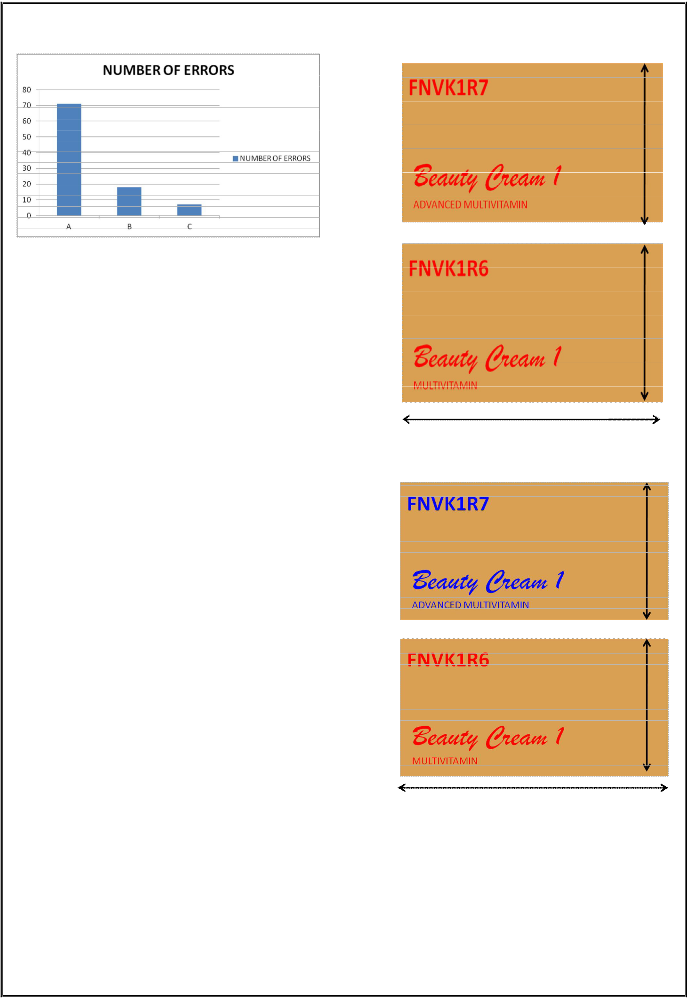
CATEGORY | NUMBER OF ERRORS | PERCENTAGE OF TOTAL ERROR | PERCENTAGE OF SKUs IN THE CATEGORY |
A | 71 | 73.95833333 | 30 |
B | 18 | 18.75 | 35 |
C | 7 | 7.291666667 | 35 |
TOTAL | 96 | 100 | 100 |
Analysis
IJSER © 2013 http://www.ijser.org
International Journal of Scientific & Engineering Research, Volume 4, Issue 4, April-2013 1186
ISSN 2229-5518
Analysis
It is found that the within our random study, the six SKUs viz. FNVL1R6, SKBC5R4, SSDJ1R4, FNVL1R7, FNVK1R7, and SSCL1LB, contribute 74% of total errors. Placing traditional A:B:C proportions of Pareto analysis, these can be categorised under A category items, i.e. those most likely to cause discrepancy.
Within these SKUs, we now carry out a visual inspection regarding possible opportunity of defect. It was noted that the SKUs - FNVK1R7, FNVK1R6, and FNVL1R6 are major contributors to dispatch errors.
These items have the same carton dimension, similar SKU
codes and same colour printing on the CLDs.
This confirms the initial argument that dispatch errors occur due to incorrect sorting and stacking of CLDs at the EOL of the conveyor belts. Incorrect sorting occurs because of inadequate visual identification of the cartons.
To mitigate the above problem, it is being suggested that enhanced visual control mechanism on the error prone SKUs be introduced to reduce dispatch errors.
Possible remedial suggestions provided are
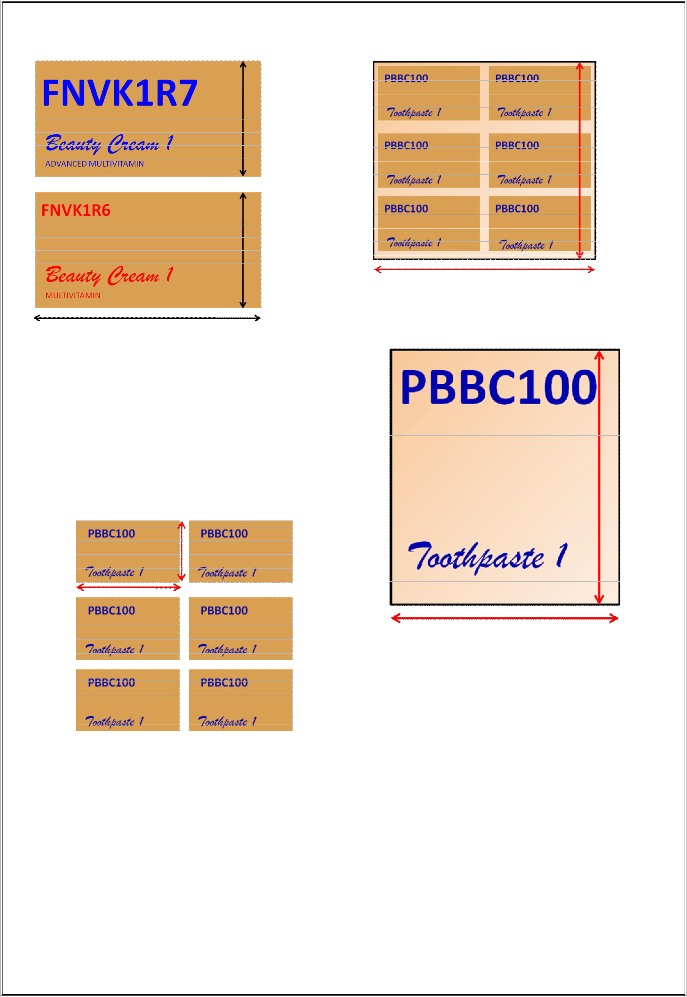
8.1. Printing on CLDs of error prone SKUs should be in different colours; it will aide labourers in easier visual identification and error detection. This is illustrated in Figure 9 and Figure 10. note that all other identifiers of the cartons are same, except the word “MULTIVITAMIN”.
8.2. Increase the font size of the SKU codes; it will help labourers in easier visual identification and error detection. This suggestion is illustrated alongwith its problem area as Figure 11.
IJSER © 2013 http://www.ijser.org
International Journal of Scientific & Engineering Research, Volume 4, Issue 4, April-2013 1187
ISSN 2229-5518
8.3. Macro packing of CLDs is suggested for CLDs with small individual dimensions and inadequate visual control. Macro packing will enhance visual control and protect small CLDs from damage in transit, as depicted in Figure 12,
13 and 14.
This study provides an insight into one aspect of operation of a warehouse that stocks and despatches FMCG items. A single (set of) problem which otherwise would have been overlooked as routine aberrations is studied and practical solution, with no major policy modifications, are suggested for allowing the organization to march ahead towards zero-defect operations, and thereby strive for Six Sigma level.
_
IJSER © 2013 http://www.ijser.org

International Joumal of Scientific & Engineering Research, Volume 4, Issue 4, April-2013
ISSN 2229-5518
1188
When the authors visited the place aJ study recently, it was a welcome sight to note that tlr organization had initiated measures to adopt all the three suggestions. In a subsequent study tlr authors hope to find marked improvement of operational efficiency. Th:reby making it difficult for
error/s to occur on this count.)
IJSER ©2013