International Journal of Scientific & Engineering Research, Volume 4, Issue 7, July-2013 216
ISSN 2229-5518
Intelligent Technique for Grading Tropical
Fruit using Magnetic Resonance Imaging
Wasiu A. Balogun, Momoh-Jimoh E. Salami, Michael J. McCarthy, Yasir M. Mustafah, Abiodun M. Aibinu
Abstract— Recent application of modern marketing techniques coupled with intelligent agricultural systems of production has transformed small scale farming into large scale, in most part of the world. Characteristically, most of the tropical fruits, such as orange, appeared edible physically but internally such fruits might be defective based on their tissue and juice. Eventually, these fruits, via the market and undetected, usually get to the consumers who encounter the unfavourable status of the fruits. Our purpose, in this study, is to develop a non-destructive method to predict the status of orange fruits, based on internal quality. Graph of histogram showing the levels of different four colour intensities were acquired and analysed. The features extracted from Magnetic Resonance Imaging (MRI), using any of the two proposed methods, were applied as an input to train artificial neural network (ANN) in order to predict the orange fruit status. Different structures of multi-layer perceptron neural networks with feed-forward and back-propagation learning algorithms were developed using MATLAB. The theoretical background of MRI and artificial neural network (ANN) backpropagation were also explained. At hidden neuron value of 20, search is for backpropagation and number of neurons in the hidden layer to optimize the ANN. Levenberg-Marquardt algorithm (trainlm) gave the best performance fitness out of different types of backpropagation algorithm used with least Mean Square Error (MSE) of
0.0814 corresponding to R-value of 0.8094. This work shows that ANN and MRI have the capability of predicting the internal content and detect defect fruit based on water proton content.
Index Terms: Magnetic Resonance Imaging, Artificial Neural Network, image analysis, internal quality, backpropagation algorithm.
—————————— ——————————
raditionally, quality inspection techniques of fruits have been manual, but these have been highly inconsistence in accuracy, time consuming, tedious and relatively expen-
sive. Thus, the application of new techniques in fruit quality assessment is necessary in order to minimise wastage because most of these fruits are readily perishable. Furthermore, fruit quality grading is becoming a mandatory condition in recent time, although quality of fresh fruits could be defined differ- ently depending on a consumer's preference and final utility, but a standardization to identify the degree of quality in a commodity is necessary for marketing fresh and safe products. Common varieties of tropical fruits sold and consumed widely include oranges, watermelon, grapes, bananas, avocado, pa- paya and pineapples.
Grading of fruit is essentially based on external quality as- sessment which is commonly applied and internal quality
————————————————
• Corresponding Author: Balogun Wasiu Adebayo, MIEEE, curently pur- suing a postgraduate degree program in Mechatronics Engineering in International Islamic University (IIUM), 53100, Gombak, Malaysia. A Re- search Scholar, University of California, Davis, United State of America.
E-mail:balogunwa1999@yahoo.com
• Co-Author 1: Momoh-Jimoh E. Salami is a Professor in the Department of
Mechatronics Engineering, IIUM, Malaysia. E-mail:momoh@iium.edu.my
• Co-Author 2: Michael J, McCarthy is a Department Chair and a Professor
in the Department of Food Science and Technology, University of Califor-
nia, Davis, United State of America. Email:mjmccarthy@ucdavis.edu
• Co-Author 3: Yasir M. Mustafah is an Asst. Professor in the Dept. of
Mechatronics Engineering, IIUM, Malaysia. E-mail:yasir@iium.edu.my
• Co-Author4: Abiodun M. Aibinu, was with International Islamic Universi-
ty Malaysia. He is now with Electrical Engineering Dept., Federal Univer- sity of Technology, Minna, Niger State Nigeria.
E-mail: maibinu@gmail.com.
grading which is seldom used (Du and Sun, [1]). Major fruit’s quality factors includes size, shape, colour, defects (external quality) and nutrition, defect, texture, flavour (internal quali- ty) (Du and Sun [1], Barreiro et al [2], Ruiz-Altisent et al [3], kleynen et al [4]).
The introduction of different techniques to determined the internal quality of fruits is becoming a principal challenges in recent time. Most of the techniques currently used for internal quality measurement operate in a destructive mode, however, non-destructive quality evaluations of fruit product is becom- ing necessary for agricultural and food industry (Du and Sun, [1]).
Various non-destructive methods, such as ultrasonic, vibrated excitation, impedance, laser spectroscopy, reflectance, X-ray Imaging, transmittance, absorbance spectroscopy and near infrared imaging (NIR) have been developed to assess the in- ternal fruit quality (Yacob et al [5]). Meanwhile, their industri- al applications to fruit quality grading remains limited due to problems with accuracy and methodology. On the other hand MRI allows a non-destructive study of the internal properties of fruits and applying this at a low time cost would bring a desirable added value to the product (Ruiz-Altisent et al [3], Zion et al [6], Kerr et al [7]).
The Image processing method facilitates automatic fruit grad- ing via precise, consistent, reliable and quantitative infor- mation, particularly, when handling large volume of fruits. Tropical fruits that are internally defective hardly show any sign of damages on their rinds, thus making those fruits unfit for eating or used for industrial purposes (Ruiz-Altisent et al [3], Yacob et al [5]).
IJSER © 2013 http://www.ijser.org
International Journal of Scientific & Engineering Research, Volume 4, Issue 7, July-2013 217
ISSN 2229-5518
MRI is an imaging technique that utilized the magnetic prop- erties of nuclei in relation with radio frequency and magnetic field. It is sensitive to the local environment of water and oil which are main composition of fruit. Furthermore, MRI is used to acquire two as well as three-dimensional images of biological systems from obscured materials. It predict the to- mato maturity with PLS-DA model for classification and shows that different maturity stages are embedded in MR im- ages signal intensity (Zhang and McCarthy[8]).
The viability of MRI to distinguish frozen-thawed products such as Kiwis (Kerr et al [7]) blueberries (Gamble [9]), and courgettes (Duce et al [10]) by means of changes in the contrast of the magnetic resonance images have been studied. A recent study have shown a longitudinal NMR parameter measure- ment of Japanese pear fruit during the growing process using a mobile magnetic resonance imaging system to determine the relaxation times and diffusion coefficients of the fruit relative to the weight. This justified the reliability of MRI for determin- ing the internal quality of the outdoor pear (Geya et al [11]).
The usage of MRI in detecting freeze damage in fruit was re- ported. An algorithm was applied to extract several mathe- matical features for the characterization of each sample and the fruits were cut for visual inspection and performed refer- ence classification, after preliminary analysis, (Barreiro et al [2]).
Milczarek et al in [12] developed a method to determine in- jured pericarp tissue in tomatoes using MRI equipment. Sam- ples of heavily bruised and non-bruised tomatoes were manu- ally selected on a conveyor and each was inserted into the bore of an industrial-grade (1T) MR imaging system Aspect AI, with the stem/calyx axis along the (horizontal) bore. Thir- teen MR images were obtained for each sample, while the Fast Spin Echo (FSE) image had an effective echo time of 281 ms and produces T2-weighted contrast in the images. After imag- ing, the samples pericarp were analysed in the conductivity test. The hyper-intense pericarp pixels indicate areas of high conductivity result for extensively bad membrane and hypo- intense pericarp pixels for good membrane.
MRI has been used to measure the moisture and oil content of agricultural materials showing a difference between image pixels corresponding to good and damage tissue. The internal damage resulting from core breakdown and browning can was easily detected in pears and apples fruit. This has also proved to be a reliable method to evaluate other fruit qualities such as ripening, core breakdown, bruises, worm, chilling and freezing damage. Thus, MRI methods have versatile applica- tion for fruits sorting and grading technology (Gonzalez et al [13], Hernandez-Sanchez et al [14]).
Efficient combination of colour and texture features for fruit recognition has been carried out by the minimum distance classifier based on the statistical and co-occurrence features derived from the Wavelet transformed sub-bands. This meth- od is commonly applied as a class of techniques for segment-
ing out region of interest in an image. Background subtraction is derived from the subtraction of the observed image from the estimated image and thresholding the result to generate the images of interest. Finally, training and classification were applied using Minimum Distance Classifier (Arivazhagan et al [15]).
Yacob et al in [16] detected Harum Manis Mango weevil de- fect with the aid of dielectric sensor trained with neural net- work backpropagation. The procedure was repeated for data acquisition collected from thirty samples out of which sixteen samples for training and fourteen samples for testing. The training and testing started from upper epochs to lower epochs. They reported that B training set has higher rate of performance than set A with a learning rate of 0.01 and that smallest test error comes from set B which is 0.0870.
Automatic fruits identification systems with the combination of Fourier descriptors, artificial neural network and spatial domain analysis were proposed. The colour and shape infor- mation obtained from digital camera images of fruit samples were used as input to ANN training for fruit sorting and iden- tification purpose by Aibinu et al in [17]. The application of neural network model to predict the vase life of cut roses planted in a greenhouse has shown that the ANN is better in prediction than traditional statistical techniques (In et al [18]).
The objectives of this study are to identify the ability of images obtained from MRI equipment in order to determine the inter- nal quality of orange fruit sample based on defect (internally dry juice). Furthermore, an artificial neural network model using colour features of internally dry juice and good fruit derived from MRI images is to be developed for predicting the internal quality of the orange fruit.
This section presents the methodology and development of algorithm for the implementation of the proposed intelligent fruit grading system (IFGS).
Orange samples used for this research were obtained from fruit market and were sorted, manually, into good (internal non-dry juice) and defect (internal dry juice) orange fruits by cutting for visual inspection.
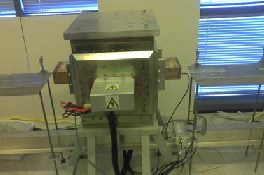
The MRI image data acquisition was performed using Aspect MRI equipment (Figure 1) at Professor, Michael J. McCarthy Laboratory, University of California, Davis, USA. The MRI system usually consists of hardware parts such as Electronics cabinet, Magnetic field gradient system, Permanent magnet, Radio-frequency system and Computer/Reconstruction sys- tem.
IJSER © 2013 http://www.ijser.org
International Journal of Scientific & Engineering Research, Volume 4, Issue 7, July-2013 218
ISSN 2229-5518
Fast Fourier Transform (FFT): Conventionally, MRI is a Fou- rier transforms based method. Frequency or phase encoding is always carried out and the data obtained are kept in a line K- space, during data acquisition. Fast Fourier Transform tech- nique is applied to convert the collected data in K-space to an image which is done by converting signal intensity in time domain to signal intensity in frequency domain, mathemati- cally. It is also known as inverse Fourier transform (Nishimura [19], Aibinu et al [21], Aibinu et al [22]).
The Larmor equation (also known as Spin resonance equation) indicates the rate at which proton precises around the external magnetic field (Hashemi et al [20]) stated in (1).
ω = γB0
(1)
Bloch Equation is the description of magnetisation dynamics. The Bloch equation is stated in (2).![]()
j +[ ![]() -
- ![]() ]k (2)
]k (2)
The MRI equation is shown as follows in a 2D form as:
S (Kx, Ky) =
f [( x, y)]
(3)
ar spin exhibit resonance (Hashemi et al [20]).
f stands for spatial information with inverse transform gives a
data I as stated in (4).
the external magnetic field B0. It is the period required for the![]()
I ( x, y) = f
S (kx, Ky)
(4)
*
Type equation here.63% of the longitudinal magnetisation to
recover in the tissue (Nishimura [19]).
Image intensity I ( x, y) depends on T1T2T2 , ρ and D, which
are Relaxation times, Spin density and Diffusion coefficients
respectively (Zhang and McCarthy [8], Nishimura [19], Aibinu
et al [21]) as stated in (5).
the Mxy component decays. It is caused by nuclei exchanging energy and defined as the period it takes 63% of the transverse magnetisation to be lost which is also known as spin-spin re-
I = f [
T1 ,T2
,T * , ρ, D]
(5)
laxation time (Nishimura [19]).
With spin echo images, the intensity of the signal (S) of each
pixel in the image is a function of intrinsic properties namely:
Proton longitudinal (T 1 ), Proton density (PD), Transverse re- laxation times (T 2 ) with the experimental values as the echo
time (TE) and the repetition time (TR). The signal intensity (S) is stated in (6) (Zhang and McCarthy [8], Hashemi et al [20] Aibinu et al [21]).
RF Coils: it produces the magnetic field B1 which rotates the net magnetization in a pulse sequence. It also detects the
S = K * PD[1 −
exp(
−TR
![]()
T1 )] exp(
−TE
![]()
T2 )
(6)
transverse magnetization as it is precise in the XY plane. There are three types: transmit and receive coils, receive coils and transmit coils only (Nishimura [19], Hashemi et al [20]).
The model used for this work are broadly divided into the
following stages applying two methods as shown in Figure 2
and the algorithms were developed with MATLAB.
The experiments were performed on a 1T permanent magnet
Aspect MRI system (Figure 1) using a 60 x 90 cm elliptical RF
IJSER © 2013 http://www.ijser.org
International Journal of Scientific & Engineering Research, Volume 4, Issue 7, July-2013 219
ISSN 2229-5518
coil. The orange samples images were placed on a plastic sample holder and position manually at the center such that the axis of the sample aligned with the center of the coil. Dur- ing the alignment and de-alignment an emission and absorp- tion of energy occurred in the RF of the electromagnetic. An image of the longitude slice was obtained along the axis of each sample orange with different sequences. Each sequence used was positioned such that all information on water proton is included in the MR image intensity and the pixels of each image were 128 x 128. Sixty-four MRI images slides were ac- quired from each fruit samples following steps described in table 1.
Table 1: Description of each step in the acquisition process (Aspect imaging [23]).
![]()
In an 8-bit image gray scale there are 256 intensities and indi- vidual histogram of blue, red and green channels can be taken or a 3-D histogram with the three axes indicating blue, red and green channels, each point brightness indicating the pixel count. If there are only two objects in the image, histogram is always applied. (Fisher et al [24], Liang and Lauterbur [25], Gonzalez et al [26]).
If the intensity gray-level histogram is proportional to a func-
tion z(g) with an intensity value each
g ∈ [0.......L]
the
quantity of pixels in the region of interest that have intensity equal to g is stated in equation 8 where Ng is the quantity of pixels in the region of interest or image that have intensity equal to g.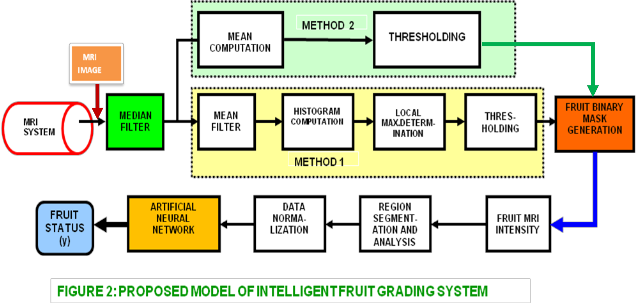
IJSER © 2013 http://www.ijser.org
International Journal of Scientific & Engineering Research, Volume 4, Issue 7, July-2013 220
ISSN 2229-5518
z( g ) = N g
(7)
Measure of Smoothness
Equation (7) leads to a function known as the probability den- sity derived from normalization of histogram with the number of pixels in the image given in (8) as
R = 1 −
1
![]()
1 + σ 2
(10)![]()
p( g ) = z( g )
Measure of Skewness of the histogram
L −1
M (8)
m3 ( z) =
∑
i =0
(Z i
− m) 3 p( z )
(11)
The histogram is useful for thresholding since the information in the graph represent the pixel distribution as function of to- nal variation. The obtained thresholding value can further be
Measure of Uniformity show another texture content as
L −1
utilized for image segmentation, edge detection and co-
occurrence matrices (Gonzalez et al [26], Bhaiya and Verma
[27], Hecht-Nielsen [28]).
= ∑
i =0
p ( zi )
(12)
Entropy is the measurement of randomness or variability of the image
L −1
e = −∑ p( zi ) log 2 p( zi )
groups of pixels. There are four types of segmentation meth- ods such as region, histogram, edge and classification segmen-
i =0
(13)
tation (Du and Sun [1], Fisher et al [24], Gonzalez et al [26]).
Statistical Method: It is describe as the approach that uses the gray-level histogram to describe the properties of texture whether coarse, grainy, dry, wrinkled, rough, hard, soft, or smooth. Let Z, L and P(zi ) stand for random variables indicat- ing gray-level histogram, number of evident gray levels of intensity and corresponding histogram respectively. Then, the following are obtained. Mean (m) which is the average inten- sity is computed as
L −1
m = ∑(Zi) p(Zi)
input and output to neural network system should be in the
same range in order to achieve high performance which is
performed by normalization. The input and output features
are normalized by (14) so that the mean is zero and the stand-
ard deviation is one.![]() (14) Where
(14) Where ![]() =initial values,
=initial values, ![]() final values of a feature and
final values of a feature and![]()
mean, ![]() =standard deviation of class values belong
=standard deviation of class values belong
to the image features. Finally, principal component analysis is
then used on all the image features data set to avoid any varia-
tion (Gonzalez et al [26], Bhaiya and Verma [27], Hecht-
Nielsen [28], Jayabalan [29]).
Artificial Neural Network (ANN) was first introduced in 1943 by physiologists, McCulloch and Pitts as an interconnection of neurons that perform a process to produce an output. Its per- formance resemble that of human brain and when supply with enough samples, they can predict various variables such as daily temperature, climate and earthquake, detect or classify the presence of pests in vegetables and fruits, detect fault in assembly plant and even recognize human face and handwrit- ten characters (Bhiya and Verma [27], Hecht-Nielsen [28], Kumar [30]).
The purpose of ANN is to generate a network system with little errors but also yield good result from the testing data set. There are two types of training algorithm namely: Supervised-
i =0
(9)
the target is available and the network determines the best set
of weights by reducing the error between the output data and
IJSER © 2013 http://www.ijser.org
International Journal of Scientific & Engineering Research, Volume 4, Issue 7, July-2013 221
ISSN 2229-5518
the target. Unsupervised - only the input data set is given to the system, which then determines similar inputs without any
W ( j +1) = W j −η
![]()
∂E ( j )
previous knowledge. (Hecht-Nielsen [28], Kumar [30]).
ik ik
∂Wik
(17)
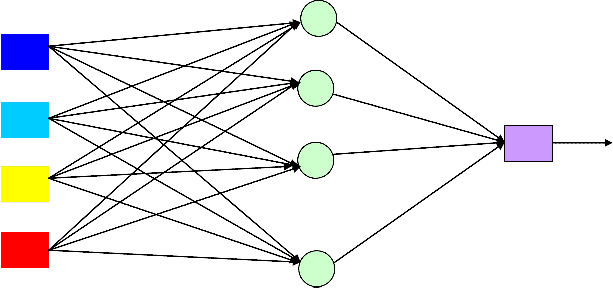
For this research work, prediction is achieved with the artifi- cial neural network MATLAB. The study of techniques of pre- diction and diagnosis shows that the most widely used ANN is the three layers which comprises of input, hidden and out- put layer (Figure 3). The output result relies on the weight used on the data linking the output and hidden layers. During training and learning, weights are the value which ANN works on to realise a result that is very close to the required output. There should be a constant adjustment in the weight value equal to the error between output of network and the
1
#1
2
#2 y
Σ
3
#3 ||
#4
25
INPUT LAYER
HIDDEN LAYER
OUTPUT LAYER![]()
![]()
![]()
actual output (Bhaiya and Verma [27], Hecht-Nielsen [28], Kumar [30]). The input layer linear neurons and hidden sig- moidal neuron equation is stated in (15) and (16) respectively.
δ ( x) = x
(15)
δ ( x) =
1
![]()
1 + e −λx
(16)
Computation of input-to-hidden neurons is achieved with
(17).
IJSER © 2013 http://www.ijser.org
International Journal of Scientific & Engineering Research, Volume 4, Issue 7, July-2013 222
ISSN 2229-5518
.
shown in Figure 3. The input dimension is four colour intensi- ty features, therefore the number of nodes in input layer is four and the number of nodes in output layer is one
work over entire training set, stated in (18) with Q and ε k
stand for a set of training vector and instantaneous summed
squared error respectively. (Bhiya and Verma [27], Hecht-
Nielsen [28], Kumar [30]).
1 Q
![]()
ε = ∑ε k
Q k =1
(18)
The orange images acquired from MRI were successfully re- constructed and processed to produce signal intensity data based on number of pixel obtained from region of interest (ROI) that served as an input to the neural network. The backpropagation proposed in this paper is three-tier model as
The image features data (table 2) is divided into 110 training data sets for the input and output value and 60 data sets for testing value. These data sets were loaded into MATLAB workspace. The input and output layer neurons are linear purelin but the hidden layers are sigmoid signal function tan- sig.
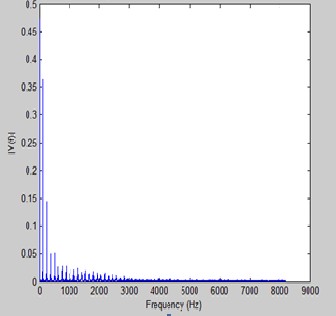
MRI images acquired were successfully processed with
MATLAB code developed. Figure 4 and 5 shows one example
IJSER © 2013 http://www.ijser.org
International Journal of Scientific & Engineering Research, Volume 4, Issue 7, July-2013 223
ISSN 2229-5518
each of good and defect orange signal intensity histograms obtained from the segmented region of interest (ROI) of the image. There was a change in image texture explained with the histogram analysis. At the signal intensity value of the histogram the number of pixel is higher in defect orange get- ting to peak at 0.37 in Figure 4 compared with the histogram of good orange having a peak value of 0.32 as shown in Figure
5. These intensity features obtained from the MRI images serves as the input to the network.
In this study, important factors for using neural network is for internal quality prediction of the orange fruit depend on the proper selection of the following two parameters, namely fast- est backpropagation and number of hidden neuron and the Corresponding value of mean square error and R-value. The neural network model considered in this work is three-tier model as shown in Figure 3. The dimension of the input vector and node used is four with one output node, twenty five hid- den neuron numbers and fifty epochs.
Corresponding Correlation value
The images were randomly divided into three sets, one hun- dred and ten for training, sixty images for testing and valida-
tion. The output value is y ∈ [1.0] . If y is 1, it indicates that
there is high possibility of good orange fruit (internal non-dry
juice) and whereas if it is 0, it means that there is high possibil-
ity of defect orange fruit (internal dry juice). The list of eight
used backpropagation algorithm considered in the study is
shown in Table 3.
Optimization procedure of neural network architecture relies on adequate selection of neurons number in hidden layer that gives the lowest means squared error. Table 3, indicates eight used backpropagation algorithm and corresponding mean squared error (MSE) with regression value obtained. The ANN output and corresponding targets are in the post- processing regression analysis which feedback different values R-values.
The minimum mean squared error (MSE) obtained is 0.0814 which occurred at the optimum hidden neural number value of 20 as indicated in Figure 6. From Figure 7 and Table 3 the optimum preferable training algorithm is Levenberg- Marquadt (trainlm) backpropagation with R-value of 0.8094 which corresponds to the least mean squared error value.
IJSER © 2013 http://www.ijser.org
International Journal of Scientific & Engineering Research, Volume 4, Issue 7, July-2013 224
ISSN 2229-5518
249, 2004.
[2] P. Barreiro, C. Zheng, D. Sun, N. Hernández-Sánchez, J. M. Pé
rez-Sánchez, and J. Ruiz-Cabello. "Non-destructive seed detec- tion in mandarins: Comparison of automatic threshold methods in FLASH and COMSPIRA MRIs." Postharvest Biology and Tech- nology, vol. 47, no. 2, pp. 189-198, 2008.
[3] M. Ruiz-Altisent, L. Ruiz-Garcia, G. P. Moreda, R. Lu, N. Her- nandez-Sanchez, E. C. Correa, B. Diezma, B. Nicolaï, and J. Gar- cía-Ramos. "Sensors for product characterization and quality of specialty crops—A review." Computers and Electronic in Agricul- ture, vol. 74, no. 2 pp. 176-194, 2010.
[4] O. Kleynen, V. Leemans, and M-F. Destain. "Development of a multi-spectral vision system for the detection of defects on ap- ples." Journal of Food Engineering, vol. 69, no.1, pp. 41-49, 2005.
This study introduced the neural network method and tested its usefulness as an approach to classify MRI image of orange fruit into defect or good classes based on pixel intensity level. Therefore, imaging using MRI allow a high chance of deter- mining internal quality of the fruit with a proper ANN model for prediction. Evaluation of models performance was tested based on R-value and mean squared error stated in Table 3.
The network with structure Levenberg-Marquardt (trainlm) algorithm backpropagation and twenty hidden neuron pre- dicted the internal quality with maximum correlation coeffi- cient R-value of 0.8094 coupled with the lowest mean squared error (MSE).
The result also showed that using different forms of training algorithm, high prediction accuracy can be achieved. The fu- ture work require development of more robust system with other neural network structural parameters and more image data so as to improve the model accuracy, since the higher the amount of input data, the lower the mean squared error.
The authors wish to thank Asst. Prof. Mecit Oztop and Dr Lu Zhang UC Davis, US, for their valuable guidance at every step in making this research work Successful.
[1] C. J. Du, and Sun, D. W, “Recent developments in the applica ations of image processing techniques for food quality evalua tion,” Trends in Food Science & Technology, vol. 15, no. 5, pp. 230-
IJSER © 2013
[5] Y. Yacob, H. Ahmad, P. Saad, R. Aliana, A. Raof, and S. Ismail. "A comparison between X-ray and MRI in postharvest non- destructive detection method." In Proceedings of the International Conference on Information Technology and Multimedia at UNITEN (ICIMU’05), Malaysia. 2005.
[6] B. Zion, M. J. McCarthy, and P. Chen. "Real-time detection of pits in processed cherries by magnetic resonance projec- tions." LWT-Food Science and Technology, vol. 27, no. 5, pp. 457-
462, 1994.
[7] W.L. Kerr, C. J. Clark, M. J. McCarthy, and J. S. De Ropp. "Freez- ing effects in fruit tissue of kiwifruit observed by magnetic res- onance imaging." Scientia horticulturae, vol. 69, no. 3, pp. 169-179,
1997.
[8] L. Zhang and M.J. McCarthy, “Measurement and evaluation of tomato maturity using magnetic resonance imaging” Posthar- vest Biology and Technology, vol. 67, pp. 37–43, 2012.
[9] R. G. Gamble, "Non-Invasive Determination of Freezing Effects in Blueberry Fruit Tissue by Magnetic Resonance Imag- ing." Journal of food science, vol. 59, no. 3 pp. 571-573, 1994.
[10] S. L Duce, T. A. Carpenter, and L. D. Hall, "Nuclear magnetic resonance imaging of fresh and frozen courgettes." Journal of food engineering vol.16, no. 3, pp.165-172, 1992.
[11] Y. Geya, T. Kimura, H. Fujisaki, Y. Terada, K. Kose, T. Haishi, and Y. Sekozawa, “Longitudinal NMR parameter measurements of Japanese pear fruit during the growing process using a mo- bile magnetic resonance imaging system,” Journal of Magnetic Resonance, vol. 226, pp.45-51, 2013.
[12] R. R. Milczarek, M. E. Saltveit, T. C. Garvey, and M. J. McCarthy. "Assessment of tomato pericarp mechanical damage using mul- tivariate analysis of magnetic resonance images." Postharvest Bi- ology and Technology, vol. 52, no. 2, pp. 189-195, 2009.
[13] J. J Gonzalez, R. C Valle, S. Bobroff, W.V Biasi, E. J. Mitcham,
International Journal of Scientific & Engineering Research, Volume 4, Issue 7, July-2013 225
ISSN 2229-5518
and M. J. McCarthy, “Detection and monitoring of internal browning development in ‘Fuji’apples using MRI,” Postharvest biology and technology, vol. 22, no.2, pp. 179-188, 2001.
[14] N. Hernandez-Sanchez, B. P. Hills, N. Marigheto, “An NMR study on internal browing in pears” Postharvest Biol. Technol. Vol. 44, pp. 260-270, 2007.
[15] S. Arivazhagan, R. N. Shebiah, S. S. Nidhyanandhan, and L. Ga- nesan. "Fruit recognition using color and texture fea- tures." Journal of Emerging Trends in Computing and Information Sciences vol. 1, no. 2, pp. 90-94, 2010.
[16] Y. M. Yacob, A. R. A. M. Shaiful, Z. Husin, R. S. M. Farook, and A. Aziz, “Harum Manis Mango weevil infestation classification using backpropagation neural network.” In Electronic Design,
2008. (ICED 2008), International Conference on IEEE, pp. 1-6, De- cember, 2008.
[17] A.M. Aibinu, M.J.E. Salami , A.A. Shafie, N. Hazali and N. Ter- midzi “Automatic Fruits Identification system Using Hybrid Technique” IEEE International Symposium on Electronic Design, Test and Application, vol. 6, pp. 217-220, 2011.
[18] B.C. In, K. Inamoto, and M. Doi, “A neural network technique to develop a vase life prediction model of cut roses,” Postharvest Biology and Technology, vol. 52, no. 3, pp. 273-278, 2009.
[19] D. G. Nishimura, Principles of magnetic resonance imaging. Stan- ford University, pp. 33-102, 1996.
[20] R. H. Hashemi, W.G. Bradley, C. J. Lisanti, MRI The Basics. Lip- pinctt Williams and Wilkins Second edition, pp. 19-55, 2004.
[21] A. M. Aibinu, M. J. Salami, A. A. Shafie and A.R. Najeeb, “MRI reconstruction using Discrete Fourier transform: A tutorial” World Academy of science , Engineering and Technology, vol. 42, pp.
179-185, 2008.
[22] A. M. Aibinu, M. I. Iqbal, A. A. Shafie, M. J. E. Salami and M.
Nilsson “Vascular intersection detection in retina fundus images using a new hybrid approach”, Computers in Biology and Medi- cine, vol. 40, no.1, pp. 81-89, 2010.
[23] Aspect imaging, M2 Compact High performance MRI system opera- tor manual, Canada, revised January 6, 2012.
[24] R. Fisher, S. Perkins, A. Walker, E. Wolfart, “Intensity Histogram” http://homepages.inf.ed.ac.uk/rbf/HIPR2/histgram.htm, 2013.
[27] L. P. Bhaiya, and V. K. Verma, “Classification of MRI Brain Im- ages Using Neural Network”. network, vol. 2, no.5, pp. 751-756,
2012.
[28] R. Hecht-Nielsen, “Theory of the backpropagation neural net- work.,” International Joint Conference in Neural Networks, on IEEE (1989 IJCNN), pp. 593-605, June, 1989.
[29] L. Amirehsan. "A Neural Network based Method for Brain Ab- normality Detection in MR Images Using Gabor Wave- lets." International Journal of Computer Applications vol. 4, no. pp.
7 9-15, 2010.
[30] S. Kumar, Neural Networks : A classroom Approach. McGraw Hill, pp. 42-205, 2005.
[25] Z. P. Liang, and P. C. Lauterbur, “An efficient method for dy- namic magnetic resonance imaging”, Medical Imaging, Transac- tions on, 1 IEEE, vol. 3, no. 4, pp. 677-686, 1994.
[26] R. C. Gonzalez, R. E. Woods, and S. L. Eddins. Digital Image Pro- cessing. Prentice-Hall." Inc. Upper Saddle River, New Jersey 7458, pp. 46-665, 2002.
IJSER © 2013 http://www.ijser.org