International Journal of Scientific & Engineering Research, Volume 4, Issue 12, December-2013 730
ISSN 2229-5518
Instrumentation of Tissue Impedance
Measurement System and the Detection of
Cancer Tissue based on Capacitance Spectra of the Prostate
Naheed Hossain, Md. Taslim Reza, AdnanQuaium, Mohammad Rakibul Islam, Kazi Khairul Islam
Abstract— It is very important to identify the malignant tissue in the early stage to prevent cancer. Tissue impedance variation is a significant characteristic to identify the malignant tissue from suspected cancer tissue. We analyze the impedance of a set of practically measured malignant and benign tissue, collected from prostate of a number of patients. A simple tissue equivalent circuit is proposed and also found that for the applied supply frequency from 300 kHz to 500 kHz, a considerable deviation of tissue capacitance is found. We also discuss about the tissue impedance measurement system and the electronics setup used for this kind of measurement.
Index Terms— Impedance measurement, 4 lead system, 2 lead system, prostate cancer, impedance spectrum, tissue equivalent circuit, tissue capacitance.
—————————— ——————————
HE word "Cancer" means a group of diseases that are characterized by unrestrained cellular development. It
tissue impedance may be more sensible than conventional imaging techniques, such as computed tomography (CT) and
IJSER
It refers to cellular intrusion into neighboring tis-
sues and may turn into metastasise if not treated at early
stage. The most widely diagnosed malignancy in males is
prostate cancer. Peripheral zone of the gland is the place
where prostate cancers are generally found. It constitutes a
dense arrangement of cancerous epithelial cells commonly
in small form, penetrating glands with a symmetrical de- crease in stromal volume [2]. B. Lee et al. [3] used tissue bio- impedance to differentiate between the diseases because morphological differences between normal and malignant
prostate tissue are present and sensitivity of electrical im- pedance spectra to cellular structure was known. Bio- impedance is one of the properties referred to a tissue’s re- sistance when electrical current flows in the tissue. It also means the ability of tissue to store electrical charges. Bio- impedance normally depends on spacing of cells, cellular density and size, and the components of the extracellular ma- trix (ECM). Differences between the malignant and benign tissue impedance of can be a distinguishing criteria for pathological procedures for cancer detection [1]. Actually, it was shown by Skourou et al. [4] that when there is tumor, the
————————————————
• Md. Taslim Reza is currently doing is Ph.D. in the department of Electrical and Electronic Engineering (EEE) of Islamic Universit of Technology
(IUT), Bangladesh. He is also working work in the same department as an
Assistant Professor. E-mail: taslim@iut-dhaka.edu
• AdnanQuaium has completed his Master’s from Technical University of
• Dr.Kazi Khairul Islam is working as a Professor in the department of EEE
of IUT, Bangladesh. E-mail: kkislam@iut-dhaka.edu
ultrasound imaging. Normal and neo-plastic condition has
been differentiated by using electrical impedance of tissue
in analyses of cervical, breast, skin, and bladder tissues
[5][6][7][8]. It was shown in the Lee study [3] that the re-
sistance of malignant tissue was higher than normal tissue
but the capacitive differences between normal and malignant
tissues were not discussed.
In this paper we studied the nature of the prostate tumor
tissue impedance from a practically found data set. A tissue
equivalent circuit is also proposed by which capacitance of
the tissue can be calculated from that data set of various tu-
mor tissues for a band of applied frequency. Experimental
result suggests that for a range of frequency the normal
and malignant tissues have significant deviation of capaci-
tance to which helps to differentiate between them. We also
discuss about the use of different lead systems to measure
tissue impedance and suggest the effective one for that pur-
pose.
Bio-impedance measurement can be done by passing current through the tissue. This tissue impedance produces volt- age and that can be measured by proper instrumentation. Tissue impedance measurement device can be similar to a temperature measurement system (TMS). Sensor im- pedance, used in TMS, varies for the variation of temperature where the tissue impedance varies for the different charac- teristics of the tissues. A very simple configuration of im- pedance measurement system is shown in Fig. 1. There is a current source connected to the tissue and voltmeter con- nected to the current leads [9].
IJSER © 2013 http://www.ijser.org
International Journal of Scientific & Engineering Research, Volume 4, Issue 12, December-2013 731
ISSN 2229-5518
Fig. 1. 2 Lead impedance measurements
Fig. 2. 4 Lead impedance measurements
The current source (Is) has a shunt resistance Rs in paral- lel. It can be represented as an ideal current source. The voltmeter (Vin) is a digital multi-meter (DMM) with an input impedance (Rin). It can be modeled as an ideal voltmeter.
Generally the very common origin of error in a 2-lead im- pedance measurement is the lead wires resistance. These lead wires connect the current source to the impedance source.2-lead measurement system has an effect of lead resistance also. 4-lead impedance measurement (Fig. 2) can be used to eliminate the effects of lead resistance. Between these four leads, two of them are from positive and nega- tive voltage supply source. These two leads are used to measure the impedance voltage leads and to eliminate the effect of lead resistance. For this kind of voltage measure-
ment the voltmeter needs very small current (in range of
The impedances of normal and malignant tissues, for differ ent supply frequencies, are taken from a well mentioned practical experiment. Table 1.1 shows the tissue impedance values both for normal and malignant tissues. Five ex vivo prostates were taken and impedance spectra were measured in the operating room immediately following radical prosta- tectomy.
It is observed that, there are overlaps in the impedance ranges for malignant and normal tissue considerably be- tween patients. It makes difficult for the selection of a suita- ble impedance threshold to differentia normal and malig-
nant tissue. This overlap creates from inter patient variability
IJSER
pico-amperes or less) so that the voltage drops in the voltage leads are extremely small. The resistive drop in the current leads is not measured in this scheme. It means that the volt- age drop in RIL/2 is out of voltmeter measurement. That is why the measurement scheme works fine. Other two leads are connected to positive and negative port of the current source.
The effectiveness of a tissue impedance measuring system, particularly at low frequencies, is evaluated mostly by the electrode-tissue, or electrode-electrolyte, interface impedance [10]. Unexpected impedance can be taken as the source of noise signal. Matching and reduction of electrode-tissue im- pedance solve the unexpected impedance problem to some extent. One of the effective ways to reduce the electrode-tissue impedance is to increase the conductance of the electrode- tissue interface. Conductance increased by enlarging the elec- trode surface because the interface conductance is directly related to the surface area of electrode. We can expand the electrode surface area or the surface roughness. Each of these techniques will reduce interface impedance at low frequencies [11].
At frequencies below 100Hz, the electrode-electrolyte inter- face impedance involves vital tissue impedance measurement
in the impedance of tissues. It happens mostly due to
instinctive variability between patients and inconsistency
within different locations of the prostate.
Study shows that, the region for impedance measurement
within the prostate for all patients are not same. In the exper-
iment, tissue impedance measurements were taken on the
contra lateral lobe of the prostate and the position of the tu-
mor for each patient were symmetric. There is much smaller
variation in the measurements of malignant and normal tis-
sue and each of these were confirmed by histology of the acquired data. A simple equivalent circuit has a resistance and a capacitance in parallel, mentioned in Fig. 3. We pro- pose this simple model for better understanding of the tissue
impedance change with respect to variation of supply fre- quencies. Here R is taken as 10 kΩ/m.
Based on the experimental results, we propose that
equivalent circuit. This equivalent circuit may differ for dif-
ferent structure of tissue. From the equivalent circuit Ztissue
can be derived as:
Z = Xc*R ∕ (Xc +R) (1) Tissue reactance, XC = 1/2πf , where f is the supply frequen-
cy. From (1) we can derive the equivalent capacitance,
C as:
errors. The capacitive coupling of the wires is strongly visible at frequencies beyond 100 kHz [11]. That is why the frequen-
C = ((1∕Ztissue) − (1∕R))*1∕2πf
(2)
cy band might be limited between 100 Hz to 100 kHz but not obvious.
Ztissue is taken from the experiment [1] and capacitance is cal- culated by (2) for different supply frequencies and also plot- ted by using MATLAB software.
IJSER © 2013 http://www.ijser.org
International Journal of Scientific & Engineering Research, Volume 4, Issue 12, December-2013 732
ISSN 2229-5518
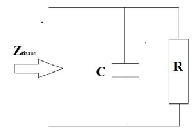
Fig. 3. Simple tissue equivalent circuit
We plot the capacitance of normal and malignant tissue by using (1), which is shown in fig. 4. Here, we use the minimum value of impedance from table 1.1 and supply frequencies from 10 kHz to 1 MHz. In fig. 4, we observe that the capaci- tance spectra of normal and malignant tissue give significant variation for a band of supply frequency. Capacitance for
Fig. 4. Capacitance spectra of normal and malignant tissue
To eliminate the effects of lead resistance error, 4-lead meas- urement can be used. As a result, better measurement accura- cy is possible. This system is used for highest accuracy of rap- idly changing input. Very minor impedance changes can also be calculated by this system. Since capacitance of the nor- mal and malignant tissue is nearly constant between the
IJSER
both normal and malignant tissue seems almost constant
from the frequency 300 kHz to above, in case of the proposed
tissue equivalent circuit. It shows that our proposed simple
equivalent circuit will work for the supply frequency more than 300 kHz. However, there is a clear deviation of the ca- pacitance spectra between normal and malignant tissue for the frequency band of 300 kHz to 500 kHz, which is shown
in
Fig. 5. This significant deviation of capacitance will help to
distinguish malignant tissue from normal tissue.
TABLE 1
CHANGE OF IMPEDANCE WITH RESPECT TO
FREQUENCY
ranges of 300 kHz to 500 kHz with a significant difference
between each other, it is better to record the tissue impedance
within that range to identify the malignant tissue.
We would like to thank Prof. Dr. Md. Sahid Ullah and Prof. Dr. Md. Ashraful Hoque for their support during the work.
Fig. 5. Variation of capacitance of normal and malignant tis- sue starting from 300 kHz to 500 kHz
IJSER © 2013 http://www.ijser.org
International Journal of Scientific & Engineering Research, Volume 4, Issue 12, December-2013 733
ISSN 2229-5518
[1] R. J. Halter, A. Hartov, J. A. Heaney, K. D. Paulsen and A. R. Schned “Electrical Impedance Spectroscopy of the Human Prostate” IEEE Trans. Biomed. Eng., vol. 54, no. 7, pp.2097–2102, July 2007.
[2] M. Ernstoff, J. Heaney and R. Pechek, Prostate Cancer Blackwell
Science Oxford, U.K., 1998.
[3] B. Lee et al., “Bioimpedance: Novel use of a minimally invasive technique for cancer localization in the intact prostate”, Prostate, vol.
39,pp.213–218, 1999.
[4] C. Skourou et al., “Feasibility studies of electrical impedance
spectroscopy for early tumor detection in rats,” Physiological Meas., vol.25, pp.335–346, 2004.
[5] B. Brown et al., “Relation between tissue structure and imposed electrical current flowin cervical neoplasia,” Lancet, vol. 355, pp.892–
895, 2000.
[6] J. Jossinet, “Variability of impedivity in normal and pathological breast
tissue,” Med. Biol. Eng. Comput., vol. 34, pp.346–350, 1996.
[7] P. Aberg et al., “Skin cancer identification using multifrequency
electrical impedance – A potential screening tool,” IEEE Trans. Biomed. Eng., vol. 51, no. 12, pp.2097–2102, Dec. 2004.
[8] B. Wilkinson et al., “Electrical impedance spectroscopy and the
diagnosis of bladder pathology: A pilot study,” J. Urol., vol. 168, pp.1563–1567, 2002.
[9] “Temperature Measurement System”,[www.lakeshore.com], Appendix-
E, pp.188-190, Aug. 2013.
[10] A. Benvenuto,L. Beccai, F.Valvo, A. Menciassi,PDario, “Impedance
Microprobes for myocardial Ischemia Monitoring”, Proceedings of the
1st Annual International IEEE EMBS Special Topic Conference
on Micro-technologies in Medicine and Biology, Lyon, France,
pp.234-238, 2000.
[11] A. Yufera et al., “An integrated circuit for tissue impedance measure,”
Micro-technologies in Medicine & Biology 2nd Annual In- ternational IEEE-EMB Special Topic Conference, pp.88 – 93, 2010.
[12] C. Gabriel, S. Gabriel, and E. Corthout, “The dielectric properties ofbio- logical tissues: I. Literature survey,” Phys. Med. Biol., vol. 41, pp.2231–
2249, 1996.
IJSER © 2013 http://www.ijser.org