International Journal of Scientific & Engineering Research, Volume 4, Issue 1Ř, ember-2013
ISSN 2229-5518
2147
Innovation in information systems management for educational institutes
Ankur Balar, Nikita Malviya, Swadesh Prasad, Ajinkya Gangurde
Abstract— The current educational systems are based upon an assessment pattern where students are evaluated on the basis of only a single final exam every semester. In such cases, it is difficult for the students and the faculty to assess them before the exam for taking appropriate course of action to get better results. The attendance pattern can never be linked with a student’s academic performance. As for the educational institute, mostly, some electives are on high demand while some are not. While allocating seats for these electives, the institute should provide proper seats for each elective as per the demand and past trends. Also, each student cannot be treated as the same, because each student has unique likes, dislikes and capabilities. Therefore there should be a way to categorize students as per their performance and then introduce measures to improve their results. By analyzing data patterns we can determine solutions to tackle such problems. The significant decisions are mostly made based not on the information-rich data stored in databases, but rather on a decision maker’s intuition. The proposed solution in the paper discusses a tool to analyze huge educational data using data mining concepts. The proposed solution aims to enhance the exam performance of students and better the allocation of modules which can prove to be beneficial and subsequently prevent unnecessary calculations that are otherwise required to be done manually.
Index Terms— Innovation, education domain, information systems management, data patterns, data mining, Data Analytics.
—————————— u ——————————
ATA mining is mainly used for commercial applications. In this study, we have explicitly applied these concepts
in the education enviroInmentJ. As such, theSre has been no ER
system that is readily available for application in our educa-
tional environment that specifically deals with autonomous institutes. What is required here is the convenient extractions
of patterns representing the general information stored in large databases and achieve goals. Rather, the current proce- dures lack effective and efficient analysis of data. Data is only collected in huge repositories which as seldom visited while making important decisions. Thus the process of decision making is manual and tedious.
So the proposed system implements data mining concepts and improve the feasibility by handling various risk factors as mentioned earlier.
We now focus our focus on the project stakeholders’ aims for the planned system; the current automated or manual proce- dures being used and the issues and assumptions that were required for pursuing the study.
The stakeholder in any project is a person, group or institute that has direct or indirect stake in an institute because it can affect or be affected by the institute's actions, objectives, and policies. In our case, students, faculty and management are the stake holders.
There are some systems available in the domain of educational data mining. But our system will analyze the data giving in- formation about results, attendance of student and it will be displayed at the output in terms of graphical tools. This sys- tem will be performing all these operations with respect to an autonomous institute.
This system will consider grading system as of followed in autonomous institutes. While serving other issues, like alloca- tion of seats in optional subject, our system will consider sub- jects like GP, PD and elective. Our system will also classify the students based on marking criteria. This relation is displayed with the help of graphical tools like ISHIKAWA tool
To tackle such problems, we need large amount of data to find
out patterns. By analyzing those patterns we can determine
solutions. But this data is generally huge, rapid growing and
scattered. The availability of data, but lack of analysis tools
gives rise to data rich but information poor situation. The im- portant decisions are often made based not on the infor-
mation-rich data stored in data repositories, but rather on a decision maker’s intuition. The apt tool to use in such a case is
‘an analysis tool using data mining’. Data mining refers to extracting knowledge and uncovering important data patterns from large amount of data, contributing greatly to building strategies.
The functionalities of data mining are prediction, association, clustering, classification and outlier analysis.
Thus, it would prove beneficial to apply the data mining con- cepts on the existing educational data and detect patterns which can prove helpful to deal with various academic issues in the following way:
By studying the current trends in exam performance of the student in a specific module for that semester and mapping the trend with previous patterns of the same student or with another student with similar pattern, the performance of the student can be predicted and proper measures to enhance the score can be taken well in time. This technique can be highly useful for the faculty of that subject to find out critical stu- dents and thus take action to improve overall class perfor- mance. In order to achieve this goal, we can apply the predic- tion functionality of data mining. By this, patterns are formu- lated by analyzing the available information. Pattern matching is then used for prediction.
IJSER © 2013 http://www.ijser.org
International Journal of Scientific & Engineering Research Volume 4, Issue 1Řǰȱ ȬŘŖŗř
ISSN 2229-5518
2148
While allocating seats for electives, if the trend amongst stu- dents is to opt for a particular elective , then those many extra seats can be allotted to that elective, depending upon the matching trends of the previous year or so. Association is the functionality used in such a case.
Depending upon total strength, which might be different from expected, appropriate classrooms, labs, faculty members and lecture timings can be adjusted. Also, if very few students opt for a particular course, and then decision can be taken about modifying the structure of that course in future. Clustering is the functionality used in such a case.
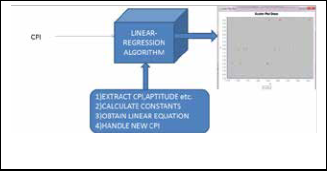
Fig. 3. Scenario for applying Linear-Regression Algorithm.
The teachers can be able to plot the students according to per- formance and other activities. Depending upon the need of each category, decisions may be made about conducting spe- cial lectures to enhance class performance. This can be done using the classification functionality. In addition, the outlier analysis would be helpful in detecting critical as well as extra ordinary students and initiate further guidelines.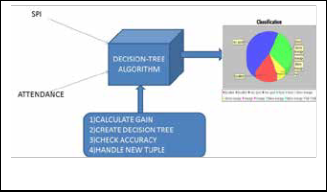
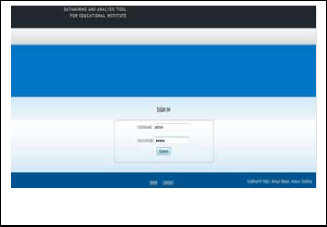
Fig 4. Graphical User Interface of the software.
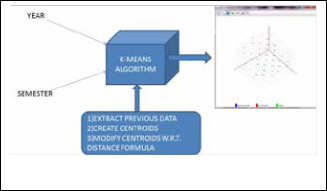
Fig. 1. Scenario for applying Decision-tree Algorithm.
Fig. 2. Scenario for applying K-means Algorithm.
As we are using Graphical tool for visualization, acquiring the required information from graph is easier than traditional way of conveying information. The proposed system is feasible and can be implemented and executed successfully.
Thus, the aim to enhance the student’s community in order to maximize the performance is met by this data analysis tool. The tool could be of significant importance in consistent growth of students in a particular grade in a specific institute owing to its characteristics
[1] Dongmei Zhang, “Software analytics in practice and its implications for education and training”, Software Engineering Education and Training (CSEE&T), 2012 IEEE 25th Conference.
[2] Gupta, Ankur, “Performance Insight 360: A Cloud-Based Quality Management Framework for Educational Institutions in India”, Business Informatics (CBI), 2013 IEEE 15th Conference, pp 139 – 144.
[3] Anastasios, T., Sgouropoulou, C. ; Xydas, I. ; Terraz, O. ; Miaoulis, G.,
“Academic Research Policy-Making and Evaluation Using Graph Visualisation”, Informatics (PCI), 2011 15th Panhellenic Conference, pp 28 – 32.
[4] Madhavan, K.P.C. , Vorvoreanu, M. ; Elmqvist, N. ; Johri, A. ; Rama- krishnan, N. ; Wang, G.A. ; McKenna, A., “Portfolio Mining”, Com- puter (Volume:45 , Issue: 10 ), pp 95 – 99.
[5] Agudo-Peregrina, A.F, Hernandez-Garcia, A. ; Iglesias-Pradas, S.,
“Predicting academic performance with learning analytics in virtual
IJSER © 2013 http://www.ijser.org
International Journal of Scientific & Engineering Research Volume 4, Issue 12, December-2013
ISSN 2229-5518
learning environments: A comparative study of three interaction classifications", Computers in Education (SIIE), 2012 International Symposium, pp 1- 6_
IJSER © 2013
2149