International Journal of Scientific & Engineering Research Volume 2, Issue 9, September-2011 1
ISSN 2229-5518
Improving Waiting Line Characteristics in Sales Points Using Computer Simulation: A Case Study
Said Ali Hassan El-Quliti
Professor, Industrial Engineering Department, King Abdulaziz University, Jeddah, Saudi Arabia
Abstract— This paper focuses on predicting and economically scheduling the number of sales executives in sales points for Mobily Company for increasing customer satisfaction. The main goal is to determine the suitable number of workstations in order to decrease customers waiting time while considering the cost as a vital factor. An Arena simulation model is built; the best scenario attained a net profit of SR 1,509,506 with an average total system time of 453 seconds with a decrease of 72% compared with the current situation. Number of unsatisfied customers was decreased by 77%, number of satisfied customers increased by 374%, and net profit increased by 6.2% despite increasing the number of employees.
Index Terms— Waiting lines, Mobily Company, Sales points, Modeling and Simulation, Customer satisfaction.
1 INTRODUCTION
—————————— ——————————
Customer satisfaction is a top priority for all service
HE major concern of Mobily Company sales points is to reach higher customer satisfaction by decreasing total time in system for the customer.
companies. Customers who arrive to find all servers
busy generally join one or more queues (or lines) in front of the servers.
1.1 Importance of the Study
The impact of social identity on consumer satisfaction was investigated by Al Otaibi [1]. It revealed that customers' relationship is a topic that has attracted much attention in the service literature. This growing attention was based on the assumption that building committed customer relationships could result in customer satisfaction, patronage and loyalty.
Customer satisfaction is seen as a key differentiator between companies and has increasingly become a key element of business strategy. Organizations are increasingly interested in retaining existing customers while targeting non-customers. Measuring customer satisfaction provides an indication of how successful the organization is at providing products and/or services in the marketplace.
In Mobily Company, the study and analysis of the sales points is very important to determine the state of customer satisfaction. Loosing a single customer is considered a disaster. If a customer waits for a long time in the queue to be served, there is a possibility that he/she quits or leaves and that will build bad experience in his/her mind and this might lead to a higher probability of loosing others customers. Glanz [2] studied the impact of satisfied and dissatisfied customers on sales experiences, he reveals the following facts:
- Satisfied customers will tell an average of 5 persons about the experiences.
- Dissatisfied customers will tell about 9 persons.
- Dissatisfying experience will be remembered 10
times, while a satisfactory experience will be
considered as (normal)!
- 13% of the unsatisfied customers will share their
unhappy experience with at least 20 persons!
- 10% of unsatisfied people never complain; they just switch to a competitor.
1.2 Objectives of the Study
The specific objectives of this study are to: Minimize waiting time in the queue. Minimize total time in the system.
Minimize the number of unsatisfied customers. Identify the required numbers of resources and their time schedules.
The first section in this paper is the introduction, importance of the study, its scope, and objectives. The second section contains literature review of related previous studies. Section 3 presents telecommunications worldwide comprising historical background, and an overview of the mobile phone, its culture, customs, and applications. Section 4 deals with telecommunications in the Kingdom of Saudi Arabia containing historical background and indicators of information and communication
IJSER © 2011 http://www.ijser.org
International Journal of Scientific & Engineering Research Volume 2, Issue 9, September-2011 2
ISSN 2229-5518
technology. Section 5 deals with Mobily Company, describing its services and its sales point's process. Section 6 constitutes data collection and analysis, while section 7 describes the fundamentals of Arena software and details of the simulation model. Results of the simulation model for the base case and for different scenarios are presented in section 8. The last section includes conclusions and recommendations for future research.
2 LITERATURE REVIEW
Al-Nasser [3] indicated a significant difference between Europeans and Saudi Arabians’ satisfaction with service attributes. Overall, this study was a first step towards a better understanding of the impact of social relations on the evaluation of service outcomes. This research concentrated mainly on customer’s satisfaction, which is considered to be a major and occasionally serious problem in the area of marketing. There is no doubt that many companies have lost their competitive advantage because they neglected to meet the specific needs or requirements of the customer. Customer satisfaction is an essential factor in improving competitive advantage. In this research, the author measured five factors: Quality requirement, Service Performance, Relationship, Price, and Invoice. These were measured from the customer’s point of view, and as to whether or not the customer was satisfied, and to what specific areas their strength and weaknesses lied. This case study was applied on SABIC (Saudi Basic Industrial Corporation) company which is a well known global petro-chemical company operating world-wide.
The analysis of performance of SABIC indicated
that the company's performance was exceptionally excellent in quality services and relationship aspects. However, there were a number of areas where the company was giving less attention than others. These areas were: product packaging, processing complaints and technical support, stabilizing prices, application of EDI and the flexibility of the invoice schedule, long-term business relation with customers, and revision of price structure.
Another research done by Omer [4] examined the
relationship between time orientation and time allocation. In the absence of a widely used measure of time orientation, a questionnaire was first developed to assess the main aspects of time orientation. Time allocation was measured using a 24 hour time diary over one week. Because time allocation could be affected by a number of exogenous and endogenous variables , a narrow sampling method was adopted where age, gender, employment and education were controlled. Apart from time orientation itself,
culture was chosen as an exogenous variable to affect both time orientation as well as time allocation. Culture was included in the research design by taking a sample of individuals from two nationalities, Saudi and British living in two different countries, Saudi Arabia and Great Britain.
3 TELECOMMUNICATIONS IN SAUDI ARABIA
The United Nations Agency for Information and Communication Technologies (ITU) declared in its website [5] that most mobile phones were too large to be carried in a jacket pocket until the early 1990s, so they were typically installed in vehicles as car phones. With the miniaturization of digital components, mobile phones have become increasingly portable over the years. Today, video and TV services are driving forward third generation (3G) deployment. And in the future, low cost, high-speed data will drive forward the fourth generation (4G) as short- range communication emerges. Informa [6] indicates that consumer applications are on the rise and include everything; even tools for creating websites for mobile phones are increasingly becoming available. The total value of mobile data services exceeds the value of paid services on the internet, and was worth
45 billion dollars in 2009.
Communication and Information technology
Commission (CITC) [7] insists that all responsible people in the Kingdom gave all their support and special attention to this sector and its services. ALJAWAL company was launched in 1996 and considered one of the largest GSM networks in the Arab world; it covered most of the urban areas including all highways and most of country roads within the Kingdom. In 1998, Saudi Telecom was established and delivered a range of positive results that have delivered a better service to more customers. This has been achieved through an ambitious Transformation and Restructuring Program compound with an extensive expansion of the network and infrastructure. Also in 1998, the government contracted for the installation of 575,000 additional Group Special Mobile (GSM) cellular telephone lines over 15 months to raise the total number of subscribers to more than one million; Riyadh –the capital of the country- planned to further expand the GSM system in 1999 by adding an additional one million lines. In 2004, Mobily was the second telecommunication company to be introduced to the Saudi market. Its customers reached more than
6 million by 2006 covering 19 cities.
Saudi Telecom [8] indicated that fixed telephone lines approached 4.5 millions at the end of 2009, 75% of which were residential lines (3 millions). This
IJSER © 2011 http://www.ijser.org
International Journal of Scientific & Engineering Research Volume 2, Issue 9, September-2011 3
ISSN 2229-5518
represents a population teledensity of 16.5% and a household teledensity (percentage of households with a telephone) of around 70% or 70 residential phones for every 100 households.
In the mobile market, the number of subscribers
increase from 9.2 million in 2004 (40% penetration) to around 14.6 million (over 81% penetration) in 2006, and also as compared to only 2.5 million subscribers (12% penetration). The cumulative average growth rate (CAGR) during the last five years around 51% annually. Telecom service revenues have been steadily growing at a cumulative average rate of around 15% annually, increasing from SR20 billion in
2001 to around 52 billion in 2009. Mobile revenue represented around 75% of all sector revenue (which is in line with trends in other countries). Hassan et al. [9] shows that there is a huge growth in fixed telephone lines, mobile subscribers, internet user’s, and overall Telecommunication Service Revenues during years 2001-2009 in the Kingdom of Saudi Arabia.
4 MOBILY TELECOMMUNICATION COMPANY
Mobily launched its services on the 25th of May 2005 and in less than a year since its launch, Mobily's customers have reached 3.8 millions and more than 6 millions by 2006, beating the record in the Middle East and North Africa. Today, Mobily network is in all cities and major towns. This is in addition to more than 22,000 kilometers of highways so far, covered by Mobily independent coverage. Mobily has also launched 3.5G services on the 27th of June 2006, covering 19 cities in the Kingdom. By the end of 2006, Mobily had more than 500,000 active subscribers in the 3G and 3.5G, being described as the biggest 3G mobile operator in the Middle East.
Mobily Company [10] declared that it currently
provides many services such as missed call
notification, voice mail, conference call, call forwarding, call waiting, call hold, call baring, video call, streaming, 3G, SMS, MMS, Friend finder, My location, SMS to TV, Bulk SMS, Saudi Stocks Quotes, WAP (Wireless Application Protocol), Internet, Roaming abroad, Prepaid, Postpaid on demand bill inquiry, Credit Transfer Service, Please call me, Ring back tone, Push To Talk-PTT-, Mobile number portability.
5 COLLECTED DATA
Data were collected from one sales point in western region in Jeddah (Palestine branch) for 2010. All data were taken from the Qmatic system (automated ticket taken machine), monthly (from January to
September): The max, average and min customers flow for each hour from 8:30 AM to 11:30 PM.
Table 1 shows number of tickets taken, number of customers served, and number of customers who were not served (No Show), number of payment customers served, and number of no show customers, number of update customers served, and number of no show customers.
Table 2 shows the arrival data details from January
to September from 8:30 A.M. to 11:30 P.M. from
January to September, respectively. The company has two shifts, the first is from 8:30 AM until 3:30 PM and the second is from 4:15 PM until 11:30 PM.
TABLE 1
COLLECTED DATA
Month | Tickets Taken | Customers Served | No Show | Payment Customer Served | No Show | Update Customer Served | No Show |
Jan | 18865 | 18683 | 180 | 340 | 11 | 287 | 19 |
Feb | 19016 | 18710 | 317 | 3209 | 24 | 4346 | 223 |
Mar | 18990 | 1893 | 95 | 2063 | 17 | 467 | 18 |
Apr | 19530 | 19405 | 117 | 1974 | 18 | 112 | 9 |
May | 19145 | 19044 | 97 | 2287 | 9 | 59 | 15 |
Jun | 17455 | 17371 | 69 | 4109 | 19 | 112 | 17 |
Jul | 17278 | 17157 | 81 | 3726 | 15 | 110 | 19 |
Aug | 11976 | 11896 | 87 | 2741 | 17 | 74 | 9 |
Sep | 9014 | 8940 | 51 | 2011 | 14 | 63 | 17 |
6 THE SIMULATION MODEL
6.1 Computer Simulation
Law and Kelton [11] define simulation from a practical viewpoint as the process of designing and creating computerized model of a real or proposed system for the purpose of conducting numerical experiment to give us a better understanding of the behavior of that system for a given set of condition. The real power of this technique is fully realized when used to study complex systems. While simulation may not be the only tool that could be used to study the model, it is frequently the method of choice. The reason is that simulation can be allowed to become quite complex if needed to represent the system faithfully, while we can still do the simulation analysis. Kelton et al. [12] states that other methods may require stronger simplifying assumptions about the system to enable an analysis to bring the validity of the model.
IJSER © 2011 http://www.ijser.org
International Journal of Scientific & Engineering Research Volume 2, Issue 9, September-2011 4
ISSN 2229-5518
TABLE 2
ARRIVALS DATA
TIME | Jan | Feb | Mar | Apr | May | Jun | Jul | Aug | Sep |
08:30-09:30 AM | 53 | 53 | 58 | 58 | 49 | 60 | 53 | 52 | 42 |
09:30-10:30 AM | 56 | 56 | 56 | 60 | 54 | 59 | 55 | 51 | 53 |
10:30-11:30 AM | 45 | 45 | 63 | 59 | 56 | 54 | 48 | 50 | 47 |
11:30-12:30 PM | 39 | 39 | 42 | 35 | 37 | 46 | 51 | 40 | 33 |
12:30-01:30 PM | 16 | 16 | 14 | 24 | 20 | 18 | 14 | 23 | 19 |
01:30-02:30 PM | 46 | 46 | 39 | 43 | 41 | 37 | 47 | 37 | 33 |
02:30-03:30 PM | 29 | 29 | 36 | 23 | 19 | 25 | 31 | 29 | 19 |
03:30-04:30 PM | 41 | 41 | 37 | 38 | 40 | 34 | 35 | 42 | 31 |
04:30-05:30 PM | 63 | 63 | 64 | 58 | 55 | 58 | 68 | 61 | 59 |
05:30-06:30 PM | 59 | 59 | 57 | 56 | 54 | 62 | 51 | 62 | 53 |
06:30-07:30 PM | 71 | 71 | 66 | 77 | 71 | 65 | 69 | 70 | 58 |
07:30-08:30 PM | 57 | 57 | 55 | 51 | 49 | 52 | 52 | 56 | 47 |
08:30-09:30 PM | 39 | 39 | 47 | 43 | 40 | 34 | 47 | 43 | 30 |
09:30-10:30 PM | 60 | 60 | 64 | 72 | 69 | 56 | 68 | 64 | 61 |
10:30-11:30 PM | 56 | 56 | 63 | 59 | 64 | 59 | 57 | 58 | 49 |
Arena –a simulation language- software combines the ease of use found in high-level simulators with the flexibility of simulation languages and even on the way down to general-purpose procedural languages like the Visual Basic programming system or C.
Rossetti [13] explained the ease of display and
organization of Arena stating that modules are typically grouped into panels to compose a template. By switching panels, one gains access to a whole different set of simulation modeling constructs and capabilities. To build models with Arena, one can use modeling shapes, called modules from the Basic Process panel (and perhaps other model - building panels) to define a process.
Simulation models are built using modules to define system logic and physical components such as machines and operators. In addition to standard features such as resources, queues, process logic and system data, the Arena template includes modules focused on specific aspects of manufacturing and material handling systems.
6.2 System Overview
A number of visits and personal contacts with respective people in the Company are conducted during the period of study to understand the system under study. Once the customer visits the sales point, he has to take a ticket from the Qmatic (automated ticket taken machine) then move to get full information about products, services and promotions. Then he goes to the waiting area till his ticket number is shown on the display. The customer then is served
in the workstation by a sales executive who thanks the customer and bids him farewell. Eventually, the customer leaves the sales point.
When a customer arrives to Mobily Company he
finds three service types which are customer,
payment machine and update information services. Branch 1: Customer service. Includes many services for customers such as new SIM, canceling SIM, bill objection, changing number, add new services like Mobily Connect, I-Phone, Blackberry and Broadband. If a customer needs any service from customer service, he can take a ticket from Qmatic machine. Then, the customer waits until his number is appears. After that, he will go to the customer service employee. After completing his needs he leaves the branch.
Branch 2: Payment machine service. To save time
and effort for both customers and employees, Mobily
provides a Qmatic machine to help customers pay their bills. If a customer wants to pay his bill he can go directly to the payment machine without waiting and take his ticket from the machine.
Branch 3: Update information service. This action is
carried out by the company to 1) Keep the privacy of participants and to protect them, 2) Prevent misuse of their names by others, and 3) Avoid a number of complaints that cause continuous disturbance.
Figure 1 represents the system flow chart which clarifies the system and can be used in any simulation language.
6.3 Model Building
Customers who entered the system were distributed as follows: 84.2% entered the system for services, 12.5% entered to payment machine, and the rest went for update services.
The process time of tickets taken from the Qmatic machine gave the distribution: 1.5 + 14* BETA (1.18,
1.19). Customers were distributed as: 99.3% entered
the system to take services and 0.7% left without any services as no-show customers. As for customer service process, the average service time was found to be: TRIA (250, 305, 540).
The distribution for the customer service time is:
TRIA (250, 305, 540). Customers were distributed as follows: 99.5% entered into payment machine services while 0.5% of customers left without any services as no-show customers. From input analyzer, it was found that the average service time for payment machines was 183 + 226 * BETA (0.69, 0.761).
IJSER © 2011 http://www.ijser.org
International Journal of Scientific & Engineering Research Volume 2, Issue 9, September-2011 5
ISSN 2229-5518
Customers were distributed as follows: 94.5% entered for update information services and 5.5% left without any services as (no-show) customers. It was found that the average update information service time was 306 + 286 * BETA (0.767, 0.617).
6.4 Model Animation
Figure 5(a) shows layout of the branch which contains customer service offices, update service offices, payment machine and Qmatic machine. The figure also shows queue for each service type, and resources working first shift (8:30 AM – 3:30 PM). Figure 5(b) shows resources working second shift (3:30 PM – 11:30 PM).
7 SIMULATION RESULTS
7.1 Base Case Results
The obtained simulation results show the Base case result (5 sales executives in the AM shift and 6 in the PM shift). The results are the number of customers that enter the system, the number that leaves the system, the number of customers that wait more than
10 min, number of customers that wait less than 10
min, number of customers service no show, number
of customer service served, number of payment machine no show, number of payment machine served, number of update service no show, and number of update service served. The results also indicate the branch profit per month, unsatisfied cost, salaries for additional employees, money saved from increasing of sales executives, and the net profit.
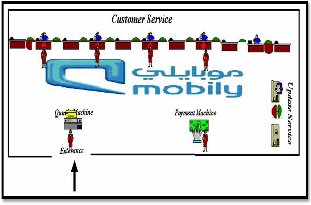
Fig. 5(a). Animation for First shift
7.2 Different Scenarios
The scenarios were divided into two types which are:
Type one: Dependent on employee training course which could help reduce customer
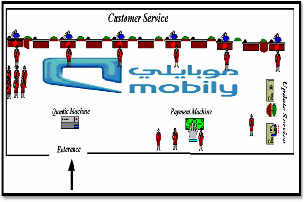
Fig. 5 (b). Second shift
Type one: Dependent on employee training course which could help reduce customer service time leading to a decrease in number of unsatisfied customers in the system. From scenario 1 to scenario 4 an unsatisfied customer means a customer waiting more than 10 minutes in customers' service queue.
Type two: Dependent on an additional
number of sales executives per shift in order to reach optimal customer satisfaction from scenario 5 to scenario 9.
These scenarios are shown in table 3.
TABLE 3
THE DIFFERENT SCENARIOS.
Scenarios | Service Time Reduced (Sec) | AM Shift | PM Shift |
Base Case | 0 | 0 | 0 |
Scenario 1 | -15 | 0 | 0 |
Scenario 2 | -30 | 0 | 0 |
Scenario 3 | -45 | 0 | 0 |
Scenario 4 | -60 | 0 | 0 |
Scenario 5 | 0 | 1+ | 1+ |
Scenario 6 | 0 | 2+ | 2+ |
Scenario 7 | 0 | 3+ | 3+ |
Scenario 8 | 0 | 4+ | 4+ |
Scenario 9 | 0 | 5+ | 5+ |
For each scenario, results were obtained for the number of customers who waited more than 10 min, number of customers that waited less than 10 min, number of customers service no show, number of customer service served, number of payment machine
IJSER © 2011 http://www.ijser.org
International Journal of Scientific & Engineering Research Volume 2, Issue 9, September-2011 6
ISSN 2229-5518
no show, number of payment machine served, number of update information service no show and number of update information service served, total number seized, and the utilization of each resource.
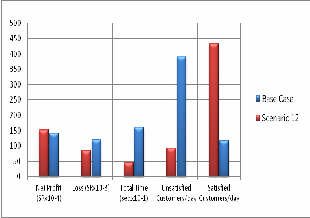
Figure 6 shows total time in the system, number of
customer waiting more than 10 minutes, and the net profit for all scenarios.
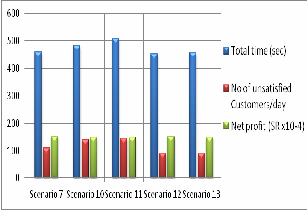
The best scenario which gave maximum profit and reasonable number of unsatisfied customers was scenario7. Other scenarios were formulated by incensing and decreasing sales executives by one employee in each shift (Scenarios 10, 11, 12, and 13) as shown in Table 4.
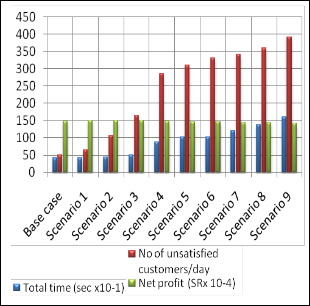
Fig. 7. Comparison between different scenarios.
7.3 Comparing the Base Case and the Best
Scenario
Results of Comparing base case (5 employees at AM shift and 6 employees at PM shift) and best scenario (8 employees at AM shift and 10 employees at PM shift) are shown in table 5 and figure 8. Figure 9 shows percentage improvements for the main key performance indicators (KPI's): total time in system, number of unsatisfied customers, number of satisfied customers, losses due to leaving customers, and net profit.
8 CONCLUSIONS AND POINTS FOR FUTURE
RESEARCH
Fig. 6. Comparison between different scenarios
TABLE 4
NEW SCENARIOS.
Scenarios | AM Shift | PM Shift |
Scenario 10 Scenario 11 Scenario 12 Scenario 13 | 2+ | 3+ |
Scenario 10 Scenario 11 Scenario 12 Scenario 13 | 3+ | 2+ |
Scenario 10 Scenario 11 Scenario 12 Scenario 13 | 3+ | 4+ |
Scenario 10 Scenario 11 Scenario 12 Scenario 13 | 4+ | 3+ |
Figure 7 shows average waiting time in the customer service queue, number of customers waiting more than 10 minutes, and the net profit for all scenarios applied.
8.1 Conclusions
1- Input arrivals were analyzed using the input analyzer in Arena software to obtain process distributions. Analysis results were:
Customer Service time was TRIA (250, 305,
540).
Payment Machine Service time was 183 + 226 *
BETA (0.69, 0.761).
Update Information Service time was 306 + 286
* BETA (0.767, 0.617).
2- A simulation model was constructed consisting of
the following sub-models: customer arrivals,
customer service, payment machine, and update information service.
3- Thirteen different scenarios were considered by
decreasing service time due to training, and by adding additional employees.
4- The best scenario attained a net profit of
SR1,509,506 with total system time 453 seconds.
IJSER © 2011 http://www.ijser.org
International Journal of Scientific & Engineering Research Volume 2, Issue 9, September-2011 7
ISSN 2229-5518
5- Comparing the best scenario with the base case, the following improvements were achieved:
* Total system time was decreased by 72%,
* Number of unsatisfied customers was decreased
by 77%,
* Number of satisfied customers was increased by
374%, and
* Net profit was increased by 6.2% despite increasing the number of employees.
TABLE 5
COMPARISON OF BASE CASE AND BEST SCENARIO
Fig. 8. Comparison between base case and scenario 12
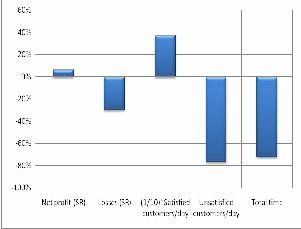
Fig. 9. Percentage improvements in KPI's
8.2 Points for Future Research
1. Make necessary coordination of the work schedule and increase the number of staff members at peak times.
2. Recommend a perfect way to serve VIP customers
without affecting workflow.
3. Apply the same procedure for other branches in
Mobily Company.
4. Prepare a user-friendly decision support system to help executives use such complicated interface for decision making.
REFERENCES
[1] Al Otaibi, E., ―An Investigation of the Impact of Social Identity on Consumer Satisfaction‖, MBA thesis, Business administration, University of Surrey, 2005.
[2] Glanz, B. A., Building Customer Loyalty - How You Can Help Keep
Customers Returning, 1st ed., McGraw-Hill, USA, 1994.
[3] Al-Nasser, S., ―Customer satisfaction and competitive advantage: The case of SABIC (Saudi Basic Industries Corporation)‖, Master thesis, Business and information technology, Sheffield Hallam University, 1994.
[4] Omer, O. M. A., ―An examination of consumer time allocation‖, Ph.D. thesis, Business Administration, University of Manchester,
1998.
[5] The United Nations Agency for Information and Communication Technologies (ITU) website: http://www.itu.int/en/pages/default.aspx, accessed on
27/01/2010.
[6] Informa website: http://www.informa.com/What-we-
do/Industry-sector/IT-Telecoms Media/#main, accessed on
12/09/2009.
[7] Communication and Information technology Commission (CITC)
website: www.citc.gov.sa, accessed on 16/02/2011.
[8] Saudi Telecom (STC) website: www.stc.com.sa, accessed on
19/02/2010.
IJSER © 2011 http://www.ijser.org
International Journal of Scientific & Engineering Research Volume 2, Issue 9, September-2011 8
ISSN 2229-5518
[9] Hassan, S. A., El-Darrab, I. A. and Al-Ameer, M. A. A, ―Dynamic Programming Model for Scheduling the Electric Transmission/Distribution Substations in Jeddah City‖, WSEAS Int. Conferences, Univ. of Cambridge, Cambridge, United Kingdom, 2009.
[10] Mobily website: www.mobily.com.sa, accessed on 19/02/2010.
[11] Law, A.M. and Kelton, W. D., Simulation Modeling and Analysis, 3rd. ed., McGraw-Hill, 2000.
[12] Kelton, W.D., Sadowski, R.P., and Swets, N.B., Simulation with
Arena, 5th ed., McGraw-Hill, USA, 2010.
[13] Rossetti, M.D., Simulation Modeling and Arena, Wiley.
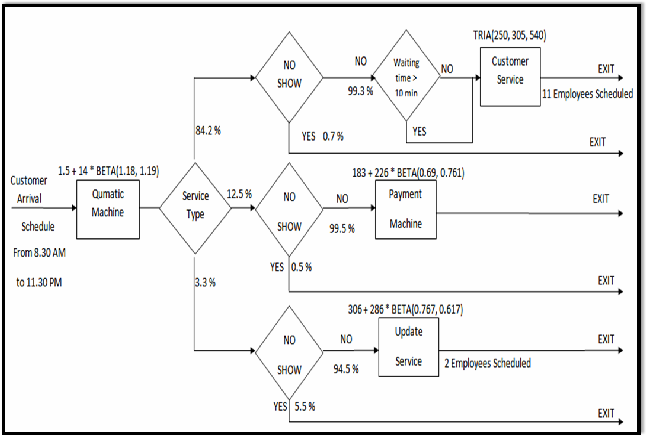
Figure 1: The system flow chart
IJSER © 2011 http://www.ijser.org