The research paper published by IJSER journal is about Improvement in Reliability Analysis using Distributed Generators 1
ISSN 2229-5518
Improvement in Reliability Analysis using
Distributed Generators
Japinder Pal Singh Virk, Dr. Smarajit Ghosh
Abstract - Reliability is a key factor aspect of power system design and planning. In this paper we present a reliability analysis after and before connecting a Distributed Generation on radial distribution systems. The distribution systems on which calculations are carry out and data index of failure rate and repair time are taken as default data. The placement of distributed generation and its effects on reliability is investigated. A power flow calculation is used to check the power handling constraints. Reliability indices is developed and reliability index is proposed for load points and the overall system
Keywords – CAIDI, DG set, Default Failure Rate, Default Repair Time, Energy management, Reliability, SAIDI, Voltage improvement.
—————————— ——————————
In Power systems the share of distributed generators has been gradually increasing in the last few years and will rise even more in near future. It is due to many factors like advances in clean and renewable energy sources are becoming more cost effective. Distributed generation can allow utilities to defer transmission and distribution upgrades. By placing these alternative energy sources, and other smaller traditional energy sources, on the distribution power system, will lead to the development of a new model related to distributed generation (DG). The technologies adopted in DG consist of micro-turbines, wind and solar energy, fuel cells, small gas turbines, etc. DG can be used in an isolated way, supplying the consumer’s local demand, or in an integrated way, supplying energy to the remaining of the electric system. This local generation reduces the need for large-scale utility projects. [1]
These days the performances of Distributed generators are getting near to those of large power plants due to their less cost and better efficiency. Also it is easy to install the distributed generators on the place of building power plants and transmission lines. DG provide better efficiency and voltage profile and hence less losses.
DG can overcome the deficiencies in the transmission
system and therefore prove beneficial for both consumers and utilities especially where central generation is not practicable. DG can provide many benefits such as voltage support,
————————————————
Mr.Japinder Pal Singh Virk was born in Punjab, 1983. He received the
M.E. (Power System and Electric Drives) from Thapar University, Patiala, Punjab, India in 2008 and now working as A.P in RIMT- IET Mandi Gobindgarh and Pursuing Ph.D from Singhania University.
Dr. Smarajit Ghosh was born in West Bengal. He received his B.Tech. and M.Tech. from Calcutta University and Ph.D. from IIT , Kharagpur. At present he is the professor & Head in the department of electrical a nd instrumentation engineering, Thapar University, Patiala.
improved utility system, reliability, loss reduction, transmission and distribution capacity release and better power quality. For getting these positive impacts of DG it must be of proper size and proper place, dispatch able and reliable. Now days System Planning engineer while dealing with the increase of DG penetration uses optimization method which indicated the best solution for a given distribution network. Both utilities and end users can install distributed generators, generally for different reasons. Distributed generators are most cost efficient if the customer has need for: Cogeneration-: The economics of many applications significantly improves by using the generator waste heat locally. Uses include process steam, facility heat, heating water, or running air conditioning.
reliability of system many locations need. if once they are
bought, running them full time or for peak shaving proves in more economical.
Utilities most need local generation with overloaded circuits
Applying generation closer to the load, benefits the transmission and distribution infrastructure. Local generation can reduce overloaded transmission and distribution services as well as reduce losses and voltage drop.
The Table 1.1 shows the various distributed generation technologies which include [3]
Several energy sources drive distributed generators including
![]() Reciprocating engines
Reciprocating engines
IJSER © 2012 http://w w w .ijser.org
The research paper published by IJSER journal is about Improvement in Reliability Analysis using Distributed Generators 2
ISSN 2229-5518
![]()
Gas Turbines Micro turbines Wind turbines Fuel cells
Photo voltaic
Other renewable Sources
Micro turbines, many wind turbines, fuel cells, and photo voltaic interface through inverters. Normally, reciprocating engines and combustion turbines interface through synchronous generators
Basically DG technologies comprise of energy generation and storage systems placed at or near the point of use. Distributed Generation primarily include a range of technologies including reciprocating engines, fuel cells, microturbines, load reduction, and other energy management technologies. In addition to it Distributed Generation also encompasses power electronic interfaces, as well as communications and control devices for efficient dispatch and operation of single generating units, aggregated blocks of power, and multiple system packages.
The basic fuel for distributed generation is natural gas but hydrogen can also be used in the near future. The primary fuel for many distributed generation systems is natural gas, but hydrogen may well play an important role in the future. Renewable energy technologies such as solar electricity, biomass power, and wind turbines are also popular.
For upcoming energy companies, industries and their
customers emerging distributed generator technologies have
the capability to provide practical attractive and economical generation options. In the energy segments these technologies are primarily used to
(1) Support the operation and management of transmission and distribution systems.
(2) Improve the service and delivery of energy to end users
Distributed resource technologies range in size from 3-10 kW
for residential systems to 50-500 kW for commercial users to 1-
50 MW in the industrial market segment.
A distributed generator is often placed at a substation to avoid further land purchases. At substations, distributed generator acts only as a backup power source only, which may not prove significant as far as the entire system is concerned. However generators placed on a circuit can often remarkably affect system reliability. Therefore it is utmost importance to evaluate the effects of different placements of distributed generators.
Reliability is affected by the following
• Varying loading
• Switch/protective device placement
• Switch operation times
• Available alternative feeds
• Equipment current limits
• Equipment failure rates
• Equipment repair times.
In this paper the improvement of reliability by distributed generators is confirmed through a case study. The case study uses a test circuit developed to show the influence of various factors on system reliability. It also shows how different DG placements affect the reliability of the system.
This analysis relies on two general classes of
information to estimate the reliability: component reliability parameters and system structure. Using system structure and component performance data, we can evaluate the reliability of specific load points or the whole distribution system. The structure information is achieved by the circuit traces. Predictive reliability techniques suffer from data collection difficulties. Simplifying assumptions (default values) are required for practical analysis of distribution systems.
Every customer is connected to a feeder. A feeder is the connection from a sub-station through wires, transformers etc. to a customer. It is fairly common practice in the electric utility industry to use the standard IEEE reliability indices like CAIDI, SAIFI, SAIDI to track and benchmark reliability performance. [7]
![]()
![]()
IJSER © 2012 http://w w w .ijser.org
The research paper published by IJSER journal is about Improvement in Reliability Analysis using Distributed Generators 3
![]()
![]()
ISSN 2229-5518
These two performance indices express interruption statistics in terms of system customers. A customer here can be
an individual, firm, or organization who purchases electric services at one location under one rate classification, contract or schedule. If service is supplied to a customer at more than one location, each location shall be counted as a separate customer.
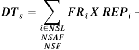
Improved_CAIDI A new measure of reliability referred to as Improved_CAIDI’ is introduced here. Improved_CAIDIj helps to identify the areas that need improvement. Improved_CAIDIj is given by [7]![]()
![]()
Where
SAIDIckt = Average SAIDI for the circuit of interest
CAIDIj = CAIDI for segment j
To find Improved_CAIDI we need to find Reliability Indices. For this calculation assume that there is singe failure incident.
The down time for the segment S, DTs is given by![]()
![]()
Where
Fri = the failure rate for segment i
REPi = the average repair time for segment i
SOTi = switch operation time to re-supply segment S due to the failure of segment i.
To find failure rate segment for i (Fri) and the average repair time for segment i (REPi ) we need to find the functional characterization as follows![]()
The availability of component functionally is characterized by
the following indices:![]()
Where
Frj = the failure rate for component j
The average repair time for a segment i, REP1 , can be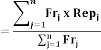
calculated by![]()
![]()
Where
Frj = the failure rate for component j
Repj = the average repair time for component j n = the number of components in segment i.
These indices are computed for each segment in the feeder. All load points within a segment experience the same failure rate and down time. In the reliability analysis program, failure rates and repair times from field data are preferred. When this data is not available, default values are fetched from a table in the relational database which has generic average failure rates and repair times for each type of device.
Now system index SAIDI (system average interruption duration index) is then given by![]()
![]()
![]()
Where
Ci = The number of customers attached to segment i. DTC = Total customer down time
To find SAIDI we need to find the total customer down time,![]()
![]()
![]()
DTC, for a given circuit it can be calculated by
![]() Annual Failure Rate = the annual average frequency of failure
Annual Failure Rate = the annual average frequency of failure
![]() Annual Down Time = the annual outage duration
Annual Down Time = the annual outage duration
experienced at a load point.![]()
The failure rate for segment i, FRi , is the sum of the failure rates of all the components contained in the segment i as given by![]()
After solving Functional Characterization we can easily find
the values of Down Time for segment S and on the bases of DTs we can find customer average interruption duration index (CAIDI) for the same segment as DTs
![]()
![]()
IJSER © 2012 http://w w w .ijser.org
The research paper published by IJSER journal is about Improvement in Reliability Analysis using Distributed Generators 4
ISSN 2229-5518
3.2 Improved Reliability Index
Now after performing the above calculations from equation 2 to 8 we will find the value of Improved_CAIDI’ as mentioned above in equation 1 and![]() If Improved_CAIDIj > 1, then customers in
If Improved_CAIDIj > 1, then customers in
segment j have reliability better than average.![]() If Improved_CAIDIj = 1, then the customers in
If Improved_CAIDIj = 1, then the customers in
segment j have average reliability![]() If Improved_CAIDIj < 1, then the reliability of the customers in segment j is less than average
If Improved_CAIDIj < 1, then the reliability of the customers in segment j is less than average
System 1 is presented in Figure 4.1. This system consists of only one substation Sub1, and 30 customers. The number attached to each sectionalizing device is the number of customers in that segment.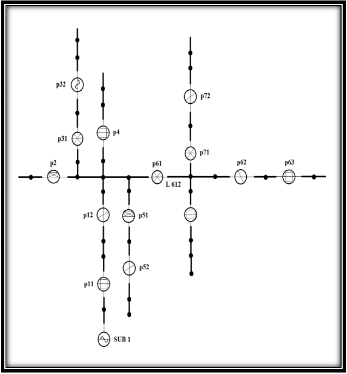
Figure 4.1 System 1[7]
Line S 612 is assumed failed and switch p61 is assumed to
have opened. Thus the set of segments losing power due to the operation of p61 is
SCS = {p31}
SCNS = {p11, p12, p61, p62}
CNS = {p62}
CS = {NULL} and
ASCR = ASCNR= NPR= {NULL}
Table 4.1 Equipment Index Table
{p71, p72, p8, p62, p63}
Assume that segment p62 is the segment of highest priority. Applying set Equations (1) - (8) relative to segment p62 gives L = {p11, p12, p31, p61, p62}
DFR= Default Failure Rate;
DFT= Default Repair Time
In Figure 4.2, an adjacent circuit C2 is added to the system. This circuit has some remaining capacity, which
IJSER © 2012 http://w w w .ijser.org
The research paper published by IJSER journal is about Improvement in Reliability Analysis using Distributed Generators 5
ISSN 2229-5518
means it is possible for it to supply some power to circuit C1. Te circuit 2 i.e C2 is consists of Alternative feed and DG distributed generator DG is added near to the point where
circuits C1 and C2 have their tie switch.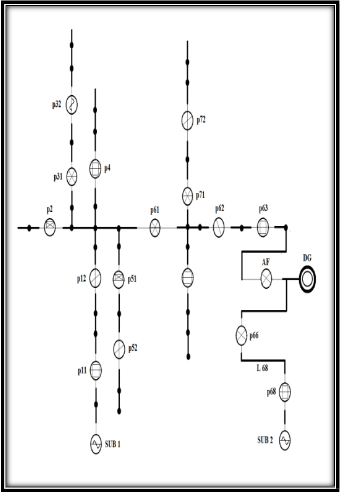
Figure 4.2 System 2: Adding a Distributed Generator
In any case if the load in circuit C2 grows so that substation Sub2 can no longer pick up any load in circuit C1, then distributed generator DG will get automatically activated. This provides a source of power that can also be used to supply loads switched from C1 to C2. Now the availability of DG will increase the reliability of circuit C1. Table 4.3 shows the improvement in annual down time for the segments in circuit C1.
Table 4.2 Comparison of Reliability Improvements
p62 | 0.392 | 0.125 | 78% |
p61 | 0.357 | 0.220 | 62% |
p71 | 0.305 | 0.128 | 58% |
p72 | 0.453 | 0.221 | 51% |
p12 | 0.389 | 0.200 | 48% |
p8 | 0.316 | 0.183 | 42% |
p31 | 0.282 | 0.177 | 37% |
p4 | 0.268 | 0.174 | 35% |
p2 | 0.275 | 0.180 | 34% |
p51 | 0.283 | 0.189 | 33% |
p52 | 0.324 | 0.230 | 29% |
p32 | 0.382 | 0.305 | 20% |
P11 | 0.221 | 0.221 | 0% |
From Table 4.2, we can easily that the segments close to DG (etc. P62, P63) have more improvement than those (etc P52, P32) far from DG. whereas the segment P11, which is next to source Sub1, has no improvement at all. This is primarily due to increase in the distance between the segment of interest and the alternative feed; the alternative source needs to supply more and more power to its adjacent circuit in order to restore the segment of interest. Due to this the remaining capacity becomes less and less. When load reaches at the point where the alternative source has no spare capacity to pick up any more load, then the availability of DG will not make any additional contribution to the reliability of its adjacent circuit.
In this work, reliability analysis has been done. The reliability of the given load point and an entire system is calculated with set calculations coupled with circuit traces. An application has been developed for the implementation of this algorithm. Investigation of placement of Distribution Generation and its effects on reliability is done. An evaluation of reliability over time varying load curves is also presented. The present work shows that with the implementation of Distributed Generator the reliability of system improve.
There are also other ways to enhance a system’s reliability, besides adding a distributed generator. For example, the system structure can be changed by adding more protective devices or by moving sectionalizing devices forward or backward. And after recalculating and comparing them with the original values, we can have better results which will improve the reliability.
[1] IEEE P1547-D11-2003, Draft Standard for Distributed Resources
Interconnected with Electric Power Systems.
[2] Barker, P. P. and De Mello, R. W., “Determining the Impact of
Distributed Generation on Power Systems. I. Radial Distribution
IJSER © 2012 http://w w w .ijser.org
The research paper published by IJSER journal is about Improvement in Reliability Analysis using Distributed Generators 6
ISSN 2229-5518
Systems,” IEEE Power Engineering Society Summer Meeting,
2000.
[3] Konstantinos Angelopoulos, thesis on Integration of Distributed Generation in Low Voltage Networks: Power Quality and Economics
[4] D.P. Gaver, F.E. Montmeat, A.D. Patton, Power system reliability: Measures of reliability and methods of calculation. IEEE Trans. Power Apparatus Syst., Vol. 83, pp. 727-737, July, 1964.
[5] C. E. Montmeat, A.D. Patton, J. Zemkowski, D. J. Cumming,
Power system reliability II—Applications and a computer program, IEEE Trans. Power Apparatus Syst., Vol. PAS-87, pp.
636-643, July, 1965.
[6] “Distributed Generation: Understanding the Economics”, Arthur
D. Little White Paper, 1999.
[7] Dan Zhu, A Thesis on Power System Reliability Analysis with Distributed Generators submitted to Virginia Polytechnic Institute and State University.
[8] Barker, P., et al., Integration of Distributed Resources in Electric Utility Systems: Current Interconnection Practice and Unified approach, Power Technologies, Inc., EPRI Report TR-111489.
[9] Solutions for the Connection and Operation of Distributed
Generation, DTI/OFGEM Technical Steering Group Workstream 3
Short-Term Network Solutions.
[10] Robert P. Broadwater, Hesham E. Shaalan, Distribution system reliability and restoration analysis, Electric Power System Research, 29 (1994) pp. 203-211
[11] Joel Adams, Sanford Leestma, Larry Nyhoff, C++ Introduction to computing (second edition), pp. 762-775.
IJSER © 2012 http://w w w .ijser.org