International Journal of Scientific & Engineering Research, Volume 6, Issue 2, February-2015 1360
ISSN 2229-5518
Implications of Seasonal Changes on Conception and Birth in Lagos State, Nigeria
Aladeniyi, O. B.*, Abiodun, T.
The Book of Ecclesiastes in the Bible proclaims that there is “a time to be born.” [7]. We lived in a world of seasons where many social and ecological processes and events occur regularly every year. These seasonal processes influence many vital rates including birth rates. According to Dorelien [14], births occur throughout the year, but there are groups of months with higher frequencies of births than one would expect by chance alone if the distribution was uniform. Despite the cyclical pattern in the human female reproductive system, humans have the potential of year round reproduction. All human societies have experienced marked seasonal variations in conceptions and births due to the prevailing patterns of economic and social life, often dictated by the seasons or by religious prohibitions. As reported by Ayeni [3],[21] and [11], seasonal variation in the frequency of births is a nearly universal phenomenon in human populations. Consistent patterns of birth seasonality have occurred in virtually all geographic locations, often with remarkable stability across time and during extraordinary social and cultural changes. [8]. Over time, demographic research has shown a seasonal pattern in births for populations of many different countries and regions. These trends often identify a peak season – a period of maximum annual births – and a trough season – a period of minimum annual births. According to Bantje [4], lack of vital statistics data and the prevailing hypothesis that temperature is one of the main drivers of birth
seasonality resulted in few studies of birth seasonality in sub-Saharan Africa (SSA).
The distribution of births by months exhibits a seasonal pattern in most populations. Indeed, the absence of birth seasonality in any particular population can be considered a remarkable observation [10]. Variations in fertility and seasonal patterns of childbearing have been of interest to medical scientist and demographers for a long time. Medical sciences are replete with literatures on the seasonal rhythms in humans and have shown that hormone levels fluctuate on the basis of the month [32], [30], [12], [24]. Demographers have documented cyclical patterns in the incidence of cancer risk, depression, obesity, criminality, schizophrenia, insanity, genius and even death on the basis of birth month. [9], [22], [1]. Biometeorologists have observed that temperature is associated with fecundity in both humans and in animal species [33], [25]. There is indication that photoperiod may also be a factor in this relationship [6]. Ogum et., al [28], while studying the seasonal birth pattern in South eastern Nigeria from 1971-
1976 revealed a seasonal pattern in the monthly distribution of births, with the peak period observed during April-June, and a trough during November-January. Ayeni [3] reported similar findings while analyzing live births between 1965 and 1975 in Igbo-Ora, a rural area in South Western Nigeria, the monthly number of registered births showed a significant seasonal pattern in May and corresponding minima in November. Although, the
IJSER © 2015 http://www.ijser.org
International Journal of Scientific & Engineering Research, Volume 6, Issue 2, February-2015 1361
ISSN 2229-5518
different studies of Ogum [28] and Ayeni [3] mentioned above did not really investigate the causes of the observed seasonality pattern, they nonetheless alluded the observed seasonal pattern to the climatic factors as well as socio- cultural patterns of life associated with cyclical farming activities of a predominantly agricultural community in their study area. However, Enabudoso et.,al [16] noted a sinusoidal pattern with peak delivery rates in April-May and October and lowest rates in July-August and December in their analysis of monthly deliveries in Benin City, Nigeria. The July-August/December trough observed in the Enabudoso et., al [16] study is in contrast to the November minima pattern observed in the studies of Ogum [28]. This may be due to the urban setting of Benin city which is different to the rural setting of the other two studies. According to Ellison et., al [15], the broad prevalence of human birth seasonality does not imply simple causation. Several mechanisms have been proposed to account for the seasonality of births in different specific cases, and most investigators acknowledge that multiple causes are almost certainly involved. However, as affirmed by Doblhammer- Reiter et al. [13]; with the numerous explanatory models that have been proffered, the real causes of birth seasonality patterns are still regarded as a “puzzle” and a “mystery”.
The objectives of this study were to investigate the influence of temperature on the seasonal birth and conception patterns; and determine monthly variations in birth deliveries in Lagos, South West Nigeria which have been understudied.
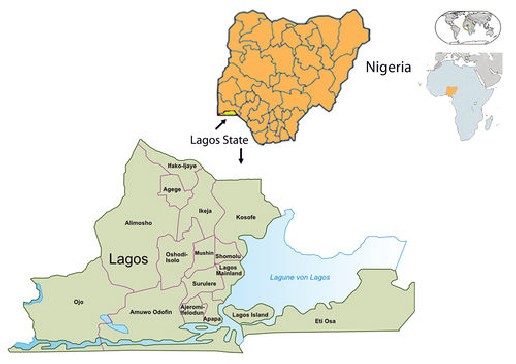
Lagos State lies to the south-western part of Nigeria, and shares boundaries with Ogun State both in the North and East and is bounded on the west by the Republic of Benin. In the South it stretches for 180 kilometres along the coast of the Atlantic Ocean. [17]. Based on the 2006 national population census, the National Population Commission (NPC) estimated Lagos’s population to be 9,113,605 with a sex ratio of 1.074 males to 1 female [25]. The Lagos State government however estimated a population of 17,552,942 [19]. It is located partly in the swampy mangrove and partly rain forest regions of West Africa having bi–modal rainfall maxima annually. It receives mean annual rainfall of about 2000 mm [27]. According to BBC, [5], the average temperature in January is 27°C (79°F) and for July it is 25°C (77°F). On average the hottest month is March; with a mean temperature of 29°C (84°F); while July is the coolest month.
_Collaborative_Climate_Adaption_Project)
IJSER © 2015 http://www.ijser.org
International Journal of Scientific & Engineering Research, Volume 6, Issue 2, February-2015 1362
ISSN 2229-5518
Data on birth deliveries in Lagos State from 2008-
2013 was collected from the Healthcare Planning Research and Statistics Unit of the Lagos State Ministry of Health.![]()
![]()
𝑆 = ∑ √𝑁𝑖 𝑆𝑖𝑛 𝜃𝑖![]()
𝐶 = ∑ √𝑁𝑖 𝐶𝑜𝑠 𝜃𝑖![]()
𝑊 = ∑ √𝑁𝑖![]()
𝑑 = �(𝑆 2 +𝐶 2 )
𝑊
𝑎 = 4𝑑
Ni corresponds to the number of events (e.g.
𝑘(=12)
Average Mean temperature values over Lagos
Births) in month i and ∑𝑖
𝑁𝑖 = 𝑁 . The
(Latitude 6.5°N, Longitude 3.3°E) between 2007 and 2013 were obtained from Weatherspark Weather data graphs (http:// http://weatherspark.com/#!dashboard;ws=2
8568;t0=1/1;t1=12/31;graphs=temperature:1). The integrity of the data has been attested by many researchers [26], [31]. They have found the data set to be of high quality and suitable for study such as this.
The first statistical test especially designed for seasonality or more generally speaking for cyclic trends is Edwards’ Test published in 1961. As explained by Rau [29]], several others modified this test in order to be valid for small sample sizes or to allow for a different alternative hypothesis. They all use sine and cosine waves to approximate the observed pattern. Given a circle whose
circumference is divided into k equal long parts. In the case of months per year, k = 12. Thus, each month’s contribution to the surface of the circle is a sector of 30 degrees: January from 0 to 30◦,
February from 30◦ to 60◦, and finally December
from 330◦ to 360◦.
parameter 𝜃𝑖 indicates the position of the weight of
each month on the wheel.
Hewitt’s test is based on ranks, it should be used in
conjunction with the winter/summer-ratio to have a measurement of the height of the seasonal fluctuations.
Edwards’ seasonal test and Ratchet circular scan
test were used to determine presence of seasonality
and 2-month & 3-month seasonal peaks respectively. These tests were performed using PEPI. Also, the peak amplitude, phase angle were determined using the PEPI. PEPI is a set of statistical programs for epidemiologist. "PEPI" is an acronym for "Programs for EPIdemiologists".[2]
The health centers were categorized into the five (5) administrative divisions (Ibile) in Lagos state. Their birth delivery records were aggregated according to the divisions. The divisions are Ikeja, Badagry, Ikorodu, Lagos (Eko) and Epe.
Using PEPI, the monthly birth records of the five divisions and the state as a whole were analyzed to test for presence of seasonality.
S/N | Division | V(N) | Amplitude (%) | Edwards' Test (Peak Date) | Ratchet Circular Scan test | |
S/N | Division | V(N) | Amplitude (%) | Edwards' Test (Peak Date) | 2 Month Peak | 3 Month Peak |
1 | Badagry | 0.036 | 18.6 | June 1st | March-April | March-May |
2 | Eko | 0.045 | 19.5 | April 16th | March-April | March-May |
3 | Epe | 0.074 | 30.9 | June 23rd | March-April | March-May |
4 | Ikeja | 0.029 | 12.5 | July 7th | September-October | May-July |
5 | Ikorodu | 0.084 | 42.9 | May 28th | March-April | June-August |
6 | Lagos | 0.040 | 19.1 | June 1st | March-April | March-May |
All the divisions except Ikeja had a 2 month peak in March-April, while Ikeja had its own 2 month peak in September-October. Similarly, all the five
divisions except Ikeja and Ikorodu had a 3 month
peak of March-May. Ikeja’s 3 month peak is from
May to July, while Ikorodu’s 3 month peak is from
June-August. The amplitude of birth seasonality in
IJSER © 2015 http://www.ijser.org
International Journal of Scientific & Engineering Research, Volume 6, Issue 2, February-2015 1363
ISSN 2229-5518
Lagos from the aggregate data is 19.1% of peak frequency, with the peak date being June 1st.
However, the amplitude for the five Lagos divisions varies from 12.5% to 42.9%. This agrees with the findings of Dorelein (2013) in which Nigeria was found to have peak amplitude of approximately 40 or above.
Furthermore, as seen from the Table 1 above, the
Ikorodu division exhibits more seasonality as
compared to the other 4 divisions in Lagos state. Ikorodu division has the highest V(N) number of
0.084 with the corresponding highest amplitude of
42.9%.
Fig. 2 to Fig. 7 shows the seasonal variation of Lagos state and the five divisions
Red marker in the plot denotes the peak of the 12 months sinusoidal curve.
The birth data that has been seasonally adjusted by a period of 12 was correlated with Mean Temperature.
Temperature
IJSER © 2015 http://www.ijser.org
International Journal of Scientific & Engineering Research, Volume 6, Issue 2, February-2015 1364
ISSN 2229-5518
effect of temperature on the birth seasonality pattern and conception pattern.
From Table 2 above, r = -0.024, which means that the correlation between temperature and birth seasonality is very weak or even negligence. This confirms that there is no significant relationship between temperature and birth seasonality in Lagos.
The birth data (2008-2013), seasonally adjusted by a period of 12 was correlated with Mean Temperature that was lagged by 9 months (April
2007).
Temperature
Conceptio n | Temperat ure | ||
Concepti on | Correlation | 1 | -0.237* |
Concepti on | Sig. (2-tailed) | 0.045 | |
Tempera ture | Correlation | -0.237* | 1 |
Tempera ture | Sig. (2-tailed) | 0.045 |
* Correlation is significant at the 0.05 level (2- tailed).
Table 3 above showed r = -0.237 at P < 0.05, this implies that a strong increase in temperature will reduce conception by a small margin. This is consistent with the findings of Lam & Miron (1996).
The distribution of births by months exhibits a seasonal pattern in most populations. Indeed, the absence of birth seasonality in any particular population can be considered a remarkable observation. This study documented birth seasonality in Lagos state and investigated the
Furthermore, it was discovered that there is no significant relationship between the temperature
and birth seasonality in Lagos. However, there appears to be a negatively weak significant relationship between temperature and conception pattern.
The birth record in Lagos state displayed strong
seasonality effect at 99% confidence level. The V(N) for the various divisions in Lagos state varied from 0.029 to 0.088. The monthly birth distribution displayed a sinusoidal pattern with peak delivery rates in March—May and October and lowest rates in August and December. The months of March, April, May, and October had delivery rates that were significantly higher than the rest of the months. This pattern agreed with the pattern observed for Benin City [16].
However, there appears to be a significant relationship between temperature and conception pattern. This is in consonance with the findings of [18], [21], [23].
[1] Abas, W. and D. Murphy (1987) Seasonal affective disorder: The miseries of long dark nights.
British Medical Journal 295:1504-1505.
[2] Abramson, J.H.(2011) WINPEPI updated:
computer programs for epidemiologists, and their teaching potential. Epidemiologic
Perspectives & Innovations. 2011, 8:1
[3]Ayeni, O. (1986): Seasonal variation in births in rural southwestern Nigeria. International
Journal of Epidemiology ( 15), 91–4.
[4]Bantje, H. (1987). Seasonality of births and birthweights in Tanzania. Social Science &
Medicine, 24(9):733–739.
[5] BBC (2010): Weather Centre - World Weather - Average Conditions Lagos.
http://www.bbc.co.uk/weather/world/city
_guides/city.shtml. Retrieved on 23rd July,
2014
IJSER © 2015 http://www.ijser.org
International Journal of Scientific & Engineering Research, Volume 6, Issue 2, February-2015 1365
ISSN 2229-5518
[6] Becker, S. (1991) Seasonal patterns of births and conception throughout the world. In A W .
Zorgniotti (ed.), Temperature and Environmental Effects on the Testis. New York, NY: Plenum Press.
[7] Bible: Ecclesiasts Chapter 3 verse 2.
[8] Bobak, M. and A. Gjonca (2001). “The
seasonality of live birth is strongly influenced by socio-demographic factors”. Human Reproduction
16 (7): 1512-1517.
[9] Bradbury, T.N., O.A Miller (1985). Season of
birth in schizophrenia: A review of evidence,
methodology, and etiology. Psychological
Bulletin 98(3):S69-594.
[10] Brewis, A., Laylock, J., & Huntsman, J. (1996): Birth non-seasonality on the Pacific equator. Current Anthropology, 87, 842–51
[11] Bronson, F. H. (1995) Seasonal variation in human reproduction: environmental factors.
Quarterly Review of Biology (70) 141–64.
[12] Condon, R. G. & Scaglion, R. (1982): The
ecology of human birth seasonality. Human
Ecology, 10, 495–510.
[13] Doblhammer-Reiter, G., Rodgers, J.L. & Rau,
R. (1999): Seasonality of Birth in Nineteenth
and Twentieth Century Austria: Steps
toward a Unified Theory of Human
Reproductive Seasonality. MPIDR Working Paper WP 1999-013.
[14] Dorélien Audrey M. (2013): A Time to Be Born: Birth Seasonality in Sub-Saharan Africa. PSC Research Reports, Reports 13-785, ,March 2013. University of Michigan Institute of Social Research. [15] Ellison T. Peter., Claudia R. Valeggia and Diana S. Sherry (2005): Human Birth Seasonality
In Seasonality in Primates: Studies of Living
and Extinct Human and Non-Human
Primates, ed. Diane K. Brockman and Carel P. van Schaik. Published by Cambridge University Press. Pp 379-400.Cambridge University Press 2005
[16] Enabudoso EJ, Okpighe AC, Gharoro EP, Okpere EE (2011). Delivery rate in Benin City,
Nigeria: Are there seasonal variations?
Nigerian Journal of Clinical Practice
2011;14:129-31.
[17] http://www.ngex.com/nigeria/places/states/lagos.h tm. Accessed July 20, 2014
[18] Kandeel, F. R. & Swerdloff, R. S. (1988). Role of temperature in regulation of spermatogenesis and
the use of heating as a method for contraception.
Fertility and Sterility, 49, 1–23.
[19] Lagos State Government (2014): Population
Lagos State.
[20] http://www.lagosstate.gov.ng/pagelinks.php
Accessed July 20, 2014
[21] Lam, D.A and J.A Miron (1991) Seasonality of
births in human populations. Social Biology
38(1-2):51-78.
[22] Land, K.C. and D. Cantor (1983) Arima models
of seasonal variations in U.S. birth and death rates.
Demography 20(4):541-568.
[23] Levine, R. J. (1994). Male factors contributing to seasonality of human reproduction. Annals of the New York Academy of Sciences, 709, 29–45.
[24] Levine, R. J. ( 1991). Seasonal Variations in human semen quality. In A. W. Zargniotti (ed.), Temperature and Environmental Effects on the Testis. New York, NY: Plenum Press.
[25] MacFarlane, W.V. (1970): Seasonality of
conceptions of human populations. Biometeorology
4:167-182.
[26] Mohan, Manju Anuj Gupta, Shweta Bhati (2013). A Modified Approach to Analyze Thermal Comfort Classification. Atmospheric and Climate Sciences, 2014, 4, 7-19. Published Online on January 2014 via http://www.scirp.org/journal/acs. http://dx.doi.org/10.4236/acs.2014.41002
[27] Ojo O, Gbuyiro SO, Okoloye CU (2004):
Implications of climatic variability and climate
change for water resources availability and management in West Africa. Geo. J. 61:
111–119.
[28] Ogum G.E, and Okoroafor A.E (1979):
Seasonality of Birth in South-eastern Nigeria.
Journal of Biosocial Sciences. Vol. 11, Issue 02, pp
209-217
[29] Rau, Roland (2007). Seasonality in Human
Mortality: A Demographic Approach. ISBN-10 3-
540-44900-0 Springer Berlin Heidelberg New York
(Pp 39-81)
[30] Reinberg, A, M. Lagagney, F. Casselin, Y.
Touitou, J. Legrand, A Delassale, J. Antreassian, and A Lagagney (1978). Circadian and circannual rhythms in plasma hormones and other variables of five healthy young human males. Acta Endocrinologica 88:417-427.
IJSER © 2015 http://www.ijser.org
International Journal of Scientific & Engineering Research, Volume 6, Issue 2, February-2015 1366
ISSN 2229-5518
[31] Selimovic Lejla (2014). Energy analysis and experience obtained from the first passive house
area in Norway. Norwegian University of Science and Technology, Norway. Unpublished Master Thesis
[32] Tjoa, W.S., S.M. Smolensky, B. Hsi, E.
Steinberger and K. Smith. (1982). Circannual
rhythms in human sperm count revealed by serially independent sampling. Fertility
and Sterility 38:454-459.
[33] Tromp, S.W. (1963) Medical Biometeorology:
Weather, Climate and the Living Organism. Amsterdam, Holland: Elsevier Publishing Co.
Aladeniyi, O. B.
Department of Statistics, Federal
University of Technology, Akure, Nigeria
omoolabodunde@yahoo.com
IJSER © 2015 http://www.ijser.org