Inte rnatio nal Jo urnal o f Sc ie ntific & Eng inee ring Re se arc h Vo lume 3, Issue 3, Marc h -2012 1
ISS N 2229-5518
Identification of groundwater prospecting zones using Remote Sensing and GIS techniques in and around Gola block, Ramgargh district, Jharkhand India
1. M.P. Sharma, 2. Anukaran Kujur 3.Udayan Sharma
Abs tract- Remote sensing and Geographic Inf ormation System (GIS) is a rapid and cost eff ective techniques, it provides inf ormation of large and inaccessible area w ithin short span f or assessing, monitoring and management of groundw ater resources. The interpretation of the remote sensing data w ith conventional data and suff icient ground truth inf ormation makes possible to identify and delineate the various ground features such as geologic al structures, geomorphological f eatures and their characters that may cater direct or indirect presence of ground and surface w ater. The present study area is an attempt to delineate the groundw ater potential zones in and around Gola block of Ramgargh district, Jharkhand, Ind ia, using integrated approach of Remote Sensing and GIS techniques. The groundw ater prospect map is a systema tic eff ort and has been prepared considering ma jor controlling f actors, such as geology, geomorphology, drainage pattern, drainage density, lineaments, slopes etc. w hich inf luence the occurrence, movement, yield and quality of groundw ater. The map presents hydrogeomorphological aspect, w hich are essential for planning, development, management and extraction of groundw ater. The present inf ormation depicted is very usef ul f or planner and local authority in respect of site selection of w ell types, depth of w ell, w ater quality, success rate of w ells and as w ell as groundw ater development and management.
Inde x Terms- ASTER DEM, GIS, Gola b lock, Groundw ater Potential Zone, Hydrogeomorphology, Remote sensing
—————————— ——————————
1 INTRODUCTION
he application of remote sensing techniques in ground water study mainly uses visual interpretation of satellite data. It is rapid and cost- effective tool for assessing, monitoring and conserving groundwater recourses. Multi-temporal and multi-sensor data cover large and inaccessible area within short span. The concept of integrating remote sensing and GIS has emerged in the last decade as an essential tool for resource planning and management. GIS is an effective tool for collecting, storing, transforming, retrieving, displaying and analyzing spatial data from the real world for particular use. These days GIS is being used for various purposes such as evaluation of ground and surface water resources, feasibility of recharge sites, identifying contaminated sites, land use pattern, land cover etc. In recent years several workers such as Teeuw 1995; Goyal et al 1999; Saraf A. K. and Choudhary P. R. 1998; Murthy, 2000; have successfully applied remote sensing and GIS technique for groundwater prospecting and recharge sites. Krisnamurthy et al., 1996; Singh and Prakash, 2000; Jayswal et al., 2003; have used GIS to delineate groundwater potential zones. Srinivasa, Rao and Jurgran, 2005 have applied GIS for prospecting and interpretation of groundwater quality. In the present study area , the remote sensing data of IRS -P6, LISS-III, 22 April
2006, geo-coded at the scale of 1:50000 and Survey of India toposheet No. 73 E/10 have been used for the preparation of various thematic map, such as geology, geomorphology, lineament, slope and drainage density. The technique of GIS has been applied to delineate groundwater potential zones in the area constituting pre and post Cambrian formation. 115 wells have been selected in the area for preparing groundwater prospect zone.
Study area-The study area lies in SOI toposheet No. 73E/10 falling between latitude 23o30’00”- 23o37’30”N and longitude
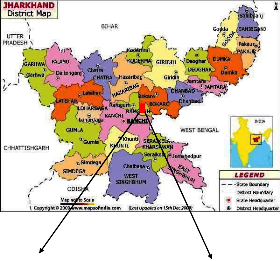
85o37’30” - 85o45E in Gola block Ramgargh district of Jharkhand state and is situated in NNE of Ranchi comprising about 70 kms by road from the city.
IJSER © 2012 http :// www.ijser.org
Inte rnatio nal Jo urnal o f Sc ie ntific & Eng inee ring Re se arc h Vo lume 3, Issue 3, Marc h -2012 2
ISS N 2229-5518
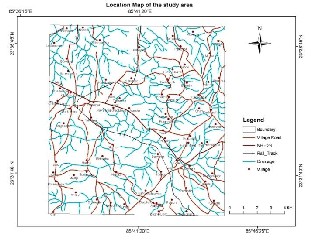
Fig. 1 Location map of the study area
2 D AT A USED
a. IRS - P6, LISS-III data (path and row 105 -55), 22 April 2006, geocoded at the scale of 1:50000
b. Survey of India toposheet no. 73 E/10 on scale 1:5000
c. Geological quadrangle map of the area on 1:250000 scale.
d. ASTER GDEM 30m (USGS/NASA ASTER DEM data),
available from http://www.gdem.aster.ersdac.or.jp
3 METHODOLOGY
Methodology adopted in the study area is as follow :-
The IRS P6 LISS-III is rectified geometrically and registered with SOI topographical maps on 1:50000 scale using ERDAS IMAGINE 8.5 image processing software through map to image registration technique. The FCC generated from green, red and near infrared (NIR) spectral bands (2, 3, and 4). Linear, equalization and root enhancement techniques have been followed in enhancing the satellite imagery for better interpretation of the geological, geomorphological and structural information. ARC GIS 9.0 has been used for digitization, editing and topology creation. Assignments of weightages of different themes and classes integration of multi-thematic information and delineation of groundwater prospect map generated through GIS. The groundwater prospect map, thus generated through this technique has been verified with field data to ascertain the validity of the model developed
.
3.1 Integration through GIS
Various favorable groundwater thematic maps have been integrated into a single groundwater prospect zone with the application of GIS techniques. It required mainly three steps.
Spatial data base building
Spatial data analysis
Data integration
3.2 Spatial data base building
In the ARC GIS software, tools have been provided in ARC GIS catalogue to create the features data sets, tables, geometric network and other items in data base. Following methods have been used to create thematic map.
I. Digitization of scanned maps
II. Editing for errors
III. Topology building
IV. Attributes assignment
V. Projection
3.3 Spatial data analysis
It is an analysis technique using study of locations of
geographic phenomena together with their dimension and associated attributes, table analysis, classification, polygon classification and weightage classification. All thematic maps like geology, geomorphology, lineaments and drainage have been converted into raster considering with 30m cell size considering accuracy. Each thematic map such as of geology, geomorphology, lineaments, drainage density and slope is considered and assigned a weightage depending on its influence on groundwater recharge and storage. For example geology plays a prominent role in groundwater prospect than lineament hence higher weightage given to geology.
3.4 Data Integration
Each thematic map such as geology, geomorphology,
lineament, drainage density an d slope provide certain clue of groundwater occurrence. Each theme is overlain on other theme to find the intersecting polygons. By this method a new map is obtained which is an integrated feature of two thematic maps. This composite map is overlaid by a third map, then fourth and so on, so that final composite map is obtained.
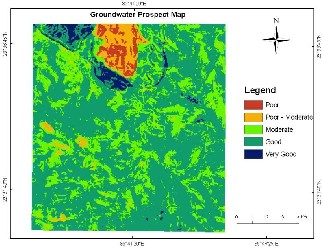
In the final weightage of the polygons in the final integrated layer were obtained using simple arithmetic model has been adopted to integrate various th ematic maps. The final map (fig. 8) has been categorized into five zones from poor to very good, from groundwater prospect point of view.
I. The thematic maps, of a) Geology, b) Geomorphology and c) Lineament map of the study area have been prepared on the scale 1:50000 using remote sensing data, and field data on Arc/Info GIS software package.
II. Drainage pattern and drainage density maps were prepared using Survey of India (SOI) toposheet number
73E/10 (1:50,000 scale) and have been updated with the help of satellite data.
III. Slope map has been generated from ASTER DEM
30m.
IV. For generation of above thematic maps data from Jharkhand Space Application Centre, Ranchi (JSAC) has been used. IRS - P6, LISS-III standard FCC of April 2006, in the scale of 1:50000 and Survey of India toposheet no.
73E/10 was used for base information.

Table 1 Flow chart:
IJSER © 2012 http :// www.ijser.org
Data Source
Primary Secondary
IRS-P6, LISS-III SOI Toposheet
Inte rnatio nal Jo urnal o f Sc ie ntific & Eng inee ring Re se arc h Vo lume 3, Issue 3, Marc h -2012 3
ISS N 2229-5518
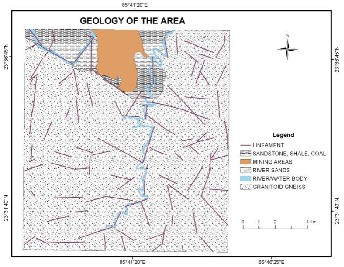
includes basal conglomerates, sandston es and olive green shale etc. Barakar formation, the main lithounit sequences of coalfield, is deposited over Talchir. It is composed of coarse grained to pebbly sandstone, medium to fine grained sandstone, grey and carbonaceous shale along with coal seams. Among intrusive igneous rocks lamprophyres are found in south eastern region of the Rajrappa project, which has resulted in the formation of columnar joints within shale.
Table 2 generalized geological succession of the study area
4.2 Lineaments
Lineaments are linear or curvilinear structures on the earth surface; it depicts the weaker zone of bed rocks and is considered as secondary aquifer in hard rock regions. These lineaments are mapped with the help of satellite data and be correlated with faults, fractures, joints, bedding planes, unconformities and lithological contacts. The study area is found to have a number of criss-crosed lineaments. The intersection of lineaments is considered as good occurrence of groundwater potential zones.
4.3 Geomorphology o f the area
Geomorphic features combined with structures and lithology
controls the occurrence, movement and quality of groundwater. An integrated study of the geology and evolution of landforms is useful to understand the occurrence of porous and permeable zones (Karanth, K. R., 1999). The study area has complex geomorphic features, which are described as follow:-
4. AN ALYSIS AND D ISCUSSION
4.1 Geological setup and lithology
The study area falls in the Chotanagpur Granite Gneissic Complex. The Hazaribag platea u, separated from the Ranchi plateau by the Gondwana belt, is predominantaly made up of lower Ranchi surface (Mahadevan, 2002). The lower Ranchi surface is broadly in the elevation of the region ranges between of 450-600m amsl. The outliers of Gondwana sediments lie over the Precambrian gneisses and high grade schistose basement formations. Precambrian basements are exposed on the floor of Damodar River and the periphery of eastern part the Gondwana basin. Main litho units are granite gneiss, mica – schist with quartzite and amphibolites which are interbeded and have been subjected to intense folding. The Lower Gondwana formations overlie Precambrian rocks. Talchir beds are well exposed in the Bhera river section, which
4.4 Cue sta
Cuesta (from Spanish: “slope”) is a ridge formed by gently
tilted sedimentary rock strata in a homoclinal structure (http://www.britannica.com/eb/topic-14944/cuesta). Prospect of groundwater in cuesta is rated good. The study area has cuesta in the northern part of the study area.
IJSER © 2012 http :// www.ijser.org
Inte rnatio nal Jo urnal o f Sc ie ntific & Eng inee ring Re se arc h Vo lume 3, Issue 3, Marc h -2012 4
ISS N 2229-5518
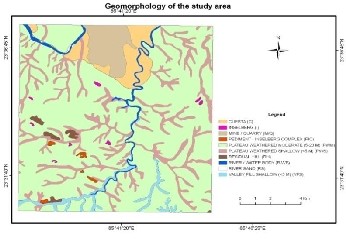
Fig 2 Geological map with lineaments of the study area
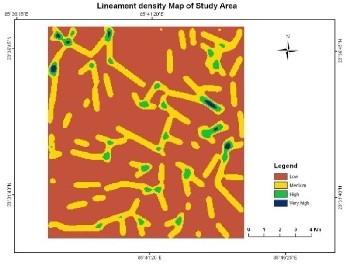
Fig 3 Geomorphological Map of the study area
Fig 4 Lineament density map of the study area
4.5 In selberg
These are isolated hills of massive rocks with steep side slope, which act as runoff zone. These features are found in the south-western part of study area.
4.6 Pediment inselberg complex
Pediments, small erosional surfaces, with indivisual units are
not mappable. In Pediment Inselberg Complexes contributes limited to moderate recharge is reported.
4.7 Re sidual hills
These geomorphic features are isolated bodies seen in the
south western part of the study area and in this area have very poor recharge and limited prospect of ground water.
4.8 Plateau we athered
Weathered rocks being porous and permeable possess very
good storage and yield capacity of groundwater in hard rock
terrain. Study area is observed to contain moderate to shallow weathered rocks.
4.9 Valley fills
The valley fill constitute unconsolidated materials deposited
by nallas/river in narrow valleys and are found in the southern part of the study area in narrow patches.
4.10 Slope
Slope of an area is one of the controlling factors of groundwater recharge. It influences surface and subsurface flow of rain water and its recharge to the groundwater reservoir. Gentle slope of an area provides more time to infiltrate the rainwater to aquifer zone where as high slope allows lesser time resulting low infiltration to underlying groundwater reservoirs. The slope map of the study area has been prepared from ASTER DEM 30m. The slope of study area has been classified into seven classes as per the IMSD guidelines (NRSA, 1995). The area constitutes 0 to more than
35% slope. Most of the area falls into 0-1% i.e. nearly level and
1-3%. High slope is observed in the northern part, western part and southwestern part of the study area (Fig- 5)
4.11 Drainage pattern and drainage density
Drainage pattern depict history of the evolution of the earth
crust. The study area has been drawn drainage pattern with the help of Survey of India topographic map and updated from satellite data. The streams present in the study area have been ordered using Strahler’s system of stream ordering (Strahler 1957). The smallest initial tributaries are designated as 1st order and when two first order channels join, the channel segment formed is number 2nd order stream and so on. The highest order of stream found in the area is of 4 th order developed in and around Gola block. The study area has dendritic drainage pattern which is typical character of granitic terrain. The drainage density map reveals density value ranging from 0 to 6 km/km2. For analysis purposes they were regrouped into four category i.e. > 3 high, 3 – 2 medium,
2 – 1 low and 1 – 0 very low km/km2. Considering from
recharge point of view more weightage was assigned to very low drainage density regions where as low weightage assigned to very high drainage density (fig-6 and fig-7).
IJSER © 2012 http :// www.ijser.org
Inte rnatio nal Jo urnal o f Sc ie ntific & Eng inee ring Re se arc h Vo lume 3, Issue 3, Marc h -2012 5
ISS N 2229-5518
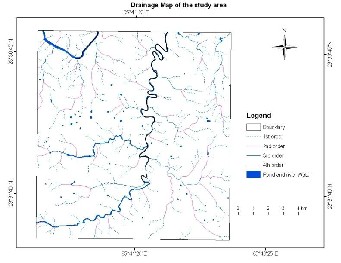
Fig 6 Drainage map of the study area

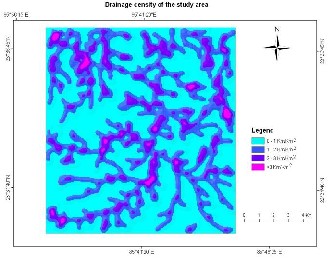
Fig 7 Drainage density Map of the study area
Table 3 weightage assigned of the features
Fig 5 Slope map of the study area
IJSER © 2012 http :// www.ijser.org
Inte rnatio nal Jo urnal o f Sc ie ntific & Eng inee ring Re se arc h Vo lume 3, Issue 3, Marc h -2012 6
ISS N 2229-5518
location of drinking water wells, irrigation tubewells and management of groundwater etc.
Acknowledgements
The authors are sincerely thankful to Dr. Uday Kumar, Head,
University Department of geology, Ranchi University, Ranchi, for providing all necessities in the department and for his guidance to produce the paper. Deep gratitude is expressed to Jharkhand Space Application Centre, Ranchi for permission to use the facilities available.
REFERENCES
Fig 8 Ground water Prospect map of the study area
5. RESULTS
Remote sensing and GIS have been used to integrate various
thematic maps viz., geological (Fig.2), geomorphological (Fig.3), drainage (Fig.6), lineament (Fig.2), slope map(Fig.5 ), which being very informative plays important role in the study of occurrence, quality and movement of groundwater in the area under consideration. The va rious thematic maps were assigned with different weightage of numerical value to derive groundwater potential area (Table.3). On the basis of weightage assigned and brought into the Raster calculation function of spatial analyst for integration. Groundwater Prospect map According to the flow chart prepared in the Table 1. the final map i.e., the composite map has been prepared to which has been named as groundwater prospect map (Fig.8). The map has been categorized into five zones namely poor to very good groundwater potential zones. Field check has been made through the yield data of dug wells and tube wells which satisfy the above analysis.
6. CONCLUSIONS
GIS approach has been used to integrate various thematic
maps which are very important to identify the groundwater occurrences and movements. The integrated groundwater prospect map has been categorized into five classes on the basis of the cumulative weightage to different features of the thematic maps. For more realistic evaluation field checked made with yield data of dug wells and tube wells. The deciphered map could be used for various purposes like
[1] Karanth, K. R., 1987, Ground water assessment, development and management, Tata McGraw-Hill publishing company Limited, New Delhi.
[2] Jaiswal, R.K., Mukherjee, S., Krishnamuthy, J. and Saxena, R. (2003)
Role of remote sensing and GIS techniques for generation of groundwater prospect zones towards rural development an approach. International Journal Remote Sensing, v.24 no.5, pp. 993-1008.
[3] Goyal, S., Bhardwaj, R.S. and Jugran, D.K.(1999) Multicriteria and
analysis using GIS for groundwater resource evaluation in Rawasen and Pilli watershed, U.P. (www. GIS development Net).
[4] Saraf, A.K. and Choudhary, P.R. (1998) Integrated Remote Sensing and GIS for groundwater exploration and identification of artificial recharge sites. Internal Journal Remote Sensing, v. 19, no. 10, pp, 1825 -
1841.
[5] Saraf, A.K., Sriniwasa Roy, Y. and Jugran, K,D. (2003), Deliniation of
groundwater potential zones of groundwater quality suitable for
domestic purposes using remote sensing and GIS. Hydro geological sci. Journal, v.48, no.5, pp. 821 -833.
[6] Teeuw, R.M. (1995), Groundwater exploration using remote sensing and a low-cost geographical information system. Hydrogeology Journal, v. 3, no.3, pp. 21 -30.
[7] Prasad, R.K., N.C. Mondal and Singh, V.S., Evaluation of Groundwater
Resource Potential Using GIS in Kurmapalli Watershed of Andhra
Pradesh. Journal Geological Society if India, v. 71, May 2008, pp.661 -
669.
[8] Mandevan, T.M., (2002), Geology of Bihar and Jharkhand, Gological
Society of India, Bangalore, pp.26.
Authors
1. Dr. Murari Prashad Sharma, Reader,(Retd), University Department of
Geology, Ranchi University, Ranchi-834008.
2. Anukaran Kujur, Registered for Ph.D. degree in University Department of Geology, Ranchi University, Ranchi. Presently working at CGWB, Govt. of India, NHR, Dharamshala (H.P.) as Assistant Hydrogeologist.
3. Dr. Udayan Sharma, Former Research Scholar, University Department of
Geology, Ranchi University Ranchi-834008.
IJSER © 2012 http :// www.ijser.org