
International Journal of Scientific & Engineering Research, Volume 5, Issue 4, April-2014 1038
ISSN 2229-5518
Hydrodynamic Simulation Behavior of Two Phase
Conical Fluidized Column
Abd Ali, K. M.* , Ghanim, A. N.**
Index Terms— Conical fluidized bed , Trapped bed , Static bed height, RSM, Model, ANOVA.
—————————— ——————————
luidization is the operation by which solid particles are behaves like a fluid through suspension in a liquid or gas. One of the most important features of fluidized beds is
their ability to mix and segregate. Fluidization is the preferred method of operation due to its many advantages over other configurations, like; good solid mixing leading to uniform temperature throughout the bed, high mass and heat transfer rates, easy solids handling, ability to maintain a uniform tem- perature, significantly lower pressure drops which reduce pumping costs, lower investments for the same feed and product specifications, yielding large axial dispersion of phas- es, etc, (Fan L. S. 1989)
In fluidization operation, fine solids are transformed into a
fluid like state through contact with either a gas, liquid or
both. Under the fluidized state, the gravitational pull on gran-
ular solid particles is offset by the fluid drag on them, thus the
particles remain in a semi-suspended condition. At the critical value of fluid velocity the upward drag forces exerted by the fluid on the solid particles become exactly equal the down- ward gravitational forces, causing the particles to become sus- pended within the fluid. At this critical value, the bed is said to be fluidized and exhibit fluidic behavior (Shailendra, 2010). Gas-solid fluidized bed reactors have found a wide range of industrial applications The use of fluidized beds make possi- ble to obtain a great homogeneity of distribution of the solid phase and a great effectiveness of mass and heat exchanges. In fact, the division of the solid allows having a great surface available for the exchanges and particles agitation accelerates
————————————————
* Abd Ali, K. M., PhD, is currently Asst. Professor in Electrochemical Engineering Department, Engineering College, Babylon University, Hilla 51002, PO box 4, Iraq, E-mail: alassade_67@yahoo.com
** Ghanim, A. N. , Corresponding Author, is currently Asst. Professor
in Electrochemical Engineering Department, Engineering College,
Babylon University, Hilla 51002, PO box 4, Iraq, E-mail:
ala_gh2003@yahoo.com
the transfer processes(Davidson et al, 1985).
Conical fluidized bed is very much useful for the fluidiza- tion of wide distribution of particles, since the cross sectional area is enlarged along the bed height from the bottom to the top, therefore the velocity of the fluidizing medium is relative- ly high at the bottom, ensuring fluidization of the large parti- cles and relatively low at the top, preventing entrainment of the small particles. Since the velocity of fluidizing medium at the bottom is fairly high, this gives rise to low particle concen- tration, thus resulting in low reaction rate and reduced rate of heat release. Therefore the generation of high temperature zone near the distributor can be prevented (Biswal K. C. et al.
2010). Due to the existence of a gas velocity gradient along the height of a conical bed, it has some favorable special hydrody- namic characteristics. The conical bed has been widely applied in many industrial processes such as, biological treatment of wastewater, immobilization biofilm reaction, incineration of waste-materials, fluidization of cohesive powder, coating of nuclear fuel particles, crystallization, roasting of sulphide ores, coal gasification and liquefaction, etc (Rachadaporn et al. 2006) (see Fig.1).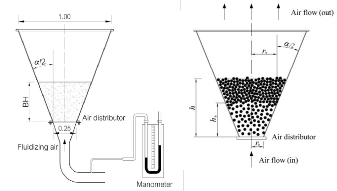
Fig. 1 Schematic of the conical bed with solid particles fluidized by air flow for partially fluidized bed mode. (Rachadaporn et al. 2006).
IJSER © 2014 http://www.ijser.org
International Journal of Scientific & Engineering Research, Volume 5, Issue 4, April-2014 1039
ISSN 2229-5518
The main objective of present work is to apply the response surface methodology (RSM) to accomplish relationships be- tween pressure drop and variables such as velocity, particle size and porosity using Minitab software (version 15) and to model conical fluidized bed behavior, as well examine the validity of model results due to literuture experimental data (Biswal K. C. et al. 2010).
Response surface methodology is a collection of mathemat- ical and statistical techniques useful for the modeling and analysis of problems in which a response of interest is influ- enced by several variables and the objective is to optimize this response (Montgomery, 2005; Khuri and Mukhopadhyay,
2010), the present RSM procedure was carried out as follows:
1) A series of 39 experiments were designed of reliable meas- urement for conical fluidized bed with packing of glass beads.
2) Mathematical model of the second-order response surface were developed.
3) The set of experimental factor variables producing the op-
timal response value were determined.
A quadratic regression model was employed for predicting
the optimum conditions. Each response of Y can be represent-
ed by a mathematical equation that correlates the response
surface. The response (Y) can be expressed as polynomial model (Montgomery, 2005;Khuri and Mukhopadhyay, 2010) according to Eq. (1): ![]() (1) Where Y is the predicted response used as a dependent varia- ble k is the number of independent factors, xi (i = 1, 2) the con- trolling factors; β0 the constant coefficient, and βi , βij and βii the coefficients of linear, interaction and quadratic term, re- spectively.
(1) Where Y is the predicted response used as a dependent varia- ble k is the number of independent factors, xi (i = 1, 2) the con- trolling factors; β0 the constant coefficient, and βi , βij and βii the coefficients of linear, interaction and quadratic term, re- spectively.
Analysis of variance (ANOVA) was used for graphical analysis of data to obtain the interaction between factors and response. The quality of the fit polynomial model was ex- pressed by the regression coefficients R2,and its statistical sig- nificance was checked by the Fisher's F-test (Montgomery,
2005). Model terms were evaluated by the p- value (probabil- ity) with 95% confidence level. The coefficient parameters were estimated using response surface regression analysis employing the Minitab software version 15, also used to find the residuals, 3D surface and 2D contour plots of the response models.
The present work is concentrated on an understanding the complex hydrodynamics of two phase fluidized bed. Fluid- ized bed of height 1.88 m and diameter 0.1 m (Moharana and Malik, 2010) have been simulated. The solid phase used is glass beads of size 2.18 mm in the present work. Co-current gas-solid fluidization with gas as continuous phase has been used. The static bed heights of the solid phase in the fluidized bed used for simulation are taken as 21.3 cm. Initial solid hold up has been taken as 0.59 in all cases with superficial velocity of gas varying in the range of 0.025-0.1 m/sec. Table (1) show
the properties of simulated model.
The experimental data were adjusted be means of a regres- sion method in order to describe the presser drop as a poly- nomial function of air flow , particle size , and porosity.
Fig. 2 shows the interaction effect of fluidization with air velocity, particle size, and porosity of glass bead particles on pressure drop of bed. Interactions plot creates a single interac- tion plot for three factors. An interactions plot is a plot of means for each level of a factor with the level of a second fac- tor held constant. Interaction is present when the response at a factor level depends upon the levels of other factors. The greater the departure of the lines from the parallel state, the higher the degree of interaction. Consequently, the interaction effect of the above mentioned three factors on pressure drop shows that there are significant interactions between factors on the response as confirm with response equation.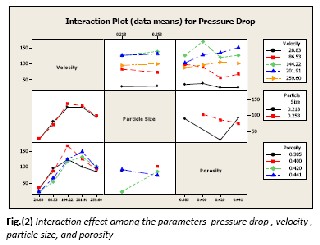
The relationship among the three factor variables and the pressure drop response for fluidization process was analyzed using response surface methodology (RSM). The Multilevel Factorial Design (MFD) shown in Table (2) allowed the devel- opment of mathematical equation where predicted response Y was assessed as a function of velocity, particle size and porosi- ty with number of levels taken to be 5, 2, and 4, respectively.
This study involves 39 runs of experiment response. The
IJSER © 2014 http://www.ijser.org
International Journal of Scientific & Engineering Research, Volume 5, Issue 4, April-2014 1040
ISSN 2229-5518
MFD reduces the number of experimental trials, however 23 runs were performed and all experimental results were treated and interpreted by statistical analysis.
* Biswal K.C. et al. 2010
Partial least squares PLS fits multiple response variables in a single model. Because PLS model the response in a multivar- iate way, the results may differ significantly from those calcu- lated for the response individually. Observed responses were utilized to conduct models using response surface methodolo- gy (RSM) (Montgomery, 2005). To develop a response surface regression model, a general polynomial model (Eq. 6) was applied to experimental observations of the pressure drop response (Y), and quadratic regression models were obtained. The predicted regression equation is:![]()
Where: ν is velocity factor, Dp is particle size factor , and ϵ is porosity factor.The accuracy of equation with R2 equal 0.888.
The results obtained were then analyzed by ANOVA as shown in table (3), to assess the "goodness of fit". The ANOVA analyzed has been tested for full quadratic equation designed value and gives an insight into the linear, quadratic and inter- action effects of the factors. The p-value is used as a tool to check the significance of each factor. It was found that the fac-
tors with major effect on pressure drop were the linear effect of particle size of packing and its porosity having p-values of
0.000, followed by velocity of gas phase and porosity quadrat- ic factors having p-values 0.004 and 0.016, respectively, and latest the particle size against porosity interaction factor, with p-value of 0.0972.
Analysis of variance results of quadratic models presented in Table (3) indicated the reduced quadratic models statistical parameters of degree of freedom DF, sum of squares SS due to regression and residual error, mean sum of squares MSS due to regression and residual error, value of Fisher's test, and re- gression p-value.
The p-values of ANOVA Table (3), indicates that the rela- tionship between responses and factors is statistically signifi- cant at a level of α =0.05 (maximum acceptable level of risk for rejecting a true null hypothesis, Montgomery, 2005).
The response surface model were developed in this study with values of R2 higher than 88%. It is usually necessary to check the fitted model to ensure it provides an adequate ap- proximation to the real system. The R2 coefficient gives the proportion of the total variation in the response predicated by the model, indicating ratio of sum of squares due to regression (SSR) to total sum of squares (SST) (Dean and Voss, 1999; Montgomery, 2005).
Graphical method usually used to validate models, and al- so characterizes the nature of residuals of the model. A resid- ual is defined as the difference between an observed value Y and its fitted Ŷ (Montgomery, 2005). In the normal probability plot, this was used to check the normality distribution of the residuals as shown in Figure(3).
The error distribution may be slightly skewed, with the right and left tails. Usually, the normal probability plot has a
IJSER © 2014 http://www.ijser.org
International Journal of Scientific & Engineering Research, Volume 5, Issue 4, April-2014 1041
ISSN 2229-5518
tendency to bend up or down slightly on the left or right sides implies that the error distribution is somewhat thinner than would be anticipated in a normal distribution (Montgomery,
2005); that is, the negative residuals are not quite as large (in absolute value) as expected.
If the model is correct and if the assumptions are satisfied, the residuals should be structureless; they should be unrelated to any other variable including the predicted response. A sim- ple check is to plot the residuals versus the fitted values Ŷ (Montgomery, 2005); Accordingly, Figure (4) plot not reveal any obvious pattern.
Fig.5 shows the optimal design(a group of the best design points selected when reducing or augmenting the number of experimental runs in the original design). By taking the num- ber of components cross-validated equal to 8, the D-optimality minimizes the variance in the regression coefficients of the fitted design model, thereby providing the most precise esti- mate of the effects.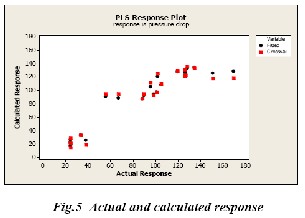
The predicted pressure drop corresponding to experimental values for glass bead particles of size within 0.00218–0.00258 m, for different static bed heights was acceptable.
However, the computational and experimental values were in rather good agreement (within 15% relative error) for 5.6–10 cm static bed heights, regardless of the cone angle. For operat- ing conditions applied in the tests with these particle size range, the predictedumf as shown in Figure (5) were found to be lower than corresponding experimental values.
The result indicates that the linear and quadratic factors were significant in determining the response value of pressure drop along static head for the fully fluidization mode and also significant in the statistical analyses.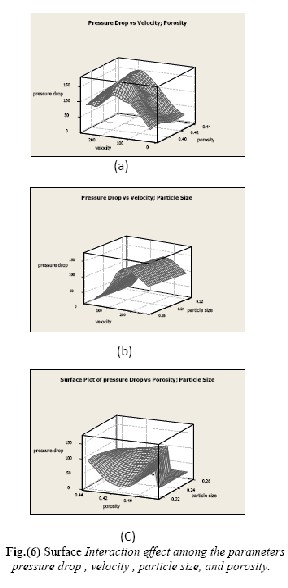
Moreover, the analysis implies that the model were defi- nitely influenced by the three factors.The response surface and contour plots are the graphical representation of the regres- sion equation used to visualize the relationship between the response and experimental levels of each factor.
The response surface plots can be observed in Figure (6)
that shows 3D response surface plots for the three variable
factors and all curves showing very noticeable changes. The resulted data of conical fluidized bed Δpmff /l was represented by irregular surface with highest plate zone approaches center
of plate for the cases of (6a) and (6b).
This trend was clearly viewed for pressure drop as a func-
tion of air velocity and porosity factors as well as air velocity
IJSER © 2014 http://www.ijser.org
International Journal of Scientific & Engineering Research, Volume 5, Issue 4, April-2014 1042
ISSN 2229-5518
and particle size. In contrast, an explicit observation of pres- sure drop is shown in (6c), implying that the optimum condi- tions for the predicted Δpmff /l against corresponding experi- mental values for glass bead particles of medium size, 218–
258 μm, for different static bed heights and 10.37o cone angles.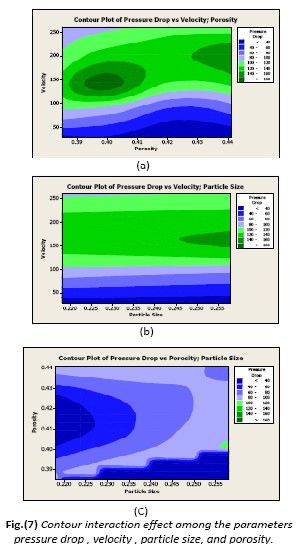
Contour plots of pressure drop are shown in Figures (7a), (7b), and (7c) with 2D. In a contour plot, the values for three factor variables for a response variable is represented by ho- mogeneous shaded zones, called contours. These plots present the overall distribution of pressure drop along the length of the bed . As shown, increased pressure drop was observed with increasing velocity until minimum fluidization condition take place and then will be decreasing when the bed will be spouted.
Response Surface Methodology (RSM)was used to study the hydrodynamics of gas-solid fluidized bed. Response Sur- face Methodology (RSM) was successfully applied for predict- ing the fluidization characteristics, the minimum fluidization velocity as well as the dependence of the pressure drop over
the bed on the superficial air of the bed for conical air –glass beads fluidized bed. The effects of operating variables (veloci- ty, particle size and porosity) on pressure drop were found to be significant. The model have been validated by comparison of the predicted results with experimental data for specific range of the above operating conditions.
The authors wish to thank Electrochemical Eng. Dept.. of
Babylon Univ. for supporting and approving this research.
[1] Fan L. S. (1989), Gas–Liquid–Solid Fluidization Engineering, Butterworth-Heinemann, Boston,
[2] Shailendra K. P, 2010, CFD simulation of Hydrodynamics of three phase Fluidized Bed. MSc. Thesis, national institute of technology India.
[3] Davidson, J. F., Clift R., Harrison D., 1985, Gas Jets in Fluidized
Bed: Fluidization. 2nd ed., Academic Press, London, 133–172.
[4] Biswal K.C , Moharana Y .Ch., and Malik M. K. (2010) “Fluid- ization In Conical Bed And Computational Fluid Dynamics Mod- eling of the Bed”, National Institute of Tech., India.
[5] Rachadaporn K. and Kuprianov V. I., Modeling and Experi- mental Study on Fluidization Characteristics of an Air-sand Bed in a Conical Fluidized-bed Combustor, The 2nd Joint Internation- al Conference on “Sustainable Energy and Environment (SEE2006)” 21-23 November 2006, Bangkok, Thailand
[6] Montgomery D. C., (2005), Design and Analysis of Experi- ments, 6th ed. New York: John Wiley & Sons, Inc.
[7] Khuri A. and Mukhopadhyay S. (2010) "Responsesurface methodology" ,WIREs Computational Statistics Volume 2, March/April.
[8] Dean A. and Voss D. (1999), Design and Analysis of Ex- periments, Springer-Verlag, New York Inc.
[9] Cui, H., & Grace, J. R. (2007), Fluidization of Biomass Particles: A Review of Experimental Multiphase Flow Aspects. Chemical Engineering Science, 62(1-2), 45-55.
[10] Demirbas, A. (2002), An Overview of Biomass Pyrolysis, En- ergy Source, 24, 471-482.
[11] Deza, M. (2012), Modeling the Hydrodynamics of a Biomass
Fluidized Bed. PhD Dissertation, Virginia Tech, Blacksburg, VA. [12] Ding, J., Gidaspow, D., 1990, A bubbling fluidization model
using kinetic theory of granular flow,AIChE J. 36(4) 523-538.
[13] Gidaspow, D. (1994). Multiphase Flow and Fluidization: Con- tinuum and Kinetic Theory Descriptions, Boston, USA: Academic Press.
[14] Bridgewater, A. V., Meier, D., & Radlein, D. (1999). An
Overview of Fast Pyrolysis of Biomass. Organic Geochemistry,
30, 1479-1493.
IJSER © 2014 http://www.ijser.org