International Journal of Scientific & Engineering Research, Volume 6, Issue 2, February-2015 1302
ISSN 2229-5518
Heavy Metal Characteristics of Soils at the Damang-Abosso Mining Areas of Western Region, Ghana.
Napoleon Jackson Mensah, Francis Ayiah-Mensah and Godfred Etsey Sebiawu
Abstract: This study analyzed the geochemical effect of mining activities on the quality of soils of selected mining areas of Western region in Ghana. In all nine heavy metals ( Zn, Pb, Cd, As, Se, Ni, Ag, Co and Cr concentrations were evaluated in eleven Soil samples using Atomic Absorption Spectrophotometer. The results of the present study revealed that all the heavy metals except Cadmium in the soil samples had concentration within the recommended regulatory limits. Generally, Cd concentration in the samples was higher than the recommended limits. It is envisaged that the results of this study would form the basis for further investigations into the effects of mining activities on the environment and eventual health implications of people.
Index Terms:. Mine waste, tailing, heavy metals, non-degradable, soil.
—————————— ——————————
1 INTRODUCTION
Mining and industrial processing are among the main sources of heavy metals contamination in the environment. Heavy metals may accumulate to toxic level which can cause a poten- tial risk to human health. Mines generate large volumes of waste including waste rock, slag, topsoil, overburden, tailing and all other associated materials that must be removed to access the mineral resource during extraction from the ore [1]. Mining tailing include waste generated during the extraction, beneficiation, and processing of minerals. One major problem of the mine is the handling and relocation of the large quanti- ties of the resultant mine tailing. Mine tailings contains high concen-trations of heavy metals that are toxic and carcinogenic like Pb, Cu, As, Cd, Cr, Zn, Ni, and Hg [2], [3]. Heavy metals may be released from the mine tailing to the ground and sur- face water systems, as well as the geological environment due to their solubility and mobility.
————————————————
• Napoleon Jackson Mensah is a lecturer at the Department of Science La- boratory Technology. Wa Polytechnic, Wa, Ghana.
E-mail: jacksonnapoleon@yahoo.com.
• Francis Ayiah-Mensah is lecturer at the Department of Mathematics and
Statistics.Takoradi Polytechnic, Ghana. E-mail: atofrans@yahoo.com
• Godfred Etsey Sebiawu is a lecturer at the Department of Dispensing
Technology, Wa Polytechnic, Wa, Ghana.E-mail: etseygodfred@yahoo.com.
In view of the non-degradable nature of these metals, they maintain their persistency in the environment for a long time and therefore pose a serious problem to public health threat through their by existence in atmosphere and drinking water [2], [3], [4]. Moreover, the presence of excessive heavy metals in food, water, soil and in air have been implicated as poten- tial environment contaminants leading to various human problem [5], [6], [7].
Pollution by heavy metals (Cd, Pb, etc.) affects not only the productivity of crops, but also the quality of the atmos-phere as well as water bodies and threatens the health and life of animals and human beings by way of the food chain. Many scientific studies have implicated heavy metals in the cause of dermatological diseases, skin cancer and internal cancers (liv- er, kidney, lung and bladder), cardiovascular disease, diabe- tes, and anaemia, as well as reproductive, developmental, immunological and neurological disorder in the human body [8], [9], [10], [11], [12], [13]. Heavy metal pollution occurs when such metals as arsenic, cobalt, copper, cadmium, lead, silver and zinc contained in excavated rock or exposed in an underground mine come in contact with water. The major en- vironmental impacts from waste disposal at mine sites are the
loss of productive land following its conversion to a waste
IJSER © 2015 http://www.ijser.org
International Journal of Scientific & Engineering Research, Volume 6, Issue 2, February-2015 1303
ISSN 2229-5518
storage area, and the introduction of sediment, acidity, and other contaminates into surrounding surface and groundwater from water running over exposed problematic or chemically reactive wastes [14].
The purpose of this research was to determination level con- tamination of the soil by heavy metals caused by dis-posal of mines waste at the Damang–Abosso areas of Western-region.
2. STUDY LOCATION
Damang-Abosso is located in Prestea-Huni Valley District which is about 33 Kilometers east of Tarkwa, the Prestea- Hu- ni Valley District is a mining District which lies within the South Western Equatorial Zone and covers an area of about
1376 sqkm. According to the 2010 Population and Housing Census, the Prestea-Huni Valley District has a total population of 159,304 people. Out of this, 50.5% are males and 49.5 % fe- male. Also, out of the total number about 63% of our people live in rural areas. The district has 4 major mining companies, Abosso Goldfields Ltd, Golden Star Resource, New Century Mines and Prestea Sankofa Gold Ltd.
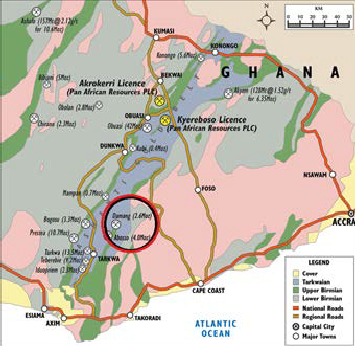
Fig.1. Map of Southern Ghana indicating Damang-Abosso mine area.
3. METHODS AND MATERIALS
3.1. SAMPLING
Eleven soil samples were taken from different locations within the Damang-Abosso mining areas for analysis.
3.2. DIGESTION OF SOIL SAMPLES
A known of each sample (1g) was weighed and placed into
500 ml beaker followed by the addition of 10ml of di – acid mixture of HNO3 and HClO4 according to the ratio 9: 4 before a though mixing of the contents by swirling [15], [16].The flask with its contents was then placed on a hot plate in the fume chamber and heated, starting at 850C and then temperature raised to 1500C. Heating was continued until the production of red NO2 fumes ceased. The contents were further heated until volume was reduced to 3– 4 ml and became colourless or yel- lowish, but not dried. This was done to reduce interference by organic matter and to convert metal associated particulate to a form (the free metal) that could be determined by the Atomic Absorption Spectrophotometer (AAS model 220). Contents were cooled and volume made up with distilled water and filtered through Whatman 1 acid-washed filter paper. The re- sulting solution was preserved at 40C, used for Spectrophoto- metric determination of the various metals.
3.3 ATOMIC ABSORPTION SPECTROPHOTOMETRY ANALYSIS.
AAS 220 model was used in determining the content of heavy metals in the previously digested tobacco samples. The acety- lene gas and compressor were fixed and com-pressor turned on and the liquid trap blown to rid of any liquid trapped. The Extractor and the AAS 220 power were turned on. The capil- lary tube and nebulizer block were cleaned with cleansing wire and opening of the burner cleaned with an alignment card. The worksheet of the AAS software on the attached computer was opened and the hollow cathode lamp inserted in the lamp holder. The lamp was turned on; ray from cathode aligned to hit target area of the alignment card for optimal
light throughput, then the machine was ignited. The capillary
IJSER © 2015 http://www.ijser.org
International Journal of Scientific & Engineering Research, Volume 6, Issue 2, February-2015 1304
ISSN 2229-5518
was placed in a 10 ml graduated cylinder containing deion- ized water and aspiration rate measured, and set to 6 ml per minute. The analytical blank was prepared, and a series of calibration solutions of known amounts of analyte element (standards) were made. The blank and standards were atom- ized in turn and their responses measured. A calibration graph was plotted for each of the solutions, after which the sample solutions were atomized and measured. The various metal concentrations from the sample solution were determined from the calibration, based on the absorbance obtained for the unknown (AOAC, 2006).
4.0 RESULTS AND DISCUSSION
Heavy metals occur naturally in the soil environment from the pedogenetic processes of weathering of parent materials at levels that are regarded as trace when less than 1000mg kg-1 and rarely toxic when in abundance [18], [19]. Mining and smelting have resulted in contamination of soil that poses risk to human and ecological health.
Zinc: Zinc is one of the essential elements for plants, mi- croorganisms, animals, and humans. Exposure to high con- centration of Zinc over long period of time may cause ad-verse health effect. However, Zinc is an essential nutrient needed for the growth of the body, bone, metabolism and wound healing. Therefore deficiency of Zinc can be detri-mental to the body. The concentration of Zinc (mg/kg) as shown in Table.1 below and range from 7.0 mg kg-1 to 15.0 mg kg-1 with an average of
11.45 mgkg-1.The concen-tration of Zinc in the soil is far less than the recommended regulatory permissible limits of 20.0 mg kg-1 to 200.0 mg kg-1 as provided in Table 2.
Typical Cd and Zn contents of uncontaminated soils are less
than 0.5 mgkg-1 and 10-80mgkg-1 [20]. Anthropogenic activity, such as mining activities, application of sewage sludge, indus- trial waste disposal and agricultural activity (fertilizers, pesti- cides) leads to local elevated Zn and Cd concentration in soils. Lead: Lead is very toxic and can cause serious injury to the brain, nervous system, red blood cells, and kidneys [21]. Expo- sure to lead can result in a wide range of biological effects de-
pending on the level and duration of exposure. The risk of
lead poisoning through the food chain increases as the soil lead level rises above this concentration. The concen-tration of lead (mg/kg) as shown in Table 1 below and range from
2.0mgkg1 to 23.0mgkg-1 with an average of 9.55mgkg-1.The
concentration of Lead in the soil is within the recommended regulatory permissible limits of 10.0mg kg-1 to 30.0mg kg-1 as provided in Table 2.
Research shows that levels of lead in the blood began to de-
cline earlier in the western European and Scandinavian coun- tries than in Eastern Europe, largely because unleaded petrol was gradually introduced earlier in these countries [22]. Cadmium: Cadmium is toxic and chronic exposure can led to kidney dysfunction. Food intake and tobacco smoking are the main routes by which Cadmium enters the body [23]. The concentration of Cadmium (mg/kg) as shown in Table 1 be- low and range from 1.6mgkg-1 to 6.0 mg kg-1 with an average of 2.91mgkg-1.The concentration of Cadmium in the soil is far above the recommended regulatory permissible limits of 1.0 mgkg-1 as provided in Table 2.
In soil, the chemistry of cadmium is largely controlled by pH. Cadmium mobility and bioavailability are higher in more acidic soils, and lower in chalky/lime soils [24].
One way to reduce cadmium bioavailability is to lime the soil to make it less acidic. Research show levels of cadmium in smokers were six times those of non-smokers, a far more sig- nificant difference.
Arsenic: Arsenic exposure can cause skin damage, increased
risk of cancer, and problems with circulatory system [25].The concentration of Arsenic (mg/kg) as shown in Table 1 below and range from 0.9mg kg-1 to 5.4mgkg-1 with an average of
1.93mgkg-1. The concentration of Arsenic in the soil is within the recommended regulatory permissible limits of 0.1 mgkg-1 to 10.0mgkg-1 as provided in Table 2.
Arsenicosis or arsenism is caused by prolonged exposure to low, non-lethal doses of arsenic, in the range of 0.005 to 0.09 milligrams per kilogram (mg/kg) of body weight per day [26]. The long list of other long term exposure effects includes pe-
ripheral neuropathy, gastrointestinal symptoms, conjunc-
IJSER © 2015 http://www.ijser.org
International Journal of Scientific & Engineering Research, Volume 6, Issue 2, February-2015 1305
ISSN 2229-5518
tivitis, diabetes, renal damage, an enlarged liver, bone mar- row depression, destruction of red blood cells, high blood pressure and cardiovascular disease. In Cornwall, Phillip et al (1984) [27] found evidence of a cluster of malignant melano- mas (skin cancers) among communities where local arsenic concentrations exceeded 30g/kg of soil.
Selenium: Selenium chronic exposure may result in im-proper functioning of endocrine, particularly on the synthesis of thy- roid hormones [28].The concentration of Selenium (mg/kg) as shown in Table 1. Below and range from 0.91mgkg-1 to
0.6mgkg-1 with an average of 0.33mgkg-1. The concentration of Selenium in the soil is within the recom-mended regulatory permissible limits of 0.1mg kg-1 to 2.0mgkg-1 as provided in Table 2.
High dietary intakes of selenium have been identified in parts of Venezuela, China and South Dakota, USA [24]. Symptoms in people with high urinary selenium levels in-cluded gastro- intestinal disturbances, discoloration of the skin and decayed teeth [24].
Nickel: Nickel at the right trace amount, is an essential miner- al for human nutrition but it can be dangerous when the max- imum tolerable amounts are exceeded. Nickel dermatitis is the most common effect in humans from chronic skin contact with nickel. Respiratory effects have also been researched in hu- mans from inhalation exposure to nickel. The concentration of Nickel (mg/kg) as shown in Table 1 below and range from 0.2 mg kg-1 to 0.68mgkg-1 with an average of 0.45 mg kg-1. The concentration of Nickel in the soil is far less than the recom- mended regulatory permissible limits as provided in Table 2.
A few studies have shown that small amount of nickel is probably essential to maintain proper health. The U.S En- vironmental Protection Agency recommends that children drink water containing not more than 0.04mg of nickel per litre of water for 1-10 days of exposure.
Workers whole inhaled very large amount of dust con-taining nickel compounds have lung and nassal sinus cancer. The ef- fects of nickel exposure may depend on the type of exposure,
concentration of the substance and the duration of exposure.
Silver: The concentration of Silver (mg/kg) as shown in Table
1 below and range from 0.1mgkg-1 to 0.6mgkg-1 with an aver- age of 0.30mgkg-1.
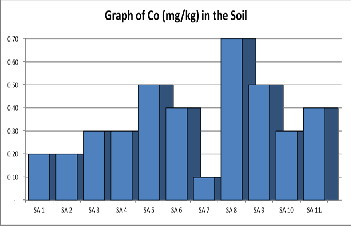
Cobalt: Cobalt is one of the essential elements for health but
can also be a disadvantage in excessively high levels. The con- centration of Cobalt (mg/kg) as shown in Table 1 below range from 0.1mgkg-1 to 0.70mgkg-1 with an average of 0.35mgkg-1. The concentration of Cobalt in the soil is far less than the rec- ommended regulatory permissible limits as provided in Table
2.
Chromium: Chronic Chromium exposure is associated with allergic dermatitis in humans [27].The concentration of Chro- mium (mg/kg) as shown in Table 1 below and range from
0.6mgkg-1 to 5.40mgkg-1 with an average of 2.83mgkg-1. The concentration of Chromium in the soil is far less than the rec- ommended regulatory limits as provided in Table 2.
5.0 CONCLUSION
It was realized from the research conducted that all the heavy metals contents measured satisfied the recommended permis- sible limit for soil exception of Cadmium which have its means far greater than the recommended permissible limits and this may be as result of high acidity content of the soil. It is envisaged that the results of this study will enrich the dis- cussion and understanding of the effects of mining activities on the environment as well as the health implications of peo- ple.
ACKNOWLEDGMENT
The The Authors would like to acknowledge the following institutions and individuals.
•AngloGold Ashanti Environmental Quality Laboratory for the Analysis of the heavy metals with AAS MODEL 220- OBUASI-GHANA.
•Faculty of Renewable and Natural Resources Envi-ronmental
Quality Laboratory for the digestion of the sam-ples-KNUST, Kumasi-Ghana.
IJSER © 2015 http://www.ijser.org
International Journal of Scientific & Engineering Research, Volume 6, Issue 2, February-2015 1306
ISSN 2229-5518
REFERENCES
[1] C. Roussel, H. Bril, & A. Fernandez.(2000). Heavy metals in the environment.
Arsenic speciation: involvement in evaluation of environmental impact caused by mine wastes. Journal of Environmental Quality, 29, 182-188.
[2] M. Nehdi, and A. Tariq.(2007) Stabilization of sulphidic mine tailings for prevention of metal release and acid drainage using cementations materials: a review. Journal of Environmental Engineering and Science, 6(4): 423-436
[3] J.S. Yanga, J.Y. Leea, K. Baekb, T.S. Kwonc, and J Choia.(2009) Extraction behavior of As, Pb, and Zn from mine tailings with acid and base solutions. Journal of Hazardous Materials, 171(1–3): 443–451
[4] L. Sartz, (2010) Alkaline by-products as amendments for re-mediation of historic mine sites. Örebro university, Örebro
[5] A.K. Salama, and M.A. Radwan.(2005) Heavy Metals (Cd, Pb) and Trace Elements (Cu, Zn) Contents in Some Foodstuffs from Egyptian Market. Emir. J. Agric. Sci. 17(1), pp. 34-42.
[6] E.J Itumoh, T. Izuagie, N.O Omaka, A. Uba, M. Shuaibu, I.A Dogonyaro, A.
Isah, A.U. Dange, and S.I. Isah,(2011) Trace Metals Analysis of Soil and Water Samples from a Limestone Mining Site in Sokoto State Nigeria. Journal of Physical Sciences and Innovation 3, pp. 62-71.
[7] [7]. A.K. Salama, and M.A. Radwan,(2005) Heavy Metals (Cd, Pb) and Trace
Elements (Cu, Zn) Contents in Some Foodstuffs from Egyptian Market. Emir. J. Agric. Sci. 17(1), pp. 34-42.
[8] P.G.C Campbell, P.B. Stokes and J.H. Galloway. (1983). Effects on atmospheric deposition on the geochemical cycling and biological availability of metals. In: Heavy Metals in the Environment, Proceedings of an International Confer- ence, Heidelberg. 2, 760-763. CEP Consultants, Edinburgh
[9] G. Zarazua, P. Ávila-Pérez, S. Tejeda, I. Barcelo-Quintal, I. and T. Mar-
tínez,(2006), Analysis of total and dissolved heavy metals in surface water of a Mexican polluted river by Total Reflection X-ray Fluorescence Spectrometry, Spectrochimica Acta Part B: Atomic Spectroscopy, 61, 1180-1184.
[10] T. Hoekman, (2008). Heavy metal toxicology. [www.ucs.mun.ca/~thoekman], (accessed 2014 July 14)
[11] R. Goyer.(1991). Toxic effects of metals. In: M.O Amdur, J.D. Doull and C.D.
Klassen, Eds. Casarett and Doull's Toxicology. 4th ed. Pergamon Press, New
York. pp.623-680.
[12] [12]. R. Young,(2005b). Toxicity profile of cadmium. [http://rais.ornl.gov/tox/profiles/cadmium. shtml], (accessed 2014 July 21).
[13] OMOE (Ontario Ministry of Environment).(2008). Cobalt in the environment. [http://www.ene.gov.on.ca/en/], (Accessed 2014 May 11).
[14] Agency of Toxic Substances and Disease Registry. Toxico-logical Profile for Cadmium. (1999). Available at http://www.atsdr.cdc.gov/toxprofiles/ tp5.html. Accessed May 1, 2014.
[15] [15]. J.R. Okalebo , K.W. Gathua , (1993) Laboratory methods of soil and plant
analysis. A working manual. Printed by Marvel E.P.Z(Kenya) Ltd. Nairobi
Kenya p88.
[16] A.L Page, R.H. Miller and D.R. Keeney, (1982). Methods of Soil Analysis. 2nd
Edn. American Society of Agronomy, Madison, WI., USA.
[17] Adriano D.C (2001). Trace Elements in Terrestrial Elements: Biogeochemistry, Bioavailability, and Risk of metals. 2nd Edition, Springer Verlag.
[18] A. Kabata-Pendias. (2000).Trace Elements in Soils and Plants. CRC Press Boca
Raton U.S.A.
[19] [19]. G.M. Pierzynski, J.T Sims and G.F. Vance(2000). Soils and Environmental
Quality, CRC Press, London, UK, 2nd edition.
[20] F. Scheffer, and P. Schachtschabel. (2002). Lehrbuchder Bodenkunde. 15.
Spektrum akademischer Verlag.
[21] D.R Baldwin and W. J. Marshall (1999) “Heavy metal poi-soning and its la- boratory investigation,” Annals of Clinical Biochemistry, vol. 36, no. 3, pp.
267–300.
[22] H.W. Mielke, & P.L. Reagan. (1998) Soil is an important pathway of human lead exposure. Environmental Health Perspectives. 106 (Suppl1): 217–229.
[23] S.E. Manahan (2003) Toxicological Chemistry and Bio-chemistry, CRC Press, Limited Liability Company (LLC), 3rd edition.
[24] Smith MJ, Westfall BB (1937) Further field studies on the selenium problem in relation to public health. United States Public Health Report, 52:1375–1384.
[25] M.A. Oliver (1997) Soil and human health: a review. European Journal of Soil
Science.48: 573-592
[26] A. Scragg (2006). Environmental Biotechnology, Oxford University Press, Oxford, UK, 2nd edition.
[27] M. Vinceti, E.T. Wei, C. Malagoli, M. Bergomi, G. Vi-voli.(2001). Adverse health effects of selenium in humans. Jul-Sep;16(4):233-51.
[28] D. Caussy, (ed) (2005) A field guide for detection, management and surveil- lance of arsenicosis cases. New Delhi: WHO. Available at: http://apps.searo.who.int/pds_docs/B0301.pdf
[29] R. Philipp, A.O. Hughes, M.C. Robertson, and T.F. Mitchell (1984) Soil
levels of arsenic and malignant melanoma incidence. In: Environmental Con- tamination, pp. 432–437. CEP Consultants, Edinburgh.S. M. Metev and V. P. Veiko, Laser Assisted Micro-technology, 2nd ed., R. M. Osgood, Jr., Ed. Berlin, Germany: Springer-Verlag, 1998.J.S. Bridle, “Probabilistic Interpretation of Feedforward Classification Network Outputs, with Relationships to Statistical Pattern Recognition,” Neurocomputing—Algorithms, Architectures and Applica- tions, F. Fogelman-Soulie and J. Herault, eds., NATO ASI Series F68, Berlin: Springer-Verlag, pp. 227-236, 1989. (Book style with paper title and editor)
IJSER © 2015 http://www.ijser.org
International Journal of Scientific & Engineering Research, Volume 6, Issue 2, February-2015 1307
ISSN 2229-5518
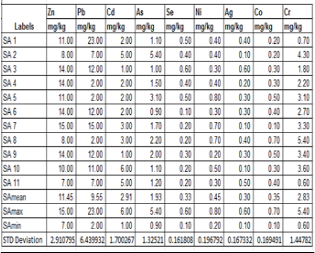
Table 1. Shows contents of Heavy Metals in various samples of Soil.
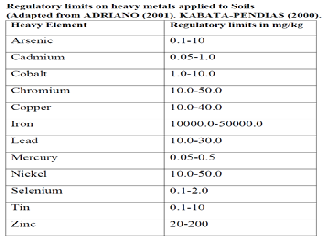
Table 2. Regulatory limits on heavy metals applied to Soils.
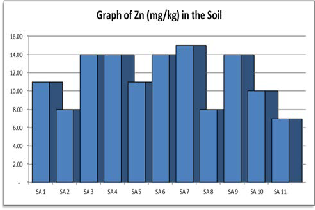
Figure 1. Shows a graph of Zinc contents in various samples of Soil.
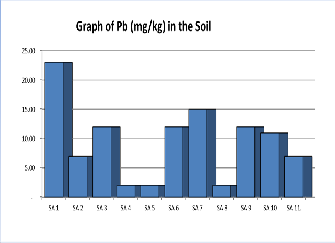
Figure 2. Shows a graph of Lead contents in various samples of Soil.
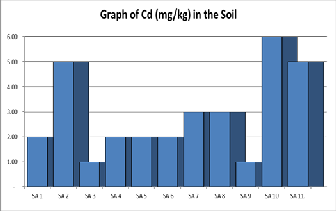
Figure 3. Shows a graph of Cadmium contents in various samples of
Soil.
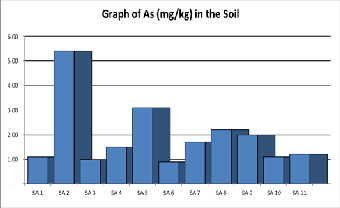
Figure 4. Shows a graph of arsenic contents in various samples of Soil.
IJSER © 2015 http://www.ijser.org
International Journal of Scientific & Engineering Research, Volume 6, Issue 2, February-2015 1308
ISSN 2229-5518
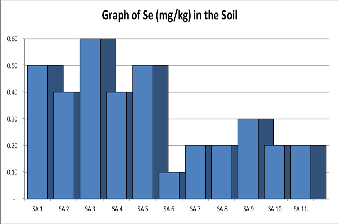
Figure 5. Shows a graph of Selenium contents in various samples of Soil.
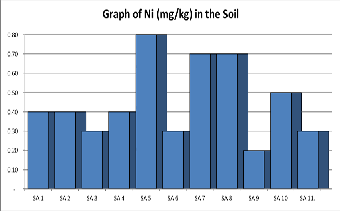
Figure 6. Shows a graph of Nickel contents in various samples of Soil.
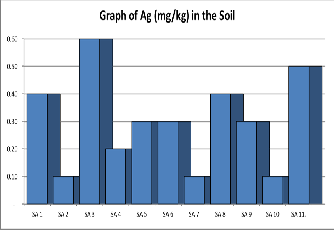
Figure 7. Shows a graph of Silver contents in various samples of Soil.
Figure 8. Shows a graph of Cobalt contents in various samples of Soil.
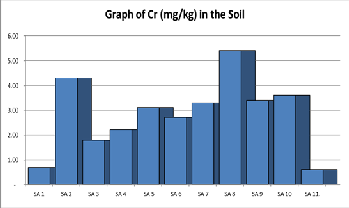
Figure 9. Shows a graph of Chromium contents in various samples of Soil.
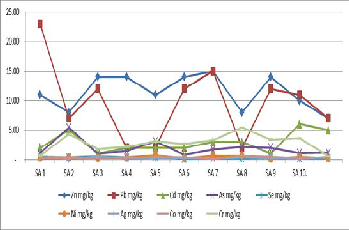
Figure 10. Shows a graph of heavy metals content in various samples of
Soil.
IJSER © 2015 http://www.ijser.org
International Journal of Scientific & Engineering Research, Volume 6, Issue 2, February-2015 1309
ISSN 2229-5518
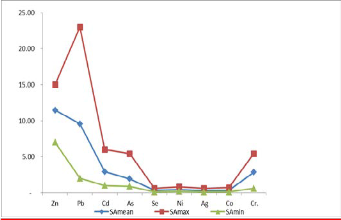
Figure 11. Shows a graph of mean, max and min of heavy metal contents in the Soil.
IJSER © 2015 http://www.ijser.org