International Journal of Scientific & Engineering Research Volume 2, Issue 7, July-2011 1
ISSN 2229-5518
Growth, Yield and Yield Components of American Cotton (Gossypium hirsutum L.) As Affected by Cultivars and Nitrogen Fertilizer
Hakoomat Ali and Raheel Atif Hameed
Abstract - Nitrogen stress in upland cotton addresses significant and visible shortfalls in plant growth. It is an important element both in nature and agricultural conditions, for cotton plant growth and development. To evaluate the response of different yield and yield component of high yielding upland cotton cultivars to various split applications of nitrogen fertilizer, a two season field research was conducted during 2007 and 2008. Different experimental treatments were comprised on cotton leaf curl virus (CLCV) resistant high yielding cotton cultivars i.e. CIM-496, CIM-506, CIM-534 along
with different nitrogen rate of Zero, 60, 110 and 160 kg ha-1. However, cultivar CIM-534 produced significantly the highest plants, nodes per plant and flowering buds plant-1. W hile, CIM-496 showed better potential in relation to leaf area index, crop growth rate, relative growth rate and net assimilation
rate (physiological), dry biomass and number of bolls m-2 (reproductive) and seed cotton, cotton seed (yield) parameters during both the seasons. On increasing N rates, vegetative characteristics of cotton like plant height, nodes plant-1 and number of flowering buds per plant significantly gave better response with each cultivar. Advanced cotton cultivars produced significantly higher total dry biomass (TDM), bolls m-2, seed cotton, cotton seed and
GOT % age on each increment in applied nitrogen. The nitrogen fertilizer rate i.e. 160 kg ha-1 proved to be the optimum for the highest cotton yield and yield components. Further fibre characteristics such as staple length, uniformity ratio and maturity ratio significantly influenced by different cultivars.
Index Terms: Cotton, Fibre characteristics, Growth, Nitrogen, Yield and Yield components
—————————— • ——————————
1 INTRODUCTION
O overcome the existed gap between production and consumption for rapidly growing human population,
crop management and soil fertility status are the most important factors. There is a dire need to minimize agricultural farm and potential yield differences. Cotton is an important fibre crop of the world that played a significant role in reduction of unemployment, financial stability improvement, national and international industrial development and is a big source of raw material for textile industries, spindles and oil expelling units all over the world [2]. A comprehensive research work conducted by scientists indicated that regulation of plant physiological, growth and development activities plays a key role in plant height, fruit producing buds and boll load in cotton that resulted ultimately in per unit area yield enhancement. Cotton crop yield and fibre quality is associated with advanced agronomic field techniques and judicious use of soil inputs [34]. Nitrogen application to cotton is considered to be essential to meet the basic requirements of nitrogen need at various important growth stages through out the growing season while, in excess may reduce lint percentage
————————————————
Author is an Associate Professor, E-mail: hha94@yahoo.com
(+923006323637)
Co-Author is a PhD Scholar, E-mail: rahb100@yahoo.com
Department of Agronomy,University College of Agriculture, Bahauddin
Zakariya University, Multan, Pakistan
[29], [36]. Deficiency of nitrogen can also slows down the vegetative and reproductive processes in plants that may leads to potential yield loss [20]. In most of the field cultivated crops, excess application of nitrogen causes more vegetative growth that delayed crop and fruit maturity and resulted in low final farm yield [23]. Judicious increased nitrogen to cotton may result in more accumulation of photosynthetic assimilates that resulted in higher fruit weight, soil minerals uptake [6]. Again nitrogen deficiency limits yield responsible for low yield that is associated with low fibre quality [33]. However, it was reported that an increment in nitrogen supply to cotton may improve fibre quality parameters while nitrogen application in excess may reduce fibre quality [21]. Further, findings of many researchers due to interactive impacts of soil, cultivar selection and weather conditions showed contradictory results regarding fibre quality trends [25]. In any cropping system, cultivar selection occupied a key space to obtain the required yield goals and is very important for cotton to get the maximum yield [3], [26], [41]. Various genotypes are the main source of influence on cotton fibre characteristics and environmental conditions and field adopted agronomic measures are considered as associated factors [4], [31], [40]. Fibre length, micronaire variation is attributed to cultivar selection and field management [24]. Data collected over twenty three years showed that introduction of new cultivars is responsible for higher staple length and
micronaire values [5], [7]. However, this study was
IJSER © 2011 http://www.ijser.org
International Journal of Scientific & Engineering Research Volume 2, Issue 7, July-2011 2
ISSN 2229-5518
designed to know the independent and interactive understanding of both the nitrogen and cultivars on cotton yield and yield components alongwith fibre quality parameters.
2 MATERIALS AND METHODS
Field experiments were conducted at The Central Cotton Research Institute, Multan, Pakistan and three cotton cultivars i.e. CIM-496, CIM-506, CIM-534 along with four different nitrogen fertilizer rates of 0, 60, 110 and 160 kg ha-1 during two seasons (2007 and 2008) on sandy loam soils. Cultivars were kept in main plots while nitrogen was applied in sub plots. Net plot size was maintained as 9 m x
3.3 m during both the years with bed and furrows 75 cm
apart and 23 cm plant to plant distance was maintained. A fine seed bed was prepared with cultivator and was properly shaped with a bed shaper. The soil chemical and physiological examination report is given in Table 1. The experiment was laid out in a randomized complete block design with split plot arrangements and was replicated in four repeats. The sowing of cotton seeds was done manually on 11 and 21st May during 2007 and 2008 respectively and thinning of plants was done after three weeks of dibbling the seed to maintain the required
distance between the plants. Whole the phosphatic fertilizer

TABLE 1 Soil chemical and physical analysis
Characteristics 2007 2008
Chemical analysis
O. matter (%) SAR
Soil pH
ECe (dS m-1) P (ppm)
K ( ppm ) Physical analysis
Sand (%) 15 16 15 16
Silt (%) 60 59 58 60
Clay (%) 26 24 25 26
Textural class Silt loam
Results taken at final harvest of crop clearly showed that plant height is directly proportional to the increasing rates of nitrogen applied at various crop growth stages (Table 2). Each increment in dose of fertilizer applied through soil significantly increased the plant heights of different cotton
(50 kg P2O5 ha -1) was applied at sowing in the form of
cultivars. The treatment 160 kg N ha-1
produced 54% and
Triple Super Phosphate. All other agronomic practices were kept same for all the treatments through out the crop growth. Seed cotton was picked in two pickings while the second picking was done after 180 days of crop plantation. Five healthy plant, free from disease and damage were selected from each plot of all the treatments and tagged to calculate the data through out the season. Plant samples were taken from 1m2 and oven dried at 80o C for measurement of plant biomass, leaf area index, crop growth rate, relative growth rate and net assimilation rate by methods suggested by [30]. Number of bolls was taken from 1m2 while seed cotton was collected from each plot and was converted on hectare basis after that 100 gram sample of seed cotton was also taken, air dried and ginned with ginner to calculate the GOT percentage.
The observed field data were analyzed by using “MSTAT” statistical techniques and least significant difference test was applied to check the significance of treatment means at 5% probability level [39].
3 RESULTS AND DISCUSSION
3.1 Plant height (cm)
Plant height is one of the main vegetative growth parameter of cotton plant that directly represents the
fertilizer effect especially nitrogen.
49% taller plants against control treatment respectively in
both the years. All the cultivars showed a significant potential at crop maturity. In the two successive years of crop growth significantly the highest plant heights (111.1 and 112.0 cm) were produced by the highest nitrogen rate i.e. 160 kg ha-1, however, amongst the cultivars, CIM-534 significantly produced the tallest plants (P<0.05) while the smallest plants achieved by CIM-506 [14], [19].
3.2 Number of nodes plant-1
Increase in number of plant nodes is associated with plant heights as plant heights increased number of main stem nodes increased and vice versa. The results showed that two years field research indicated that with increase in soil nitrogen fertilization number of nodes increased significantly and various cultivars have different potential to produce main stem nodes. It’s evident from the results that interactions between nitrogen and cultivars were found significant. However, our findings regarding number of nodes per plant showed cultivar CIM-506 along with zero nitrogen fertilizer treatment produced the smallest number against higher nitrogen rates. These results
are supported by other scientists [20].
IJSER © 2011 http://www.ijser.org
International Journal of Scientific & Engineering Research Volume 2, Issue 7, July-2011 3
ISSN 2229-5518
TABLE 2 Effect of nitrogen and cultivars on cotton plant height (cm)
TABLE 5 Effect of nitrogen and cultivars on dry biomass g m-2
Treatments | 2007 | 2008 |
kg N ha-1 | CIM 496 | CIM 506 | CIM 534 | Means | CIM 496 | CIM 506 | CIM 534 | Means |
0 60 110 160 Means | 531.7 542.2 508.2 527.4 663.2 679.5 629.2 657.3 774.3 782.5 758.6 771.8 886.5 936.3 851.5 891.4 713.9 735.1 686.9 | 537.3 551.5 515.2 534.7 668.3 687.1 635.1 663.5 783.1 792.3 768.5 781.3 906.4 925.6 881.6 904.5 723.8 739.1 700.1 |
SEs Cultivar Nitrogen C x N LSD (5%) Cultivar Nitrogen C x N | 3.03 3.29 6.01 8.95 9.81 17.87 | 3.11 3.38 6.17 9.32 10.05 18.41 |
TABLE 3 Effect of nitrogen and cultivars on number of nodes plant-1
TABLE 6 Effect of nitrogen and cultivars on number of bolls m-2
Treatments | 2007 | 2008 |
kg N ha-1 | CIM 496 | CIM 506 | CIM 534 | Means | CIM 496 | CIM 506 | CIM 534 | Means |
0 60 110 160 Means | 25.3 22.0 25.0 24.1 28.3 26.0 30.0 28.0 30.0 28.5 32.0 30.2 32.0 30.3 33.8 32.0 28.9 26.7 30.2 | 27.5 24.8 28.0 26.8 30.0 27.5 32.0 29.8 31.8 29.3 33.5 31.5 33.5 31.3 35.0 33.3 30.7 28.2 32.1 |
SEs Cultivar Nitrogen C x N LSD (5%) Cultivar Nitrogen C x N | 0.21 0.27 0.56 0.60 0.77 1.83 | 0.25 0.33 0.67 0.71 0.92 1.91 |
TABLE 4 Effect of nitrogen and cultivars on cotton flowering buds plant-1
TABLE 7 Effect of nitrogen and cultivars on seed cotton yield (kg ha-1)
Treatments | 2007 | 2008 |
kg N ha-1 | CIM 496 | CIM 506 | CIM 534 | Means | CIM 496 | CIM 506 | CIM 534 | Means |
0 60 110 160 Means | 15.0 13.0 14.3 14.1 23.8 20.5 21.3 21.9 25.3 22.3 23.8 23.8 27.0 24.0 25.3 25.4 22.8 20.0 21.2 | 15.5 12.5 13.0 13.7 24.3 21.5 22.3 22.7 26.5 23.5 24.5 24.8 27.8 25.3 26.0 26.4 23.5 20.7 21.5 |
SEs Cultivar Nitrogen C x N LSD (5%) Cultivar Nitrogen C x N | 0.37 0.44 0.51 1.01 1.48 1.61 | 0.28 0.42 0.62 0.84 1.43 1.75 |
IJSER © 2011 http://www.ijser.org
International Journal of Scientific & Engineering Research Volume 2, Issue 7, July-2011 4
ISSN 2229-5518
3.3 Flowering buds plant-1
Data presented in Table 4 showed that number of flowering buds produced palnt-1 was significantly affected by the increasing rates of nitrogen against zero nitrogen application. The observations taken uptil 90 days after crop sowing of the season indicated that significantly (P<0.05) highest number of flowering buds i.e. 25.4 and 26.4 were obtained where nitrogen was applied in the soil at the rate of 160 kg ha-1 during both the years respectively. However, the lowest numbers were produced with the control treatment. The cultivar CIM-496 significantly produced the highest number of flowering buds per plant while the lowest number was achieved with CIM-506 during both the seasons’ uptil 90 days of crop sowing. There after, then flowering buds started to convert in fruits and thus, their count decreased up to the crop maturity [29], [36].
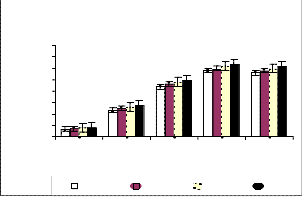
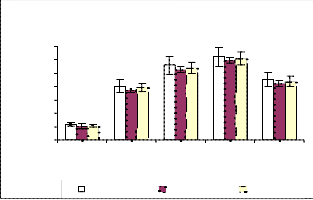
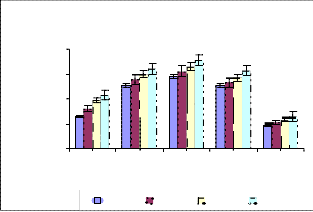
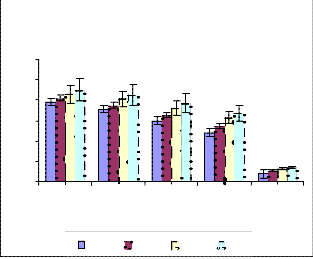
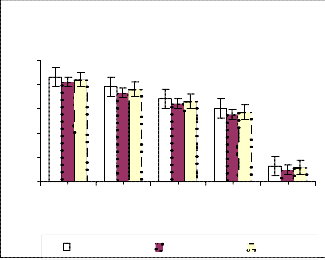
3.4 Leaf area index (LAI)
Leaf area index not only influenced by the nitrogen fertilizer application but also varied with different cultivars. The application of nutrients at various crop growth stages catalyzed many plant physiological processes. Thus leaf area index (LAI) was altered significantly by all the applied increasing rates of nitrogen. Here results indicated that through out the plant growth significantly the highest LAI was produced with 160 kg N ha-1 treatment against zero nitrogen treatment through out the crop growth. Similarly, cultivar CIM-496 produced significantly the highest LAI against CIM-506 in both the crop growing seasons. It is obvious from the Table 5 that leaf area index increased maximum uptil 90 days after crop sowing (DAS). With the commencement of reproductive growth, LAI started to decrease uptil the crop maturity. Thus, all the cultivars achieved their maximum canopy growth uptil 90DAS. Similar findings have also been achieved by other scientists [35], [38].
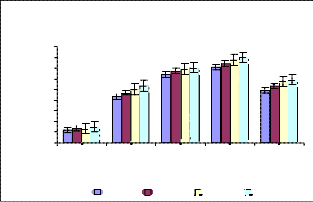
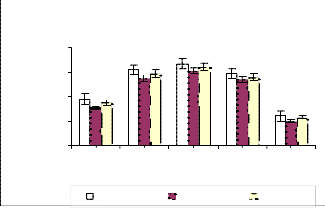
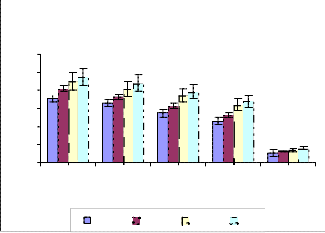
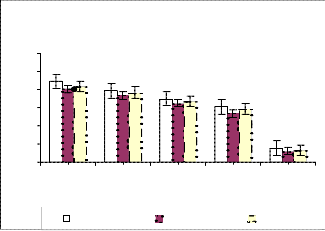
3.5 Crop growth rate (gm-2d-1)
Crop growth rate (CGR) was significantly increased with each increment in nitrogen fertilizer rate and different cotton cultivars (Table 6). The results indicated that CGR increased significantly with each increment in nitrogen application rate from zero to 160 kg N ha-1 from early to the final picking of the crop. Highest the crop growth rate was obtained where the treatment 160 kg nitrogen ha-1 was given to the soil against control i.e. zero nitrogen treatment. However, cultivar CIM-496 remained stand first for the
highest crop growth rate during both the years among the
cultivars. It is interesting it appears like that of leaf area index and thus the highest CGR was achieved uptil 120 days after sowing. There after, it tended to decrease uptil the crop maturity in both the seasons [6], [28].
3.6 Relative growth rate (g g-1 d-1)
A similar trend like that of crop growth rate was achieved here such that the relative growth rate (RGR) significantly influenced with nitrogen application through out the crop growth period. Thus, significantly the highest RGR was achieved with zero nitrogen treatment while the lowest RGR with zero nitrogen application. It is clear from the results during the early stages of crop growth, the value of relative growth rate were appeared as lower. However, with the enhancement in growth, the relative growth rate increased to maximum uptil 90 DAS and there after tended to decrease uptil the final harvest. Among the cultivars CIM-496 appeared with the highest value of RGR through out the crop growth period while CIM-506 appeared with minimum value during both the years [23].
3.7 Net assimilation rate (mg dm-2 d-1)
Results indicated that net assimilation rate (NAR) was significantly the highest where treatment 160 kg N ha-1 was applied to the soil as compared to the control treatment from early to the final crop growth stage. However, it is obvious from the findings that NAR was the highest during initial stages of crop growth but later on it decreased as crop growth increased up to the crop maturity. Similarly, all cultivars produced the highest net assimilation rate during early stages i.e. during vegetative crop growth stages and then as fruit load increase continuously till crop final harvest. However, the cultivar CIM-496 again produced the highest value of NAR against CIM-506 through out the crop growth season in both the years [15], [32].
3.8 Dry biomass (gm-2)
Results showed that total dry biomass significantly influenced by nitrogen fertilizer application and cultivars. Each increment in rate of fertilizer given to soil produced significantly the highest plant total dry biomass at crop harvest. Among all the fertilizer treatments, 160 kg N ha-1 produced the highest significant i.e. 891.4 and 904.5 g m-2 crop dry biomass against zero control treatment (527.4 and
534.7 g m-2) respectively in both the seasons. Similarly, the
cultivar CIM-506 produced the highest significant dry
IJSER © 2011 http://www.ijser.org
International Journal of Scientific & Engineering Research Volume 2, Issue 7, July-2011 5

ISSN 2229-5518
4.0
3.5
3.0
2.5
2.0
1.5
1.0
0.5
0.0
2007
30 60 90 120 150
Days afte r s ow ing
N1 N2 N3 N4
4.0
3.5
3.0
2.5
2.0
1.5
1.0
0.5
0.0
2007
30 60 90 120 150
Days afte r s ow ing
CIM-496 CIM-506 CIM-534
3.8
3.0
2.3
1.5
2008
4.0
3.5
3.0
2.5
2.0
1.5
1.0
2008
0.8
0.0
30 60 90 120 150
Days afte r s ow ing
N1 N2 N3 N4
0.5
0.0
30 60 90 120 150
Days after sow ing
CIM-496 CIM-506 CIM-534

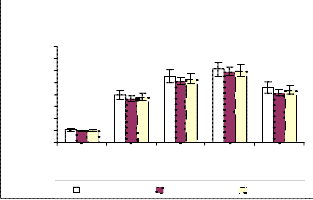
Fig. 1. Effect of nitrogen rates and days after sowing (DAS) on leaf area index (LAI) through out the crop growth.

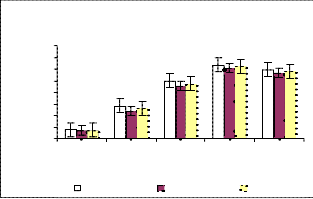
Fig. 2. Effect of cotton cultivars and days after sowing (DAS) on leaf area index through (LAI) out the crop growth.
7.0
6.0
5.0
2007
8.0
7.0
6.0
2007
4.0
3.0
5.0
4.0
3.0
2.0
2.0
1.0
0.0
30 60 90 120 150
Days after sow ing
N1 N2 N3 N4
1.0
0.0
30 60 90 120 150
Days afte r s ow ing
CIM-496 CIM-506 CIM-534
IJSER © 2011 http://www.ijser.org
International Journal of Scientific & Engineering Research Volume 2, Issue 7, July-2011 6
ISSN 2229-5518
7.2
6.4
5.6
4.8
2008
7.0
6.0
2008
4.0
3.2
2.4
1.6
0.8
0.0
30 60 90 120 150
Days after sow ing
N1 N2 N3 N4
Fig. 3. Effect of nitrogen rates and days after sowing (DAS) on crop growth rate (CGR) through out the crop growth.
TABLE 8 Effect of nitrogen and cultivars on cotton seed yield (kg ha-1)
5.0
4.0
3.0
2.0
1.0
0.0
30 60 90 120 150
Days after sow ing
CIM-496 CIM-506 CIM-534
Fig. 4. Effect of cultivars and days after sowing (DAS) on crop growth rate (CGR) through out the crop growth.
TABLE 9 Effect of nitrogen and cultivars on ginning out tern (% age)
Treatments | 2007 | 2008 |
kg N ha-1 | CIM 496 | CIM 506 | CIM 534 | Means | CIM 496 | CIM 506 | CIM 534 | Means |
0 60 110 160 Means | 41.34 39.40 39.90 40.21 41.25 39.87 41.87 41.00 41.45 38.99 40.62 40.35 41.53 40.56 41.10 41.06 41.14 39.71 41.12 | 40.28 40.13 41.20 40.54 42.18 38.80 39.15 40.04 41.40 39.20 39.90 40.17 40.25 39.47 39.95 39.89 41.03 39.40 40.05 |
SEs Cultivar Nitrogen C x N LSD (5%) Cultivar Nitrogen C x N | 0.372 0.498 0.594 1.111 ns ns | 0.462 0.567 0.646 1.382 ns ns |
TABLE 10 Effect of nitrogen and cultivars on staple length (mm)
TABLE 11 Effect of nitrogen and cultivars on uniformity ratio
Treatments | 2007 | 2008 |
kg N ha-1 | CIM 496 | CIM 506 | CIM 534 | Means | CIM 496 | CIM 506 | CIM 534 | Means |
0 60 110 160 Means | 29.0 28.3 28.7 28.7 29.0 28.5 28.8 28.8 28.7 28.3 28.8 28.6 29.6 28.5 28.8 29.0 29.1 28.4 28.8 | 29.7 28.5 28.9 29.0 29.5 28.7 29.2 29.1 29.9 28.2 29.0 29.0 29.8 28.4 28.9 29.0 29.7 28.5 29.0 |
SEs Cultivar Nitrogen C x N LSD (5%) Cultivar Nitrogen C x N | 0.071 0.110 0.353 0.211 0.292 ns | 0.131 0.205 0.411 0.410 ns ns |
IJSER © 2011 http://www.ijser.org
International Journal of Scientific & Engineering Research Volume 2, Issue 7, July-2011 7
ISSN 2229-5518
0.080
0.060
2007
0.080
2007
0.040
0.020
0.000
30 60 90 120 150
Days after sow ing
N1 N2 N3 N4
0.060
0.040
0.020
0.000
30 60 90 120 150
Days afte r sow ing

CIM-496 CIM-506 CIM-534
0.100
0.080
0.060
0.040
0.020
0.000
2008
30 60 90 120 150
Days after sow ing
N1 N2 N3 N4
0.100
0.080
0.060
0.040
0.020
0.000
2008
30 60 90 120 150
Days after s ow ing
CIM-496 CIM-506 CIM-534
Fig. 5. Effect of nitrogen rates and days after sowing (DAS) on relative growth rate (RGR) through out the crop growth.
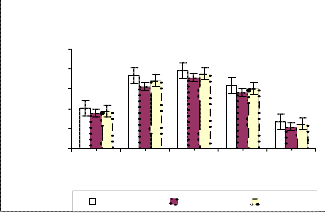
Fig. 6. Effect of cotton cultivars and days after sowing (DAS) on relative growth rate
(RGR) through out the crop growth.
120
100
80
60
40
20
0
2007
30 60 90 120 150
Days after sow ing
N1 N2 N3 N4
100
80
60
40
20
0
2007
30 60 90 120 150
Days afte r s ow ing
CIM-496 CIM-506 CIM-534
IJSER © 2011 http://www.ijser.org
International Journal of Scientific & Engineering Research Volume 2, Issue 7, July-2011 8
ISSN 2229-5518
only by the application of the specific nutrient to the plants there is no substitute of it. Trails conducted during the two
120
100
2008
80
60
40
20
0
30 60 90 120 150
Days afte r sow ing
N1 N2 N3 N4
120
100
80
60
40
20
0
2008
30 60 90 120 150
Days afte r sow ing
CIM-496 CIM-506 CIM-534
Fig. 6. Effect of nitrogen rates and days after sowing (DAS)
on net assimilation rate (NAR) through out the crop growth.
biomass (735.1 and 739.1 g m-2) than CIM-534 in the first crop growing season while, similar trend was found in the next year [17], [35].
3.9 Number of bolls (m-2)
Production and fruit retention of a crop is dependent on balanced availability of the soil nutrients in a certain proportion and potential of the cultivar other wise, crop will have to cut a sorry figure to meet the production of potential yield. Results showed that with increase in nitrogen fertilizer applied through soil significantly influenced the boll load in cotton crop. As nitrogen rate increased fruit retention increased significantly. Results indicated that the fertilizer treatment of 160 kg N ha-1 produced significantly the highest i.e. 55% and 53% increased number of bolls m-2 in both the years against control treatment. Regarding with the cultivars, CIM-496 stood first with the highest value of 120.3 and 122.7 number of bolls m-2 in both the years respectively while, CIM-506 appeared with the lowest value of (108.8 and 111.8). Similar findings were reported by other researchers [9], [27].
3.10 Seed cotton yield (kg ha-1)
Already a lot of work have done on fertilizer impacts on production of a crop emphasized that yield is directly proportional to the timely application of the nutrients to the crops [4]. A visible short fall in yield reduction had been notice by many researches in the absence or scarcity of the
plant nutrients. However, this yield recovery is assured
Fig. 7. Effect of cotton cultivars and days after sowing (DAS) on net assimilation rate (NAR) through out the crop growth.
growing seasons showed that seed cotton yield was significantly the lowest (2113.2 and2150.5 kg ha-1) where zero nitrogen was applied to the plants while, 160 kg ha-1 experimental fertilizer treatment produced significantly the highest seed cotton yield (3445.7 and 3536.4 kg ha-1) in both the crop growth seasons that was 63% and 64% more than control treatment. Similarly, different cultivars showed their different potential in producing yield. However, the cultivar CIM-496 produced significantly the highest seed cotton yield i.e. 3124.6 and 3227.3 kg ha-1 while, the lowest yield was achieved with CIM-506 (2676.9 and 2801.7 kg ha-
1) during both the years [34], [36].
3.11 Cotton seed yield (kg ha-1)
Our results showed that similar trend like seed cotton yield were found for cotton seed yield during both the years. Research conducted during two seasons showed that cotton seed yield produced by different cultivars respond significantly to the increasing rates of nitrogen fertilizer. With each increment in rate of nitrogen cotton seed yield was increased significantly. However, the yield was the highest significantly (2032.0 and 2133.9 kg ha-1) where 160 kg N ha -1 was applied to the soil against untreated control (1163.8 and 1178.2 kg ha-1) that was 75% and 81% greater than untreated control treatment in both the years. Results also indicated that CIM-496 cultivar showed the maximum significant potential i.e. 1789.4 and 1815.3 kg ha-1 than other two cultivars during both the years [1], [37], [42].
IJSER © 2011 http://www.ijser.org
International Journal of Scientific & Engineering Research Volume 2, Issue 7, July-2011 9
ISSN 2229-5518
3.12 Ginning out tern (% age)
Results regarding GOT percentage indicated that all the fertilizer treatments and cultivars produced different ginning out tern percentage. However, there were significant differences among different treatments of cultivars. Cultivar CIM-496 gave the highest value of 41.14 and 41.03 % GOT while the lowest value of 39.71 and 39.40 was obtained with CIM-506 during both the years [6], [27].
3.13 Staple length (mm)
Results showed that cultivars significantly affected staple length during both the years while, nitrogen fertilizer only during the previous year of crop cultivation. The highest staple lengths (29.0 and 29.1 mm) were produced by 160 and 60 kg N ha-1 treatments in the first and second year respectively against control treatment. However, the differences found during first year were significant statistically and in the final year these results were insignificant. As regarding with the cultivars, CIM-496 produced the highest significant staple lengths (29.1and
29.7 mm) during both the crop growth seasons than CIM-
506. It is obvious from the results that cultivar rather than fertilizer is the main source to improve the fibre lengths [16], [22].
3.14 Uniformity ratio
Results showed that fibre uniformity ratio significantly respond to the cultivars rather than fertilizer treatments in both the crop growing years. Field trail results indicated that the highest uniformity ratio was produced by zero and
110 and by zero kg N ha-1 treatments in previous and final year of Evidences showed that in both the crop growing seasons, cultivar CIM-496 produced the highest significant (P<0.05) uniformity ratio against CIM-506 [10], [21].
TABLE 12 Effect of nitrogen and cultivars on maturity ratio
Nitrogen ns 0.021
C x N ns ns

3.15 Maturity ratio
The findings indicated that cultivars significantly affected fibre maturity ratio during first and second year. While, increasing fertilizer rates produced insignificant results only during the first season while in the next year as nitrogen rates increased maturity ratio decreased and the differences were found significant between zero and 160 kg N ha-1 treatments. Nitrogen fertilizer treatment i.e. 160 kg nitrogen ha-1 produced significantly lowest (1.00) maturity ratio in the final year. Cultivar CIM-496 produced the highest significant maturity ratio (1.03 and 1.02) in both the years against CIM-534 [9], [13].
4 CONCLUSIONS
From the findings, it may be concluded that the judicious use of nitrogen fertilizer is utmost required to achieve the maximum growth of cotton plant that resulted higher seed cotton yield. Further more, the cultivar CIM-496 may be recommended to promote for cultivation in the region to achieve the better yield by the farmers.
REFERENCES
[1] Abdel-Malak, K.K.I., F.E. Radwan and S.I.
Baslious. 1997. Effect of row width, hill spacing and nitrogen levels on seed cotton yield of Giza 83 cotton cultivar. Egyp. J. of Agri. Res., 75: 743-752.
[2] Ahmed, A. U. H., R. Ali, S. I. Zamir and N.
Mehmood (2009). Growth, yield and quality performance of cotton cultivar BH-160 (Gossypium hirsutum L.). The J. Anim. Plant Sci., 19(4):189-192.
[3] Ali, H., D. Muhammad, M. N. Afzal and S. A.
Abid. 2005. Seedcotton yield of different cultivars as affected by sowing time under agro-climatic conditions of southern Punjab. The Indus Cotton. 2 (3): 186-89.
[4] Ali, H., M. N. Afzal, S. Ahmad and D.
Muhammad. 2009. Effect of cultivars and sowing dates on yield and quality of Gossypium hirsutum L. crop. J. of Food, Agriculture and Environment.
7(3&4): 244-47.
[5] Ali, H., M. N. Afzal, S. Ahmad, D. Muhammad, Z.
Husnain, R. Perveen and M. H. Kazmi. 2010.
IJSER © 2011 http://www.ijser.org
International Journal of Scientific & Engineering Research Volume 2, Issue 7, July-2011 10
ISSN 2229-5518
Quantitative and qualitative traits of Gossypium hirsutum L. as affected by agronomic practices. J of Food, Agriculture and Environment. 8 (3&4): 945-
48.
[6] Anjum, F. H., A, Tanveer, R. Ahmad, A. Ali, M.
A. Nadeem and M. Tahir. 2007. Respose of cotton (Gossypium hirsutum) to split application of nitrogen and weed control methods. Ind. J. of Agri. Sci., 77 (4): 224-9.
[7] Barnes, M. and C. W. Herndon, Jr. (1997). Causal factors of cotton quality discount and premiums in the mid-south: 1973–1995. In Proceedings of the Beltwide Cotton Conference, New Orleans, LA. 7–
10 Jan. 1997. National Cotton Council of America, Memphis, TN: 326–330.
[8] Bednarz G.W., R. L. Nichols and S. M. Brown.
2006. Plant density modifications of cotton within boll yield components. Crop science, 46:2076-2080.
[9] Bednarz G.W., Shurley, W.D., Anthony, W.St. and Nichols R.L. 2005. Yield, quality and profitability of cotton produced at varying plant densities Agron. J. 97:235-240.
[10] Benson, N. R., E. D. Vories, F. M.
Bourland and G. Palmer. 1998. Nitrogen and cultivar effects on yield and earliness of cotton on clay soils. Proceedings of the belt wide cotton conferences, San Diego, CA, USA, January 5-9,
1999: 677-80.
[11] Boman, R. K., W. R. Raun., R. L. Westerman and J.
C. Banks. 1997. Long term nitrogen fertilization in short- season cotton. Interpretation of agronomic characteristics using stability analysis. J. Prod. Agric. 10: 580-85.
[12] Bowman, D. T. 2007. Variety selection in 2007 cotton Information. North Carolina State Uni. Coop. Ext. Publ. AG-417. North Carolina Stat Uni., Releigh.: 27-38.
[13] Cassman, K. G., T. A. Kerby, B. A. Roberts, D. C.
Bryant and S.L.Higashi.1990.Potassium nutrition effects on limt yield and fibre quality of Acala cotton. Crop Sci. 30: 672-77.
[14] Clawson, E.L., J.T. Cothren and D.C Blouin. 2006.
Nitrogen fertilization and yield of cotton in ultra narrow row and conventional row spacings. Agron. J. 98:72-79.
[15] Darawsheh , M. K ., Aivalakis, G. and D. L.
Bouranis. 2007. Effect of cultivation system on cotton development, seed cotton production and lint quality. The European J of Plant Science and Biotechnology17 (7):206-213.
[16] El-Debaby, A.S., G.Y. Hammam and M.A. Nagib.
1995. Effect of planting date, N and P application levels on seed index, lint percentage and technological characters of Giza-80 cotton cultivar. Annals of Agri. Sci. Moshtohor. 33 (2):455-464.
[17] El-Zeiny, O. A. H., U. A. El-Behariy and M. H.
Zaky. 2001. Influence of biofertilizer on growth, yield and fruit quality of tomato grown under plastic house. J. Agric. Sci. Mansouera Uni., 26. (3)
1749-63.
[18] Faircloth, J. C. 2007. Cotton variety trails. Virginia cotton production
guide. Virginia polytechnic Inst. and Stat Uni. Coop. Ext. Publ. 424-300. Virginia polytechnic Inst. State Uni., Blacksburg: 8-15.
[19] Fritschi, F. B., B. A. Roberts, R.L. Travis, D. W.
Rains and R. B. Hutmacher. 2003. Response of irrigated Acala and Pima cotton to nitrogen fertilization: growth, dry matter portioning and yield. Agron. J. 95:133-146.
[20] Gerik, T. J., Jackson, B. S., Stockle, C. O., and Rosenthal, W. D. 1994. Plant nitrogen status and boll load of cotton. Agron. J.86: 514-518.
[21] Hussain, S. Z., S. Faird, M. Anwar, M. I. Gill and M. D. Baugh (2000). Effect of plant density and nitrogen on the yield of seed cotton-variety CIM-
443. Sarhad J. Agric. 16: 143-147.
[22] John, J. R., K. R. Reddy and J. N. Jenkins.2006.
Yield and fiber quality of upland cotton as influenced by nitrogen and potassium nutrition. Europ. J. Agron. 24:282-290.
[23] Kandil, A. A., M.A. Bawai, S. A. EL-Moursy and
U. M. A. Abdou. 2004. Effect of planting dates,
IJSER © 2011 http://www.ijser.org
International Journal of Scientific & Engineering Research Volume 2, Issue 7, July-2011 11
ISSN 2229-5518
nitrogen levels and bio-fertilization treatments on
1: Growth attributes of Sugar Beet (Beta vulgaris, L.). Scientific J. of King Faisal Uni. 5 (2) 1425.
[24] McConnell, J. S., W. H. Baker and B. S. Frizzell (1996). Distribution of residual nitrate-N in long term fertilization studies of an alfisol cropped for cotton. J. Environ. Qual. 25: 1389-1394.
[25] Meredith, W. R. Jr. (1986). Fiber quality variation among USA cotton growing regions. In Proceedings of the Beltwide Cotton Conference. LasVegas, NV. 4–9 Jan 1986. National Cotton Council of America, Memphis, TN: 105–106.
[26] Minton, E.B. and M. W., Ebelhar. 1991. Potassium and aldicarb-disulfoton effects on verticellium wilt, yield and quality of cotton. Crop Sci. 31, 209-212.
[27] Nichols S.P., C.E. Snipes and M.A. Jones. 2004.
Cotton growth, lint yield and fiber quality as affected by row spacing and cultivar. The J. of Cotton Sci., 8:1-12.
[28] Ozgul G. 2005. Interactive effect of nitrogen and boron on cotton yield and fiber quality. Turk. J. Agric. For. 29:51-59.
[29] Patel, R. H., G. Meisheri and J. R. Patel.1996.
Analysis of growth and productivity of Indian mustard (Brassica juncea) in relation to FYM, nitrogen and source of fertilizer. J. Agron. Crop. Sci.177:1-8.
[30] Pettigrew, W. T. and Jr J. J. Adamczyk. 2006.
Nitrogen fertility and planting date effect on lint yield and Cry 1 AC (BT) endotoxin production. Agron., J. 98 (3): 690-7.
[31] Radford, P. J. 1967. Growth analysis formulae- their use and abuse. Crop Sci. 7: 171-175.
[32] Reddy, K. R., G. H. Davidsonis, A. S. Johnson and Vinyard, B. T., 1999. Temperature regime and carbon dioxide enrichment alter cotton boll development and fibre properties. Agron. J. 91,
851-8.
[33] Reddy, K. R. and H. F. Hodges. 1998.
Photosynthesis and environment factors. Proceedings of the belt wide cotton Conference,
San Diego, CA. 5-9 Jan. 1998, National cotton conference, USA: 1443-49.
[34] Reddy, K. R., S. Koti., G. H. Davidson and V. R Reddy. 2004. Interactive effects of CO2 andnitrogen nutrition on cotton growth, development, yield and fiber quality. Agron. J. 96
:1148-1157.
[35] Saleem, M. F., M. F. Bilal., M. Awais., M. Q.
Shahid and S. A. Anjum. 2010. Effect of nitrogen on seed cotton yield and fiber qualities of cotton (Gossypium hirsutum L.) cultivars. The J. of Animal and Plant Sci. 20 (1):23-27.
[36] Sampathkumar, T., Krishnasamy, S. Ramesh., S.
Prabukumar, G. and R., Gobi. 2006. Growth, nutrient uptake and seed cotton yield of summer cotton as influenced by drip, surface irrigation methods and mulching practices. Research J. of Agri. and Biological Sci., 2 (6): 420-422.
[37] Sawan, Z. M., M. H. Mahmoud and A. H. El- Guibali (2006). Response of yield, yield components, and fiber properties of Egyptian cotton (Gossypium barbadense L.) to nitrogen fertilization and foliar-applied potassium and mepiquat chloride. The J. Cotton Science, 10:224–
234.
[38] Sawan, Z. M., S. A. Hafeez and A. E. Basyony.
2001. Effect of nitrogen fertilization and foliar application of plant growth retardants and zinc on cottonseed, protein and oil yields and oil properties of cotton. J. Agronomy & crop Sci., 186.
183 - 191.
[39] Sayed, A. V. and H. A. Farahani. 2010. Effects of planting density and pattern on physiological growth indices in maize (Zea mays L.) under nitrogenous fertilizer application. J. of Agri. Ext. and Rural Dev. 2(3): 40-47.
[40] Steel, R. G. D. and J. H. Torrie, 1986. Principles and procedure of statistics. A biometric approach, 2nd edition, Mc Graw Hill, Inc. Tokyo.
[41] Subhan, M., H. U. Khan and R. O. Ahmed (2001).
Population analysis of some agronomic and technological characteristics of upland cotton
IJSER © 2011 http://www.ijser.org
International Journal of Scientific & Engineering Research Volume 2, Issue 7, July-2011 12
ISSN 2229-5518
(Gossypium hirsutum L.). Pakistan J. Biol. Sci., 1:120-
123.
[42] Wright, D.L., Marois, J.J., Wiatrak, P.J., Sprenkel, R.K., Tredaway, J.A., Rich, J.R. and Rhoads F.M.
2000. Production of ultra narrow row cottons SS- Ag\Gr-83. Agronomy Department, Florida Coop. Ext. Ser., Gainesville, FL
[43] Wu FeiBo, Wu LaingHuan and Xu FuHua.
1998. Chlorophyll meter to predict nitrogen
sidedress requirements for short-sesson cotton (Gossypium hirsutum L.) Field crops res. 56, 309-14
IJSER © 2011 http://www.ijser.org
International Journal of Scientific & Engineering Research Volume 2, Issue 7, July-2011 13
ISSN 2229-5518
1-BER IS)2011
http:1/www.ijserorg