International Journal of Scientific & Engineering Research, Volume 5, Issue 7, July-2014 1231
ISSN 2229-5518
Caroline K. Onyancha1, Eliud M. Mathu2, Sixtus K. Mwea3 and Wilson M. Ngecu4
Abstract— Nairobi City is located in an area that may have been part of a large lake or a series of lakes that extended from Ol Doinyo Sabuk to almost Kajiado in the Tertiary Period. Volcanic rocks deposited in these lakes vary in lateral and vertical extent and in strength. Geotechnical investigation of sites with high variability by use of boreholes can be very costly. Electrical resistivity surveys are cheaper and quicker. The investigation program in this study involved 1-D geophysical resistivity surveys carried out at 48 sites with electrode distances ranging between 80 m and 500 m. The focus of the study was on how site investigations can be carried out cheaply and quickly in the context of design of heavy buildings and in underground excavations in Nairobi City. Results for the resistivity survey are presented as log-log curves for the various sounding sites alongside the borehole logs while frac- tures traced in the borehole logs are indicated on a map. The results of this study indicate that the Nairobi subsurface consists of five different profiles with strata having resistivity values in the range of 4.3 Ohm-m to 480 Ohm-m. In spite of the similarity of the curves, the number of layers detected in each profile is variable. In areas dominated by clays or alternating layers of weak and strong materials, the resistivity values are less than 100 Ohm-m. Electrical geophysical resistivity can be used to determine stratigraphic information at a site to pinpoint spots for geotechnical investigation in order to detect any variation that can pose challenges in building structures that can stand the test of time.
Keywords— Electrical Resistivity, Heavy constryction, Nairobi City, subsurface characterization, Variable soils
—————————— ——————————
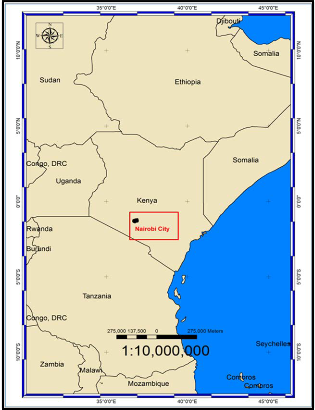
Nairobi City is located in central Kenya (Fig. 1) in an area that may have been part of a large lake or a series of lakes that extended from Ol Doinyo Sabuk to almost Kajiado in the Tertiary Period. It is underlain by rocks erupted by volcanic pro- cesses within and around the East African Rift Valley. The geological succession includes metamorphic and igneous rocks as well as interbedded lacustrine and alluvial sediments. The subsoil in Nairobi City is reported to have variable strength and thickness at building sites and water borehole locations by Gevaerts [1], Sikes [2], Saggerson [3], Ministry of Works [4], Ministry of Works [5] and Onyancha et al. [6]. The variability in strength has a bearing on the design of heavy build- ings and in underground excavations ([4], [7]).
Numerous studies have indicated that the greatest element of risk in a civil engineering project lies with the un- certainties in ground conditions ([8], [9], [10]). The risks are significantly increased with inadequate site investigations
resulting in unpredictable construction costs and programming [11]. Consequently, site investigation forms a vital part of a building design, yet, in general, the scope of such investigation is constrained by financial and time considerations [12]. Geotechnical investigation of sites with high variability by use of boreholes can be very costly. Electrical resistivity sur- veys are cheaper and quicker. In a volcanic environment, geophysical resistivity survey has a high potential for delineat- ing soft spots for further investigation because soft spots could have lower resistivity than the surrounding area covered by lava.
Geophysical resistivity survey is based on the response of the earth to the flow of electrical current passed
through the ground by use of electrodes. Electrical resistivity is a measure of the average resistance along the path trav-
elled by the current. Electrical resistivity of earth materials is influenced by factors such as rock/soil type and degree of
weathering/ consolidation, water content and salinity among others. It is therefore assumed that changes in resistivity values correspond to changes in the subsurface character. Resistivity survey gives a more detailed image of the subsurface than boreholes when carried out at several locations within a site. The depth for which the information can be obtained is determined by the size of the site; more than five profiles can be obtained for a site within a day in a 1-D survey. However, the method has not been extensively used in subsurface characterization for the purpose of construction in Nairobi City.
IJSER © 2014 http://www.ijser.org
International Journal of Scientific & Engineering Research, Volume 5, Issue 7, July-2014 1232
ISSN 2229-5518
Fig. 1: Map showing location of Nairobi City on the regional map of Africa.
The investigation program in this study involved 1-D geophysical resistivity surveys carried out at 48 sites with current electrode distances ranging between 80m and 500m. The focus of the study was on how site investigations can be carried out cheaply and quickly in the context of design of heavy buildings and in underground excavations. With a current elec- trode distance of 80m, the subsurface profile can be vividly deciphered up to a depth of not less than 40m in a 1-D resis- tivity survey.
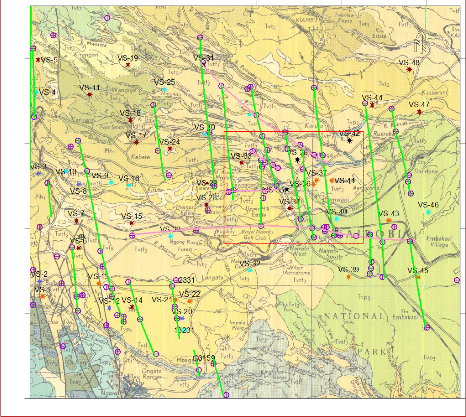
Geological research prior to starting of the geophysical study identified a network of faults in the south-western section of the project area (Figure 2) which are predominantly trending NNW and the soft spots recorded in past reports ([1], [2], [3], [4], [5], [6], [7]). Fracture zones were also mapped in borehole logs because deeply weathered rock associated with fracture zones causes numerous drilling problems including caving conditions, loss of drilling fluids and difficulty with drill bit rotation [13]. Other indicators of fracture zones include abnormally large unconsolidated zone, high moisture content in the unconsolidated zone, highly weathered bedrock, presence of iron staining and authigenic minerals (such as calcite) on fractured rock surfaces, and increases in water yield with depth [14].
The purpose of fracture trace analysis in this study was to: analyze structural jointing and fracture trends and their possi- ble association with abrupt changes in soil type at construction sites and boreholes; determine weak areas that support structures; and, assist in evaluating if fracturing and jointing trends observed on the surface are present at depth within on-site boreholes [13]. Approximately, 900 borehole logs were analysed for fracture traces of which 97 had one or more of the indicators of fracturing. Positions of the boreholes with fracture trace indicators were plotted on the geological map using Didger 4 software (by Golden Software, Colorado) and those aligned were taken to represent fractures as shown in Fig. 2. Vertical electrical sounding was then carried out either on the fault line/trace or across it in order to analyse sub- surface variation.
IJSER © 2014 http://www.ijser.org
International Journal of Scientific & Engineering Research, Volume 5, Issue 7, July-2014 1233
ISSN 2229-5518
-1.2
-1.25
-1.3
-1.35
-1.4
The second stage involved identification of suitable sounding sites and seeking permission from relevant authorities to use the site on a specified day. The sounding centres were selected based on the location of soft spots and lineaments and on the availability of space for carrying out geophysical resistivity survey. A number of the sounding centres were located adjacent or near well logged boreholes so as to determine the correlation between the geophysical attributes and the hy- drogeological and mechanical properties of the subsurface [15; 16]. Stratigraphic profiles in the logged boreholes were drawn using Strater 3 Software (by Golden Software, Colorado USA). The stratigraphic profiles and the corresponding resistivities were used to identify soft spots in the subsurface and to provide a geologic context for evaluating the results of geotechnical investigations.
The geophysical resistivity survey was conducted using a WDDS-1 Digital Resistivity Meter manufactured by Benteng Digital Control Technology Institute in China. WDDS-1 resistivity meter is a new generation of resistivity instrument that can automatically measure and store parameters such as self potential, current, voltage, geometric factor and apparent resistivity. Vertical electrical sounding (VES) was carried at centres located in open/sports fields, public institutions or along straight portions of roads away from the power lines and water mains. Each sounding centre constituted a vertical sounding (VS) and designated VS-1 through to VS-48 as shown in Figure 2. The sites are labelled along south-north lines in the west-east direction beginning with VS-1 through VS-48. The location of each sounding station was recorded in de- grees using Garmin 12 channel personal navigator Global Positioning System (GPS). The Schlumberger array was utilized to carry out the resistivity survey with electrode separations from the centre (AB/2) ranging between 80m and 500m. Schlumberger technique was preferred because it provides for high signal-to-noise ratios, good resolution of horizontal layers, and good depth sensitivity [17].
The apparent resistivity (ρ) values obtained for each survey line were plotted against AB/2 on a log-log plot using Earth
IJSER © 2014 http://www.ijser.org
International Journal of Scientific & Engineering Research, Volume 5, Issue 7, July-2014 1234
ISSN 2229-5518
ImagerTM software. The Earth Imager software is designed by Advanced Geosciences Incorporated (AGI) of Texas USA for inversion of geophysical resistivity data. Once the data is transferred into the program, the software automatically detects borehole dataset for processing. From iteration to iteration “bad” data is removed and the data misfit is displayed in a scatter plot. There is also a data cross plot (raw versus inverted apparent resistivity data) available as well as a diagram showing the convergence curve and layer model for the subsurface. The root mean square error (RMS) is also indicated on the diagram.
Analysis of variation in the subsurface character using the resistivity curves was attained through curve marching.
Curve marching involves comparison of VES curves obtained in a resistivity survey with Master Curves obtained from
past experimental studies. The comparison is based on the values of apparent resistivity of the geoelectric layers detected in a resistivity curve. The Master Curves include: H type where ρ1 > ρ2 < ρ3; K type where ρ1 < ρ2 > ρ3 ; A type where ρ1 < ρ2
< ρ3 ; and, Q type where ρ1 > ρ2 > ρ3 .
Results for the resistivity survey are presented as log-log curves for various sounding sites plotted on Earth Imager soft- ware. On marching the curves for various VES sites, it was observed that where the subsurface profiles are similar, the resistivity curves have a similar shape. However, on closer scrutiny of the curves, it was noted that even when the curves generally look similar, the subsurface is basically heterogeneous as indicated by the difference in the number of geoelec- tric layers detected. Because of the heterogeneity of the subsurface and the ability of Earth Imager Software to detect thin subsurface layers, none of the curves could march one type of Master Curve. Five shapes of curves were obtained for the entire study area.
Several fault traces were mapped in boreholes in the vicinity of Nairobi City as shown on Fig. 2. The traces indicate that the City Centre subsurface may have been affected by two sets of faulting: NW-SE and E-W. One NW-SE fracture trace at the City Centre affects the Nairobi Trachyte that is prominent at Upper Hill area but is not encountered beyond Uhuru Highway 400m away. A borehole at the Latter-Day Saints church at Lower Hill encountered a small thickness of the Nai- robi Trachyte but BH C-1987 at Uhuru Highway railway crossing did not encounter it, showing that it suddenly ends within the Railway Golf Club. The second City Centre fracture trace is observed at Uhuru Highway railway crossing through Moi Avenue line to the Premier Academy borehole at Parklands that has exceptionally high yield like BH C-1987 at railway crossing. The third fracture trace is mapped in several boreholes in Industrial area and emerging at the Railway Station and can be observed as far north as Muthaiga where distress in structures is reported. Given the three faults cut- ting through City Centre in the N-S direction, the parts covered with deep soft soils seem to represent a graben while those covered by tuffs represent the horst. The E-W faulting is represented by Kenyatta Avenue-Valley Road where there are different subsoil types on either side of the road. The other important fracture traced is that along Ngong’ Road where deep soft soils are encountered in construction excavations. Shallow groundwater flows into construction excavations alt- hough aquifers and rest levels are very deep in boreholes along Ngong Road. Engineering consultants for the NSSF build- ing at Upper Hill also reported encounter of sudden voids within very competent Nairobi Trachyte.
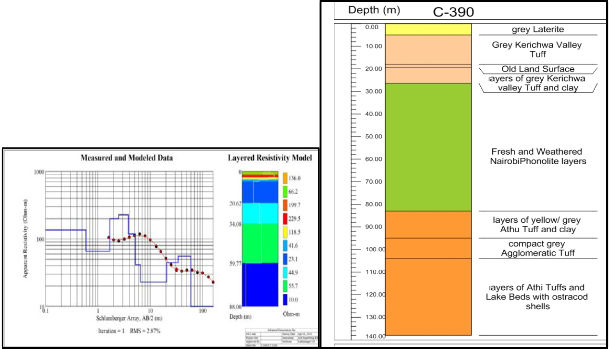
Majority of the VES stations were concentrated in those areas that have known weak materials or nearby faults or fault traces. City Park site (VS-38) at Parklands recorded high resistivity values at the ground surface that reduced with depth from 136 Ohm-m to 10 Ohm-m due to the dominance of weak materials in the subsurface profile shown in Fig. 3. The suc- cession in the water supply borehole at the site (C-390) starting from the surface to 140 m depth includes grey laterite, grey Kerichwa Valley Tuff and alternating layers of clays, weathered and fresh Kerichwa Valley Tuffs, Nairobi Phonolite and Athi Tuffs and Sediments. Considering three successive layers at a time, the curve was found to represent HQHQ type. Three Sites with curves of similar shape as the VS-38 are indicated in the same colour on Fig. 2. Because of the small thicknesses of the layers of fresh Nairobi Phonolite and the concept of suppression, it is not easy to detect them on the resistivity curve. Caution should be taken when designing structures in these locations because shallow foundation struc- tures founded on this subsoil in Garden Estate have reported major distress.
The second shape of curve obtained is KA- type represented by the curve for the Kabete Approved School (VS -24 on Fig.
IJSER © 2014 http://www.ijser.org
International Journal of Scientific & Engineering Research, Volume 5, Issue 7, July-2014 1235
ISSN 2229-5518
4) and sixteen other sites. The sounding curve shows that resistivity remains almost constant (<35 ohm-m) up to 30 m depth before it begins a slow rise. From borehole records, the profiles are dominated by weathered and fractured rocks where several aquifers are encountered. Because of the aquifers within the fractured Kabete trachyte and the concept of equivalence, the fractured trachyte, weathered trachyte and laterite appear to have similar apparent resistivities. The true resistivities of the three rock formations would be different because they are a function of resistance and layer thickness.
Fig. 3: Comparison of resistivity data and profile for City Park site (VS-38)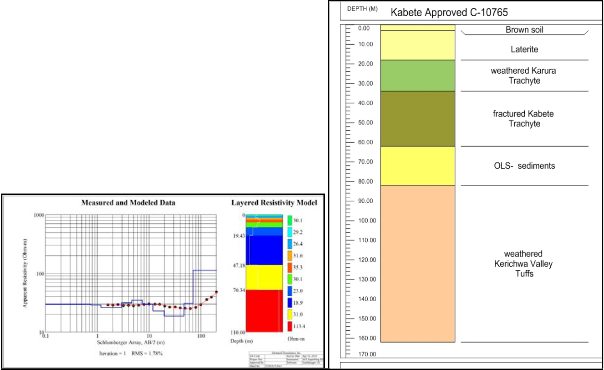
Fig. 4: Comparison of resistivity data and profile for Kabete Approved School (VS-24)
The third shape of curve obtained is the AHKA type represented by a sounding curve and subsurface profile for Pumwani
IJSER © 2014 http://www.ijser.org
International Journal of Scientific & Engineering Research, Volume 5, Issue 7, July-2014 1236
ISSN 2229-5518
Secondary School sports field. Resistivity of the four near-surface geoelectric layers increases with depth. In some logs from nearby boreholes, these layers are described as decomposed tuffs while in others they are described as laterites. A geotechnical borehole log at a nearby site indicates that the laterites extend to 8 m depth and are underlain by weathered Kerichwa Valley Series tuff. The lower resistivity geoelectric layers between 10 m and 23 m on the resistivity model in Fig.
5 represent vesicular Kerichwa Valley Series tuff and the weathered Nairobi Phonolite beneath it. From records, the first
(minor) aquifer in the water supply borehole was struck at the contact between the Kerichwa Valley Series and the weath-
ered Nairobi phonolite. Ten sites with curves of similar shape as VS-37 are indicated in the same colour on Fig. 2.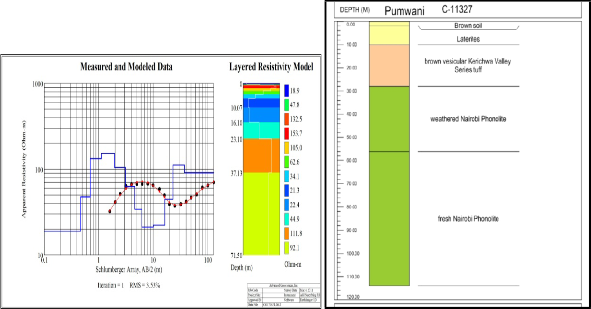
Figure 5: Comparison of resistivity data and profile for Pumwani Secondary School (VS-37)
The fourth type of curve obtained is AKQ type as represented by the site at the East Gate to Nairobi National Park (Fig. 6). The sounding curve shows that the resistivity is very low (<10 ohm-m) at the surface but generally increases with depth before it begins to fall. The layered resistivity model shows that resistivity increases up to 40 m within the Nairobi Phono- lite and begins to fall as it approaches the Old Land surface and Athi Series tuffs and sediments. It can be observed that water was encountered at depths of 130 m and 170 m within the Athi Series sediments. Nine sites with curves of similar shape as VS-39 are indicated in the same colour on Figure 2, most of them in east Nairobi and Karen- Langata.
The fifth shape of curve was obtained at 11 sites and is represented by Telkom Field at Jamhuri in Fig. 7 (AHKQ type). Borehole profiles indicate existence of red soil at the surface followed by laterite and weathered tuffs. The layered resistivity model indicates that the laterite has variable strength ranging between 24.5Ohm-m to 95 Ohm-m. The resisitivity of the Kerichwa Valley Series Tuff lies between 17 and 18 Ohm-m; the first aquifer was struck within this formation. There is a drastic increase in resistivity within the Nairobi Trachyte. This is consistent with the mechanical properties of the Nairobi Trachyte as recovered at Upper Hill geotechnical sites. The layered resistivity model in Fig. 7 was not able to “detect” the behavior of the Mbagathi Phonolitic Trachyte, however the individual value of aparent resistivity for this depth was about 350 Ohm-m. Since this resistivity value is an average for all layers above Mbagathi Phonolitic Trachyte, the true resistivity of the formation must be much higher.
IJSER © 2014 http://www.ijser.org
International Journal of Scientific & Engineering Research, Volume 5, Issue 7, July-2014 1237
ISSN 2229-5518
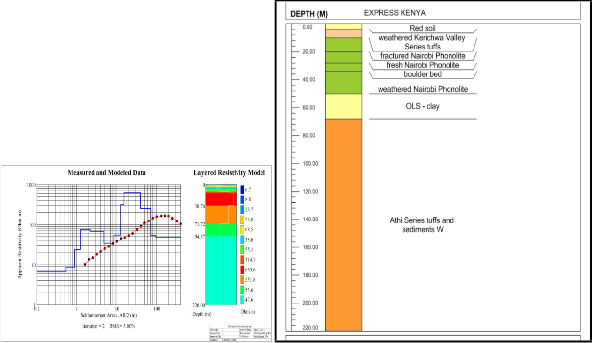
Figure 6: Comparison of resistivity data and subsurface profile for East Gate (VS-39)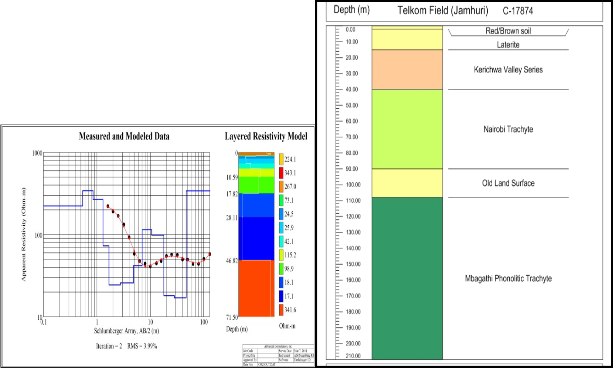
Figure 7: Comparison of resistivity data and profile for Telkom Field at Jamhuri (VS-23)
Two VES were carried out at Bulbul, one line running across the fault (VS-1) the other line running along the fault (VS-2). The near surface layers along the fault have the resistivity values below 5 ohm-m up to 5 m depth and less than 30 ohm-m up to 30 m depth. The resistivity variation along the fault forms shape of curve almost similar to that obtained at East gate (Fig. 2 VS-39). Five sites with such deep weak subsurface as VS-2 are indicated in the same colour on Fig. 2 and are associated with cyclic distress in structures. Across the fault, the resistivity forms a curve that is almost similar to that obtained at Telkom Field at Jamhuri in Fig. 7 where the resistivity value of 290 ohm-m at the ground surface gradually
IJSER © 2014 http://www.ijser.org
International Journal of Scientific & Engineering Research, Volume 5, Issue 7, July-2014 1238
ISSN 2229-5518
reduces to a low of 21 Ohm-m at 7 m depth after which it rises and falls to 10 Ohm-m. When the two layered resistivity models at VS-1 and VS-2 are compared at 49.56 m and 47.8 m depth, they have resistivities of 14.7 ohm-m and 106.2 ohm- m respectively. This indicates that the subsurface varies in the two directions owing to the presence of the fault. But the two Bulbul curves agree at depths below 124 m where there is a low resistivity layer indicating saturation. A nearby bore- hole drilled during the period of this study (C-17994) encountered Athi tuffs and old land surface sediments at 120-178 m. The major aquifer was encountered within the old land surface sediments. The borehole log profile agrees more with the resistivity model across the fault where the Athi tuffs and old land surface appear as one geoelectric layer.
The resistivity curves obtained in this study can fall under any of the following:
i. Profiles where resistivity is higher at the ground surface but consistently falls with depth. This shows that no ad-
vantage can be obtained by placing foundations deep into the ground unless geotechnical investigation results
indicate that thin but strong subsurface layers can provide a rafting effect on the underlying weak materials;
ii. Profiles where resistivity remains below 35 Ohm-m up to 30 m depth with only slight variations. This shows that deeper foundations will not necessarily provide safer structures. Cyclic distress is often reported in structures supported on these subsoils;
iii. Profiles where resistivity is low at the ground surface but increases with depth up to 10 m, falls to 30 m then rises.
Better foundations can be placed above 10 m or below 30 m subject to confirmation through geotechnical investi-
gations;
iv. Profiles where resistivity increases with depth from 10-ohm-m to >480 Ohm-m. This shows that deeper founda-
tions could be more advantageous.
v. Profiles where resistivity decreases with depth to a low at about 10 m and then rises marginally, falls and rises.
These areas are dominated by weathered/ fractured rocks and alluvial and old land surface sediments and so the
strength of the foundation will be determined by the supporting subsoil.
This study traced faults in boreholes to determine their possible association to soft spots and to the variation of the character of subsurface materials in boreholes and at building sites. Boreholes with fault traces are concentrated at the City Centre, Industrial Area, Lower Kabete, Muthaiga and Karen-Ngong’ areas; these areas have the largest concentra- tion of water supply boreholes. Twenty three (23) fault traces were delineated in the boreholes across the study area. The nature of fault traces in the wells indicates that they are concealed underground. The results also show that the traces are dominated by clays or alternating layers of weak and strong materials. The resistivity values of the subsurface materials at the fault traces are generally less than 65 Ohm-m. Resistivity survey can therefore be used to confirm the presence of faults at sites for heavy construction or underground excavation if the electrode spread is done along and across the sus- pected faults.
The geophysical resistivity survey was carried out in areas with known weak subsurface materials. Given the scatter of the sites on the map, it can be concluded that weak materials occur across the study area. The results of the geophysical resistivity survey indicate that the Nairobi subsurface consists of five different geoelectric profiles as indicated by similar- lity of the shapes of the curves, with strata having resistivity values in the range of 4.3 Ohm-m to 480 Ohm-m. Though similar, the number of layers detected in each profile is variable. In areas dominated by clays or alternating layers of weak and strong materials, the resistivity remains below 100 Ohm-m and this represents 30 sites (approximately two-third) of the study area. Electrical geophysical resistivity can be used to determine stratigraphic information at a site for deep/ heavy construction in order to delineate soft spots and weak materials within the profile. Geotechnical investication of the weak spots within the site would then detect any variation that can pose challenges in building structures that can stand the test of time.
ACKNOWLEDGMENTS
This research was carried through the sole financial assistance given by the International Foundation for Science (IFS) un- der Grant No. W/4655/1. The authors also appreciate Masinde Muliro University for administering the IFS grant, the City Council of Nairobi for the authorisation to carry out the research, the Ministry of Water and Irrigation for hydrogeological IJSER © 2014
http://www.ijser.org
International Journal of Scientific & Engineering Research, Volume 5, Issue 7, July-2014 1239
ISSN 2229-5518
data, and, Prof. Justus Barongo of the Department of Geology, University of Nairobi for allowing access to the Earth Im- ager Software.
REFERENCES
[1] E.A.L. Gevaerts, “Hydrogeology of Nairobi Area”, Technical Repot, 1964, Survey of Kenya.
[2] H.L. Sikes, “Underground Water Resources of Kenya Colony”, Crown Agents, 1934, London.
[3] E. P. Saggerson, “Geology of the Nairobi Area”, Degree Sheet No 51, 1991, Survey of Kenya.
[4] Ministry of Works, “Foundation Conditions in Nairobi City Centre”, Materials Branch Report No 198, Republic of Ken-
ya, 1985.
[5] Ministry of Works, ”Foundation Conditions in Nairobi City Centre”, Materials Branch Report No 182, Republic of Kenya,
1969.
[6] C. Onyancha, E. Mathu, S. Mwea and W. Ngecu, “A study on the Engineering Behaviour of Nairobi subsoil”, ARPN Journal of Engineering and Applied Sciences Vol. 6 no. 7, pp 85-96, 2011.
[7] C. Onyancha, E. Mathu, S. Mwea, and W. Ngecu, “Dealing with Sensitive and Variable Soils in Nairobi City”, Interna-
tional Journal of Research and Reviews in Applied Sciences vol. 9 no. 2, pp. 282-291, 2011.
[8] G.S. Littlejohn, K.W Cole and T.W. Mellors, “Without Site Investigation Ground is a Hazard”, Proceedings of the Institu-
tion of Engineers Vol. 102, pp. 72-8, 1994.
[9] Institution of Civil Engineers, “Inadequate Site Investigation”, Thomas –Telford, London, England, 1991.
[10] National Research Council, 1984, Geotechnical Site Investigations for Underground Projects, US National Committee on
Tunneling Technology, National Academy Press, Washington, USA,.
[11] B. Collingwood, “Geotechnical Investigations for Pilling Projects- The False Economy of a Cheap Site Investigation”,
Australian Geomechanics, Vol. 38 pp. 41-48 2003.
[12] J.S. Goldsworthy, M.B.Jaska, W.S. Kaggwa, G.A. Fenton, D.V. Griffiths and H.G. Poulos, “Cost of Foundation Fail- ure Due to Limited Site Investigations”. International Conference on Structural and Foundation Failures, Singapore,
2004.
[13] A.G. Batte, A. Muwanga and W.P. Sigrist, “Evaluating the Use of Vertical Electrical Sounding as a Groundwater Ex- ploration Technique to Improve on the Certainty of Borehole Yield in Kamuli Location (Eastern Uganda)”, Africa Journal of Science and Technology, Science and Engineering Series, Vol. 9 pp. 72-85, 2008.
[14] A. Hove, “Sectorial Study and National Programming for Community and Rural Water Supply, Sewerage and Water
Pollution Control”, Report No. 7, Groundwater Resources in Kenya, World Health Organization, Brazzaville, 1973.
[15] I. L. Solberg and R. Sandven, “Resistivity Measurements as a Tool for Outlining Quick-clay Extent and Valley-fill Stratigraphy: a Feasibility Study from Buvika, Central Norway”, National Research Council, Research Press Website at cgj.nrc.ca, 2008.
[16] S. Kahraman, E. Ogretici, M. Fener, and T. Yeken, “Predicting the Physico-mechanical Properties of Igneous Rocks
from Electrical Resistivity Measurements”, European Regional ISRM Symposium, Liege, Belgium, EUROCK’06, pp. 557-
560, 2006.
[17] S.H. Ward, “Resistivity and Induced Polarization Methods: in Geotechnical and Environmental Geophysics”, Society of Exploration Geophysicists, 1, 1990.
The authors declare that there is no conflict of interest regarding the publication of this paper.
1Senior Lecturer, Civil and Structural Engineering Department, Masinde Muliro University of Science and Technology, Kakamega, Ken- ya. E-Mail: conyanja@yahoo.com
2Associate Professor, Department of Geological Sciences, Southern Eastern University College, Kitui, Kenya
3 Associate Professor, Department of Civil and Construction Engineering, University of Nairobi, Nairobi, Kenya
4 Associate Professor, Department of Geology, University of Nairobi, Nairobi, Kenya
IJSER © 2014 http://www.ijser.org