optical communication. It can be compensated with inclusion
International Journal of Scientific & Engineering Research, Volume 3, Issue 4, April-2012 1
ISSN 2229-5518
Gain Flattening and Noise Figure Analysis of a Dual Stage Bowtie WDM EDFA Configuration in C-Band
Ricky Anthony, Sambhunath Biswas
Abstract— The paper presents an improved gain flattening and noise figure analysis in the C-band regime using an equalization filter of a dual stage single mode polarization maintaining bowtie erbium doped fiber amplifier. The configuration uses two in-line 980nm laser pumps. The gain and noise figure variation with fiber length, pump power and temperature of the system for C-band communication have been investigated. W ith equalization filter, a gain and noise figure flatness (p-p) of just 1.1dB and 2.3dB respectively, in 1530-1565 nm BW, for optimized 150 mW and 250 mW pump lasers was obtained. The gain has also shown temperature dependent variation, with minimum fluctuation of 0.71dB at 200C. Based on results, the system feasibility as in C-band communication has been discussed.
Index Terms— Erbium doped fiber amplifier, Bowtie polarization maintaining fiber, Giles model, McCumber’s equations, C-band, Gain flattening, Noise figure, Equalization filter.
—————————— ——————————
he ever increasing demand for high speed data communi- cation over long distances with minimal of losses have paved way for the erbium doped fiber amplifiers (EDFA)
as in-line and pre-optical amplifiers and data carrying medium, hence becoming an obvious replacement for electronic rege- nerative repeaters for low amplified spontaneous noise (ASE) level. It has also shown wide bandwidths, lower noise figure and polarization insensitivity. The EDFA however has been successfully commercialized as a potential mean for data communication in conventional or C-band (1530-1565nm), long or L-band (1570-1620nm) region, and recently possibilities of short or S-band (1460-1530nm) as an effective communication channel have been explored [1, 2].
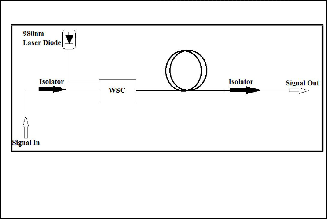
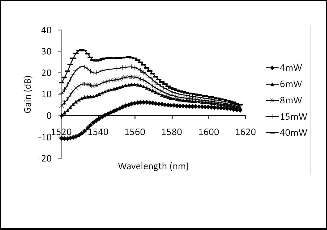
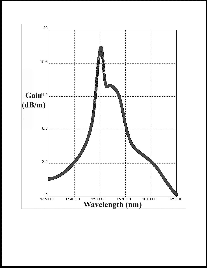
The introduction of wavelength division multiplexing (WDM) with rare earth doped amplifier such as EDFAs as power boosters and pre-amplifiers have increased the channel capaci- ty to as high as 69.1 Tb/s over 240 km [3]. Figure 1 and 2 shows the standard co-directional EDFA pumped with 980nm laser and the EDFA gain spectrum obtained using EDFA GainMas- terTM simulation tool, respectively. Such a wavelength selective variation of gain in case of a multiple wavelength input signal with same power would lead to large output power differenc- es, giving poor signal to noise ratio (SNR) among various channels. This phenomenon gets particularly prominent dur- ing small signal analysis. Hence, this largely restricts EDFA application in a narrow band region which is undesirable for
of equalization filters, fiber Bragg gratings (FBG) or Mach- Zehnder interferometer in the system [4]. Other approaches include inherent gain flattened EDFA such as asymmetric twin core (ATC) EDF which has a gain spectrum flattened within ±1 dB over 32 nm range [5].
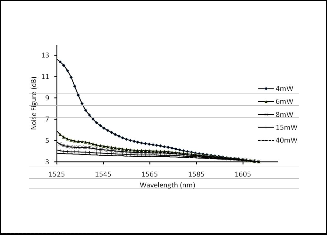
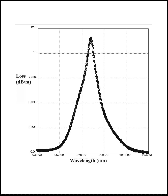
In case of cascaded WDM systems, use of narrow band filters after each stage would increase ASE and saturate the subse- quent amplifiers and hence reduce the gain in each stage. The noise associated with EDFA is due to ASE (forward and back- ward), which has a spectrum almost the same as the gain spec- trum and needs to be reduced, especially the forward ASE, which propagates in the direction of the signal, to make EDFAs more incompatible for long haul communication. Figure 3 shows the noise figure (NF) associated with co-directional EDFA configuration as a function of wavelength.
————————————————
Ricky Anthony is currently pursuing Masters Degree program in Electronics and Communication Engineering in Heritage Institute of Technology, India, PH-09748998348. E-mail: ricky.j.anthony@gmail.com.
Dr.S.N.Biswas is the Deputy Director and Senior Professor of Heritage Insti-
tute of Technology, India, PH-09231509082. E-mail: s.biswas@rediff.com.
Fig.1. A standard co-directional 980nm pumped EDFA configura- tion.
optical communication. It can be compensated with inclusion
IJSER © 2012 http://www.ijser.org
International Journal of Scientific & Engineering Research Volume 3, Issue 4, April-2012 2
ISSN 2229-5518
Fig.2. Gain (dB) vs wavelength (nm) for different pump powers in a co-directional 980nm pumped EDFA configuration.
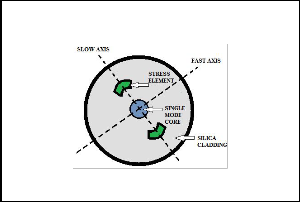
Fig.4. Cross-sectional view of a SM Bowtie EDF
The following table gives all the specifications associated with the bowtie EDF used for the analysis of dual stage gain flat- tened configuration.
TABLE 1.
BOWTIE EDFA SPECIFICATION
Fig.3. Noise Figure variation with signal wavelengths for different pump powers.
Reduction of fiber losses and gain variation depends on the erbium doped fiber and its characteristics considerably. The dual stage configuration presented in this paper is based on specialty polarization maintaining (PM) bowtie single mode (SM) erbium fiber, shown in figure 4. Even though erbium doped fiber (EDF) are polarization independent, but some of the Er+3dopant ions may have certain polarization, giving a polarization dependent gain (PDG). This is because there is a polarization offset between the input signal laser and the pump laser. Other such PM fibers include PANDA and ellip- tical jacket fiber.
First developed by Optical Fiber Group at University of Sou- thampton in 1982 [6], the bowtie based PM induces birefrin- gence when the fiber core experiences tension due to fiber drawing. This is because the core is guarded by boron-doped glass bow-ties which can shrink more compared to its silica based surrounding cladding. The birefringence produced, al- lows the incident light along the “slow axis” to travel at lower velocity compared to the light incident along the “fast axis”. This velocity change along the two axes makes the cross- coupling of light difficult and rare, maintaining the polariza- tion. Hence, greater is the stress applied; larger is the differ- ence in the propagation constant. Both bowtie and PANDA today find extensive use in telecommunication industry as optical modulators, sensors, interferometers and gyroscopes.
Obtained from Fibercore DHB 1500 datasheet.* nm = nanometer, m =
micrometer, dB = decibel, m = meter.
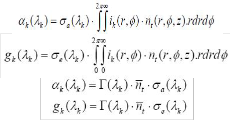
Modeling of EDFA for simulation and performance analysis is largely based on the landmark work by C.R.Giles and E.Desurvire [7] in 1992. The EDFA model utilizes giles para- meters which comprise of the wavelength dependent, absorp- tion coefficient α (λλ) and gain coefficient g*(λλ). The absorp- tion coefficient is also dependent on the erbium ion concentra- tion, and calculated with all laser active ions are in ground state. The gain coefficient or the emission spectra on the others hand is calculated with laser active ions in the excited level. Both α α(λλ) and g*(λλ) are dependent on absorption cross sec- tion, σa(λλ) and emission cross-section , σσe(λλ) respectively and given by the equation:
(1)
(2) (3)
(4)
IJSER © 2012 http://www.ijser.org
International Journal of Scientific & Engineering Research Volume 3, Issue 4, April-2012 3
ISSN 2229-5518
Where Г (λλ) is the overlap factor between the optical mode field and erbium ions (shown in fig.5), which results in stimu- lation absorption or emission from Er3+ transitions and ηt is the total Er3+ ion density, which can be measured experimentally using X-ray photoelectron spectroscopy (XPS), also known as electron spectroscopy for chemical analysis (ESCA) [8]. The overlap factor is a function of with D and r in spherical coor- dinate system with D as constant and ‘b’ is the radius of the Er3+ doped region.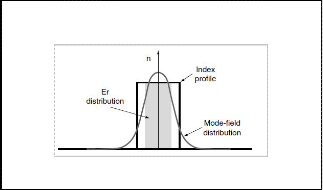
Fig.6. The absorption parameter spec- tra of (a) pump (b) signal band and (c) gain spectra of Bowtie PM SM EDFA.
Fig.5. Interaction of Er3+ distribution with optical mode field.
These equations are however based on the assumption that parasitic losses such as scattering losses are minimal, Er3+ is uniformly distributed in the core and gain is dependent on laser transition only. Fig.6 (a), (b) and (c), shows the absorp- tion parameter for both signal band and pump band, and gain parameter spectra of PM single mode (SM) bowtie EDF ob- tained from simulation. It is also assumed that no ion-ion inte- raction is present.
The Giles algorithm solves the propagation equation (5) by integrating in both backward and forward direction in an iter- ative manner until the solution converges.![]()
(5) Where, k signifies a definite signal, and uk is the beam propa- gation direction with values 1 and -1 for forward and back- ward propagation and Pok gives the contribution of the spon- taneous emission form the local excited state population n2 and is equal to mhvk∆vk., where m defines the number of pola- rization modes supported by the fiber.![]()
The fiber saturation parameter ζ (m-1s-1) is measured by reduc- ing the 980nm laser pump to the power where it reaches its saturation value. For an equivalent radius of doped region, beff, it is given by:
(6)
Under steady state condition of the EDFA with uniform dis- tribution for both upper and lower excited states, the steady state equation for population density at the upper level would be [7]:
(a)
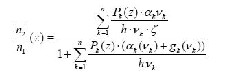
![]()
The intrinsic fiber power saturation, Psat (λ) is given by:
(7)
(8)
(b)
Where, h is the Planck constant, ν is the frequency for the sig- nal or the laser pump, A is the area of the doped region and τ is the lifetime of the metastable level.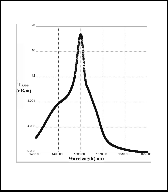
IJSER © 2012 http://www.ijser.org
International Journal of Scientific & Engineering Research Volume 3, Issue 4, April-2012 4
ISSN 2229-5518
The major source of noise in case of EDFA is the amplified spontaneous emission (ASE). During EDFA band transition, the stimulated photons are coherent in nature which contributes to amplification; however a photon in the excited state which is not stimulated within a lifetime of 10ms of the exited state contributes to spontaneous emission, which is incoherent in nature and is responsible for ASE noise (forward and backward). For a cascaded EDFA configuration, the ASE keeps on increasing at each successive step, hence reducing the overall gain of the system. This can be attenuated with the introduction of optical filters. But in long haul systems, with
200 amplifiers [9], the 1530nm have shown large attenuation whereas 1560nm peak have shown sharp rise. This shift in ASE power is attributed to wavelength-dependence nature of absorption and emission cross-sections, and saturations of the amplifier at each stage. Recent surveys have shown utilization of backward ASE power for simultaneous gain flattening at C and L-bands [10, 11].
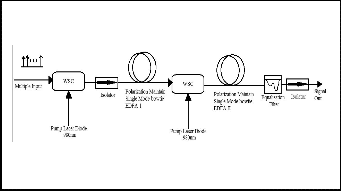
The EDFA configuration (as shown in fig.7) under analysis had a multiple source with frequencies ranging from 1530nm to 1565nm with 15 channels of 0.01mW/channel simulated using EDFA GainMasterTM. It was coupled with 980 nm pump laser by means of wavelength division multiplexing (WDM) with 200GHz spacings according to ITU standards, to PM SM bowtie EDFA. The output was again coupled to another
980nm pump laser using WDM and its output is filtered using an equalization filter to obtain a relatively flattened gain and NF. Optical isolators were used to avoid backward ASE power back into the source.
Fig.8. The gain flattened curve for various pump power combinations as a function of wavelength.

TABLE 2
GAIN CHARACTERISTICS FOR DIFFERENT PUMP POW ERS
Fig.7. Schematic Diagram of a Dual Stage Gain Flattened EDFA
configuration
The gain spectrum for various combinations of pump powers for both the pump lasers was simulated and optimized (shown in Fig.13). It was found that with 150 mW, 250 mW pump power lasers I and II respectively with 5 m EDFA lengths, gave a flat gain spectrum variation of just 1.1dB for the entire C-band. As the pump power decreased, the gain spectrum showed larger variation in the C-band region. The table 2 gives the comparison of the gain variation for different pump powers. Such a flat gain system finds application in CATV and analog systems.
The primary source of noise in any doped fiber amplifier (DFA) system is because of the presence of amplified sponta- neous emission (ASE), which extends the entire gain spec- trum. It was assumed in the simulation that ASE extends from
1520nm-1620nm. With the inclusion of an equalizer filter, the
NF was found to be as low as 7.48dB which increased to
9.80dB over the entire C-band for gain-flattened optimized
pump powers of 150mWand 250mW each (fig 9). This also
indicates that for C plus L-band configuration would require
two individual filters, since the NF increases as the wave-
length approaches L-band regime. Comparison Table 3 gives
the NF variation for different pump powers. For a cascaded
system, the ASE accumulates at each stage reducing the
overall gain at the output.
IJSER © 2012 http://www.ijser.org
International Journal of Scientific & Engineering Research Volume 3, Issue 4, April-2012 5
ISSN 2229-5518
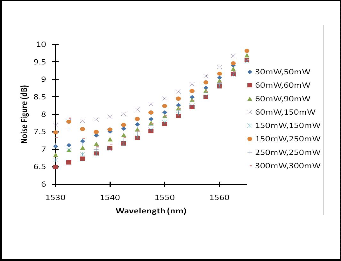
Fig.10. Schematic Diagram of a Dual Stage Gain Flattened EDFA
configuration
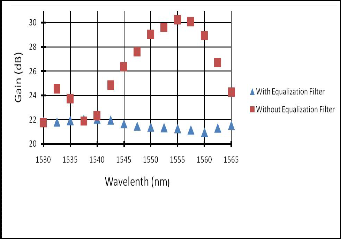
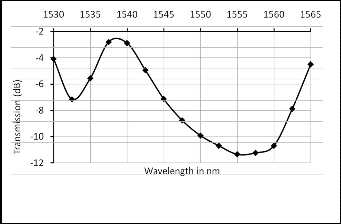
Fig.9. Schematic Diagram of a Dual Stage Gain Flattened EDFA
configuration
TABLE 3
NOISE FIGURE CHARACTERISTICS FOR DIFFERENT PUMP POW ERS
Fig.11.Equalization Filter transmission spectrum at 1530-1565nm regime.
The gain spectrum can be controlled either by changing fiber host properties, improving measurement techniques and em- ploying new EDFA system designs. This paper uses a dual stage design, gain flattened by an optical filter. An optical gain equalization filter such as fiber grating filter is one of the most common ways to reduce the gain peaks to provide an equa- lized output. In the dual stage configuration under considera- tion, the primary peak obtained in the absence of filter for a
150 mW, 250 mW pumped laser and 5m EDF length is 24dB and, the secondary peak occurs at 30dB (fig 10). These peaks are reduced considerably in the presence of filter as shown in figure obtained from simulations. The transmission spectrum of the filter is shown in fig 11, which clearly indicates that the filter has spectrum inverse to that of the two stage EDFA sys- tem. The NF depends on the position of the filter in the sys- tem, and so the equalization filter was strategically chosen to be placed at the end of the second stage.
because after propagating through a certain distance in the
optical fiber, the pump power reduces due power absorption.
Hence designing of an EDFA requires prior consideration of
pump power and EDFA length. Fig 12 shows the gain depen-
dence secondary EDFA for different channel wavelength. As
seen from the graph, channels with higher frequency fall off
quickly compared to channels with lower frequency. This be-
comes a limiting factor for WDM based optical communica-
tion.
The C-Band flattened gain undergoes temperature variation,
according to the changes in ion energy levels in accordance to
McCumbers equations [12]:![]() (9) Where, k is boltzman’s constant, h is Planck’s conctant, T is temperature in degree kelvin and λ0 is the cross-over wave- length. During the simulation, source and detector was consi- dered to be temperature independent. Such temperature fluc- tuations have shown to have affected signal to noise ratio (SNR) and increased bit error rates (BER) for some channels
(9) Where, k is boltzman’s constant, h is Planck’s conctant, T is temperature in degree kelvin and λ0 is the cross-over wave- length. During the simulation, source and detector was consi- dered to be temperature independent. Such temperature fluc- tuations have shown to have affected signal to noise ratio (SNR) and increased bit error rates (BER) for some channels
IJSER © 2012 http://www.ijser.org
International Journal of Scientific & Engineering Research Volume 3, Issue 4, April-2012 6
ISSN 2229-5518
compared to other [13]. The fig 13 shows the gain fluctuation over a temperature range of 00C to 50oC over the C-band. The temperature coefficient of an EDFA is positive below 1540nm and negative above it. And for conventional equalization fil- ters the temperature coefficient is positive below 1535 nm and negative above it. For an equalization filter based gain flat- tened EDFA configuration, above 1535nm the gain spectra of EDF and filter transmission spectra cancel out, whereas below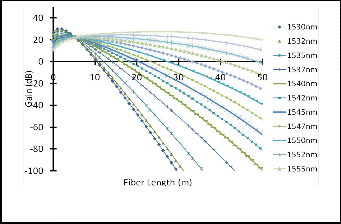
this wavelength they reinforce, giving overall gain spectra as obtained in figure 18 from simulation. Table 4 shows the rela- tive gain variations at different temperatures.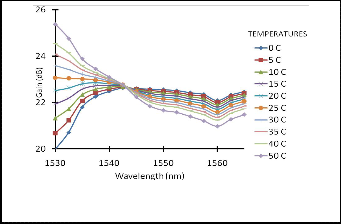
Fig.12. Gain variation with amplifier length for 14 different channels
Fig.13. Effect of temperature on gain flattened curve within 1530-
1565nm.
TABLE 3
GAIN VARIATION WITH TEMPERATURE
The Gain flattening and NF for a bowtie dual stage PM SM EDFA based system depends on pump power, EDF length and operating temperature. The paper has successfully presented the feasibility and limitations of using polarization maintain- ing single mode bowtie EDF in C-band communication. The strategically positioned equalization filter provided a peak to peak flatness of just 1.1dB and 2.3dB of gain and NF over
35nm range, respectively. However the system faces serious challenges with increasing length with restricted pump power. Temperature analysis of the system, the gain fluctuation has shown its dependence on temperature coefficient of the fiber. The minimum gain variation was obtained at 200C operative temperature. It puts another limitation to the system, especial- ly with its deployment in extreme geographical areas.
The authors would like to thank Prof. Siladitya Sen, Head of the Department, Electronics and Communication Engineering, Heritage Institute of Technology, for his suggestions and sup- port during the work.
[1] J. B. Rosolem, A. A. Juriollo and M .A. Romero, “S Band EDFA Using
Standard Erbium Doped Fiber,” Electronics Letters Oct. Vol. 43 No.
22, (2007).
[2] S. A. Daud et. Al, “An Experimental Study on S-band Depressed
Cladding EDFA”, proc. IEEE National Conference on Telecommuni- cation Technologies (2008).
[3] A.Sano et.al “Ultra-High Capacity WDM Transmission Using Spec- trally-Efficient PDM 16-QAM Modulation and C- and Extended L- Band Wideband Optical Amplification," J. Lightwave Technol. 29, p.p.578-586 (2011).
[4] M. Tilsch, C.A. Hulse, K.D. Hendrix, R.B. Sargent, "Design and dem- onstration of a thin-film based gain equalization filter for C-band EDFAs", proc. NFOEC conference.
[5] B. Nagaraju, Pratima Jiaswal, R.K.Varshney, B.P.Pak, “Aninherently gain flattened EDFA design based on asymmetric twin core fiber,” ICOP-International Conference on Opticas and Photonics, Chandi- garh, India, 2009.
[6] R.D Birch et.al., “Fabrication of polarization maintain fibers using
gas-phase etching”, Electronics Letters, 18(24), p.p.1036-1038 (1982).
[7] C.R.Giles and E.Desurvire,” Modeling of erbium doped fiber am-
plifiers”, J.Lightwave Tech. 9 (2), 271 (1991).
[8] Y.Tteyam et.al, “Correlation between the basicity and optical proper- ty of Er3+ ion in oxide glasses”, Materials Science and Technology, Vol.1 (2006).
[9] Alan E. Willner, S.M.Hwang,” Transmission of many WDM channels through a cascade of EDFA’s in Long-Distance links and ring net-
Networks”, Journal of Lightwave Techn., Vol.13, No.5 (1995).
IJSER © 2012 http://www.ijser.org
International Journal of Scientific & Engineering Research Volume 3, Issue 4, April-2012 7
ISSN 222S-5518
[10] V.Sinivasagam, K.Dimyati, R.D.Singh and A.Mustafa, "C-Plus L
band EDFA with over 70nmoperating range", IEEE TENCON (2004). [11] S.K.liaw et.al., "Investigate C+L band EDFA / Raman Amplifiers by
using the same pump lasers", Proc. Of IEEE JCIS (2006).
[12] D.McCumber," Theory of phonoterminated optical masers," Phys.
Rev.,vo1.134, p.p. A299-A306 (1964).
[13] W.J.Lee et.al.," Simulation for the effect of cascaded Gain tempera
ture fluctuations", IEEE CLEOY (1999).
IJSER lb)2012
http://www.ijserorq