Focusing to Infinitesimal
Berker Hüsam
Abstract: Fousing incoming coherent light to infinitesimally small spot with hologram and micro-sized aperture configuration reported. The design uses the optical Fourier transform in far field with Frauhoffer approximation.
1. INTRODUCTION
Lenses have been used in various applications: from astronomy to lithography. In some of the applications such as laser micromachining [1]
and optical tweezers [2], the maximum intensity over area, the focal spot, is
vital. Due to the aberrations of lens, the focus is not a singular point, so that the refracted waves after lens achieve some other points around focus [3]. Furhermore, the minimum spot size is limited, which is expressed by Rayleigh range [4].
By different approaches, this problem had tried to be solved. Negative refraction makes possible to focus with less aberration [5]. Dielectric properties of materials employed by [6], which uses silver as a layer to overcome the limit.
An interesting approach to obtain the small focal spot uses nano scaled cones that are bounding intensity distribution under limit [7]. Micro-scaled slits drilled on metal screens gave also another way to access smaller spots
[8]. Nano holes, which uses the idea of slits creates perfect focusing [9].
Nano-scaled diffraction elements which are having periodic nano structures on surface [10,12] are performing far better optical transfomations than
1. The aperture should too much small against the total distance (d)
to output plane (Relation (2) already pointed this out).
2. The input f function should be something whichs Fourier transform coverges to a single point.
The nano-scaled apertures used in [8,9,10,11,12], achieved to surpass diffraction limit, which is uses the implication 1. On the other hand,
obtained diffraction patterns at the output plane have side lobes. For
example, rectengular aperture has a Fourier equivalent as a sinc function
[3], or for circular aperture, the output is airy pattern [3].
Second point gives an idea to have an aperture, whichs spectral transform is simply a Dirac-delta function. This could be obtained by using a Computer Generated Hologram (CGH) before aperture, so this compostion of
hologram and aperture holds the desired output. The setup is simply
illustrated in Figure 1.
Reference
lenses. Photon sieve, which is having many pinhole structure [11] is another
diffractive element, which is sharing the success of other discussed methods.
In this paper, a simple configuration presented to obtain an infinitesimal
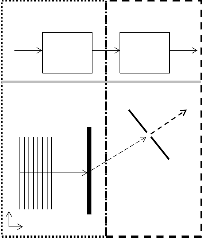
focal spot, which constrains to pass the abilities of current techniques. As it can be seen in the next step, artificially created wavefront via hologram enters to an optical Fourier transform by the help of micro-scaled aperture,
Wave
Decoding f
Hologram
Fourier F
Transform
F
which holds Fraunhoffer approximation.
2. THEORY
Impulse response function in free space propagates with the transfer function [3]:

where . Here, is the wavelength and is the
Reference
Wave
x
z
f
Hologram
Aperture
(Window)
covered distance of propagating wave in z direction. This is the Fresnel approximation. For a given input, f, the output, g, can be obtained by the convolution of input and free space transfer function:
This gives:
Figure 1 Illustration of Configuration- Recorded wavefront decoded by reference wave and aperture makes the transform.
To have after Fourier transform, the hologram should give as output, while is the frequency that centers in spectral axis.
The hologram equation is [13]:

With Frauhoffer approximation [3]:
(1)
(2)
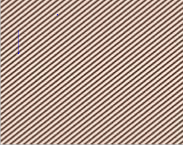
(5) Equation (5) is mathematically expressing intensity of interference of reference wave ( ) and desired wave ( ), which are having (x,y) spatial coordinates. This intensity pattern ( ) encoded by help of the equation and in Figure 2, the obtained is shown.
w WOx
0y


In approximation (2), is the Fresnel number and a is the aperture size. After now, f will be considered as a window (aperture), which transmits the incident wave. Taking the remaining quadratic terms outside of the integral, Equation (1) becomes:

and diffraction pattern is:


(3)


(4)
Figure 2 Computer Generated Hologram- Consists of the cosine by using Equation (5). and are determining the spacing between extrema. This relatively simple pattern of hologram provides ease, while obtaining , the object wave (
Equations (3) and (4) give the Fourier transform of input as output. Another vital point to divulge is the meaning of : The integral in Equation (1) is in the form of Fourier transform, after using the relation (2). The argument of exponential function, , is simply
wyy . wx and wy are spatial frequncies.
Equation (4) gives two important clues to confine intensity into an
infinitesimal small field:
w0yy).
To decode the desired wavefront from the hologram, reference wave
illuminated the CGH. This gives the following pattern [13]:


(6)


Three terms appeared in Equation (6) as output ( ), which are background illumination ( ), the desired wavefront ( and its conjugate ( ). t is the transmittace coefficient of the holographic film, while and are the intensities of reference and object (desired) wavefront
respectively.
Not mentioned, but an important question should be answered: How good CGH produces an output, which is limited by means of resolution? Surely, the hologram will consist of discrete points (pixels), which means that its output will be discontinuos. As pointed out in [14], nevertheless, the obtained wavefront after hologram becomes continuous by diffraciton. Another fuzzy point is the selection of . Length of aperture will be in micrometre unit, thus, the change of phase of wavefront would be negligible in that scale. So, should be selected in a way that from one pixel to another, the change would be accounted. Fortunately, the desired wavefront as output has a linear phase distribution ( ).
3. SIMULATION
Equation (1) is used during investigation of proposed system. The aperture
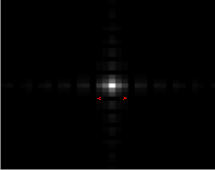
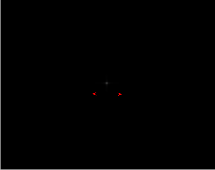
is taken as square with size of 1 and wavelength is 600 nanometre. For simplicity, the convolution performed by the help of Fourier transform with zero-padding. Convolution in spatial frequency domain becomes multiplication and inverse Fourier transform, afterwards, gives the output plane. Intensity patterns immediately after aperture and after 1 centimetre (d) are shown in Figure 3.
better apertures as phase masks can be fabricated on glass, which can power efficiently focusing.
REFERENCES
[1]. M. C. Richardson, A. Zoubir, C. Rivero, C. Lopez, L. C. Petit and K. A. Richardson, "Femtosecond laser microstructuring and refractive index modification applied to laser and photonic
devices", Proc. SPIE 5347, 18, 2004.
[2]. L. Novotny, R. X. Bian, and X.S. Xie, “Theory of nanometric optical Tweezers” Phys Rev Lett.,
79(4), pp. 645-648, 1997.
[3]. B. Saleh and M.C.Teich, "Fundamentals of Photonics", Wiley, pp. 120-123, 130,135-136, 1991
[4]. T. Poon and T. Kim, "Engineering Optics with Matlab", World Scientific Publishing, pp.97-98,
2006
[5]. J.B. Pendry, "Negative Refraction Makses Perfect Lens", Physical Review Letters, Volume 85, Issue 18, pp.3966-3969, 2000
[6]. N. Fang, H. Lee, C. Sun and X. Zhang, "Sub–Diffraction-Limited Optical Imaging with a Silver
Superlens", Science Vol. 308 no. 5721 pp. 534-537, 2005
[7]. Z. Xiu-Li, Fu Yong-Qi, W. Shi-Yong, P. An-Jin and C. Zhong-Heng,"Funnel-Shaped Arrays of
Metal Nano-Cylinders for Nano-Focusing", Chinese Phys. Lett. 25 3296, pp. 3296-3299, 2008
[8]. A.M.H. Wong, C.D. Sarris and G.V. Eleftheriades, "Metallic transmission screen for sub- wavelength focusing," Electronics Letters , vol.43, no.25, pp.1402-1404, 2007
[9]. P. Wei, W. Chang, K. Lee, and E. Lin, "Focusing subwavelength light by using nanoholes in a transparent thin film," Opt. Lett. 34, 1867-1869, 2009
[10]. F.M. Huang, T.S. Kao, V.A. Fedotov, Y.Chen and N.I. Zheludev, "Nanohole Array as a
Lens",Nano Letters, vol. 8, issue 8, pp. 2469-2472, 2008
[11]. Qing Cao and Jürgen Jahns, "Focusing analysis of the pinhole photon sieve: individual far-field model," J. Opt. Soc. Am. A 19, pp. 2387-2393, 2002,
[12]. Y. Cotte, M. F. Toy, E. Shaffer, N. Pavillon, and C. Depeursinge, "Sub-Rayleigh resolution by phase imaging," Opt. Lett. 35, pp. 2176-2178, 2010
[13]. K. J. Gasvik, "Optical Metrology", 3rd. Edition, Wiley, pp. 142-143, 2002
[14]. B. Brown and A.W. Lohmann, "Computer-generated Binary Holograms," IBM Journal of
Research and Development , vol.13, no.2, pp.160-168, 1969
Aperture
(a)
Aperture
(b)
Figure 3 Intensity Patterns- Immediately after aperture (a) and 1 centimetre later (b). It is important to emphasize that during simulation, the resolution kept lower to see the focal spot at (b).
Two noteworthy results should be accentuated: Output in Figure 3.a is solely in the form of sinc function, due to diffractions at the edges and after
1 centimetre, it would be hard to see something at output plane, unless the resolution kept lower, during simulation.
4. CONCLUSION
Confining the intensity inside infinitesimally small point discussed.

Simulation performed gave the expected result that justifies the proposal. One drawback is the wasted power. After hologram, nearly the square root of the total power ( ) used, according to Equation (6). Another cut comes after the exit of aperture, since it only transmits small portion of
wavefront.
Although this power dissipation. By the use of lithography, a phase mask with higher resolution can be implemented. Nevertheless, this quarter-cut pyramid structure ( ) is relatively hard to implement in nano scale, that is because the hologram used which has so simple pattern as seen in Figure 2.
Possible applications would be laser direct writing, lithography,
microscopy, optical tweezers. Consequently, with the proposed method,