International Journal of Scientific & Engineering Research, Volume 4, Issue 4, April-2013 1123
ISSN 2229-5518
Fingerprint Recognition Using Local Ridge
Attributes Only
Mela.G. Abdul-Haleem, Dr. Loay.E. George*
Abstract— Fingerprint recognition is always the key issue in intelligent technology and information security. Feature Extraction is a critical step in the recognition of fingerprint images. The performance of fingerprint feature extraction and matching processes decreases when handling poor-quality images. In this paper, we use a set of local ridge attributes and explain their effect on recognition performance in comparison with the case of using a combination of the local ridge attributes, minutia, and pores. The system has been tested experimentally using a database of 160 low quality fingerprint images. The test results indicated good system ability to signify low-quality fingerprint images even through with existence of partial loss in fingerprint images.
Keywords: Automatic Fingerprint Recognition Systems, Biometric, Fingerprints, Fingerprint Recognition, Edge Linkage, minimum distance classifier, Region of Interest.
—————————— ——————————
1 INTRODUCTION
INGERPRINT is the most widely used biometric charac- teristic for personal recognition because of the well known fingerprint distinctiveness, persistence, ease of acquisition, uniqueness, and stability over time [1, 2, 3, 4]. Fingerprint is a reproduction of the fingertip epidermis, produced when the finger is pressed against a smooth surface. The most evident structural characteristic of a fingerprint is a pattern of inter- leaved ridges and valleys [5]. Accurate and reliable fingerprint recognition is a challenging task and heavily depends on the quality of the fingerprint images. It is well-known that the fingerprint recognition systems are very sensitive to the noise or to the quality degradation, since the algorithms' perfor- mance in terms of feature extraction and matching generally relies on the quality of fingerprint images. For many applica- tion cases, it is preferable to eliminate low-quality images and to replace them with acceptable higher-quality images to achieve better performance, rather than to attempt to enhance the input images firstly [6]. Several factors determine the qual- ity of a fingerprint image: acquisition device conditions (e.g., dirtiness, sensor, and time), individual artifacts (e.g., skin en- vironment, age, skin disease, and pressure), etc. Many of these factors may lead to partial loss in fingerprint region within the
images.
Fingerprint quality is usually defined as a measure of the
clarity of ridges and valleys and the "extractability" of the fea-
tures used for recognition [7]. Generally, fingerprint attributes
can be divided into three levels. Level-1 attributes (i.e., overall
fingerprint ridge patterns) and Level-2 attributes (i.e., local
ridges attributes, like, minutiae) which are extensively studied
————————————————
Mela.G. Abdul-Haleem is currently pursuing masters degree program in Computer Science in Baghdad University, Iraq. E-mail: a.mayla@yahoo.com
Dr. Loay.E. George is currently computer deparment chief in college of Science in Baghdad University, Iraq. E-mail: Lo- ayedwar57@scbaghdad.edu.iq
and mostly employed in the existing AFRS. Level-3 attributes (i.e., ridges dimensional attributes), although they are still not widely used in the existing commercial automatic fingerprint recognition systems (AFRS) [8].
Most of the existing AFRS use the minutia features extracted
from fingerprints (like the terminations and bifurcations of
fingerprint ridges) for recognition [9]. Noise and distortion
during the acquisition of the fingerprint and errors in the mi- nutia extraction process mostly result in spurious and missing minutiae that easily degrade the performance of recognition rate. Another problem is that the rotation and displacement of the finger placed on the sensor, can lead to different images for the same fingerprint and only a partial common area will produce which produce a small number of corresponding mi- nutiae points such that they are not enough to get accurate recognition decision.
Compact solid-state fingerprint sensors are being increasing-
ly incorporated into keyboards and cellular phones for a wide range of civilian and commercial applications where user- authentication is required. The advent of solid-state finger- print sensors presents a challenge to traditional minutiae- based fingerprint matching. The problems with minutiae ex- traction can be more severe if the fingerprint is acquired using a compact solid-state sensor. They provide only a small con- tact area for the fingertip and, therefore, capture only a limited portion of the fingerprint pattern [10].
It is difficult to reliably obtain the minutia points from poor quality fingerprint images or from the small sensor images,
other local ridge features should be used for fingerprint matching. Matchers based on non-minutia features can be used to complement the minutia-based techniques [5, 3, 11, 12,
1]. Recently, the hybrid fingerprint matchers use more than one approach has been proposed.
Our research aims to investigate the behavior of the recogni- tion system accuracy using, non-minutia, local features of ridge in comparison with case of using a combination of local features of ridge, minutia, and pores. Both cases are applied
IJSER © 2013 http://www.ijser.org
International Journal of Scientific & Engineering Research, Volume 4, Issue 4, April-2013 1124
ISSN 2229-5518
on low quality fingerprint database. The system performance will investigated and the effectiveness of partial fingerprint features loss will be investigated.
In section 2 a brief review for some of the related works in fingerprint recognition is given. In Section 3, an illustration for the fingerprint recognition model is presented. Experimental results are reported in Section 4. The effectiveness of System parameters is given in 5 and some conclusions are outlined in
6.
2 RELATED WORKS
1. Ross et al. [11] have suggested the use of both minutiae and texture information to represent and match finger- prints.
2. Kryszczuk et al. [13] investigated the effect of pores in matching fragmentary fingerprints and they concluded that pores become more useful as the fragment size as well as the number of minutia decreases.
3. Jeo et al. [14] discussed the matching task of incomplete or
partial fingerprints. They attempted to match partial fin-
gerprints using singular ridge structures-based alignment
techniques. They indicated that such techniques failed when the partial print does not include such structures (e.g., core or delta), so they presented a multi-path finger- print matching approach that utilizes localized secondary features which are derived using only the relative infor- mation of minutiae.
4. Nandakumar and Jain [15] have suggested the use of both
minutiae and ridge information, but in their approach the
query image is aligned to match the template image using
only the ridges associated with the minutiae.
5. Marana and Jain [5] presented a new fingerprint matching
technique based on fingerprint ridge features. They com- bined a ridge based matching scores computed by the pro- posed ridge-based technique with minutia-based matching scores. This combination led to a reduction of the false non- match rate by approximately (1.7%).
6. Jea and Govindaraju [16], presented an approach that uses localized secondary features derived from relative minuti- ae information. They appeared that when fragmentary fin- gerprints with small fingerprint regions are given, it would be very possibly that no sufficient minutia is available.
7. Xie et al. [6] estimated the quality and validity of captured fingerprint image in advanced for the fingerprint identifi- cation system. They divided the existing estimated algo- rithms into: (1) those use the local features of the finger- print image, (2) those use the global features of the image. And, they addressed the problem of quality assessment as a classification problem.
8. Indra et al. [17] used ridge based coordinate system to ex-
tract the ridge features such as ridge length, ridge count,
ridge type, and curvature direction in low quality images.
3 FINGERPRINT RECOGNITION SYSTEM
The fingerprint recognition problem can be grouped into three
sub-domains: (1) fingerprint enrollment, (2) fingerprint verifi- cation and (3) identification. Verification is typically used for positive recognition, where the aim is to prevent multiple people from using the same identity. Fingerprint verification is to verify the authenticity of one person by his fingerprint. There is one-to-one comparison in this case.
The general structure of the proposed fingerprint verifica- tion system is shown in fig. (1). A fingerprint biometric tem- plate based system is developed. It is consist of four major stages: preprocessing, blocking, feature extraction, and match- ing (or enrollment).

Fig. (1): Fingerprint recognition system
3.1 Fingerprint Image Processing
Real-time image quality assessment can greatly improve the accuracy of verification system. The good quality images re- quire minor pre-processing and enhancement. Conversely, low quality images require major preprocessing and en- hancement. This stage and its main content in a fingerprint verification system are shown in Fig. (1). The main steps in- volved in the pre-processing stage may include: enhancement, binarization, extraction region of interest (ROI) area, thinning.
1. Image Enhancement: it is applied to improve the detection of important image details. The main steps involved in the image enhancement process are:
A. Convert to gray-scale image
B. Segmentation (Global threshold):
C. Calculating the gray-scale statistics.
D. Normalization.
E. Applying a Gaussian filter.
2. Image Binarization: binarization is the process of turning a gray-scale image to a black and white image. The local thresholding method is adopted. As beginning step, the threshold assessment process is applied; it starts with cal-
IJSER © 2013 http://www.ijser.org
International Journal of Scientific & Engineering Research, Volume 4, Issue 4, April-2013 1125
ISSN 2229-5518
culating the average intensity value in a large block sur- rounding the certain area of the image. Then it is used as a leading parameter to the threshold value, then all the pix- els belong to a small block lay within the central area of the large block are binarized by comparing its value with the determined threshold value to decide whether each pixel belong to ridge or background. The width of the smaller block is set BL and the width of the larger block is BL + 2d. The heights of both blocks are calculated in the same man- ner.
3. Extraction of Region of Interest): The objective of this stage
is to locate the actual region in the fingerprint image de- picting the finger area and discard the regions of the image containing irrelevant information.
4. Hole/Island Removal: This process seeks to fill up all the holes founded in the ridges body. It is important because
holes will reduce the accuracy of the thinning algorithm.
5. Image Thinning: This step aims to eliminate the redundant
pixels of ridges till the ridges are of just one pixel wide.
6. Noise Elimination: This module will remove unwanted
noise.
7. Edge Linkage: In this research, a simple and fast edge-
linking algorithm is introduced to detect and fill in the gaps between edge segments. it implies the following steps:
1) Detection of all ridge endpoints: the first step in the linking process is to scan the image by moving a (3x3)
window across the picture and to find out which edge point represents end point (i.e., terminal point). As defined by Zhu et al. [18], an edge point is considered as an end point if it has only one neighbor edge pixel in its 3x3 neighborhood.
2) At each endpoint, check the direction of the ridge in order to draw the extrapolation line in the correct di- rection. The average of the first four connected neigh- bors to the end point is allocated and used to deter- mine the extrapolation line. If the end point has less than four neighbor points, then this end point will be ignored.
3) Seek for other end point in the area surrounding ex-
trapolation line: Extra_ polation line means creating a
tangent line to the right line and passes through the
end point known data and extending it. First, the
maximum allowed number of pixels of the extrapola- tion line must be predefined. If the ith pixel of this line is another end point then a line is drawn between the first end point and ith pixel using Bresenham's al- gorithm. If no end point is found then the pixels on both sides of extrapolation line and be neighbor to this ith pixel are also checked.
4) Search Stopping Criteria: The process terminates
when no endpoints are found within the scanning
window area.
3.2 Image Partitioning:
In order to avoid the recognition failure caused by the appear- ance of partial loss of the fingerprint region, the image is di-
vided into overlapping blocks. The overlapping is adopted to suppress the shifting effect and the partial local distortion which may occur at any place of fingerprint. The value of overlapping length is taken as a ratio of block length. The block length is obtained by dividing the image length by the number of blocks. Both the number of blocks and overlapping ratio values is tested to find their suitable values which lead to best cognition rate. We must notice that the width and height of the image may be not equal, so the block dimensions (i.e., width and height) may not equal. In order to handle this prob- lem the shortest dimensions of the image is padded by adding empty rows or columns on both sides of the image. After par- titioning, the features are extracted from each block.
3.3 Feature Extraction:
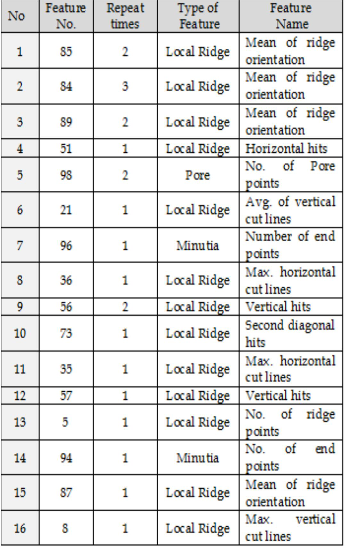
The most important step for any recognition process per- formed either by a machine or by a human being, is the selec- tion of a set of discriminatory features and to put the required algorithms for extracting (measuring) these features. It is evi- dent that the number of features needed to successfully per- form a given recognition task depends on the discriminatory qualities of the chosen feature [19]. Most of the published re- searches included two local ridge features: ridge orientation and ridge frequency. In our research, another local ridge fea- tures are proposed. These features are explained in Table (1).
Table (1): Local ridge features

The extraction of these features illustrated in algorithm (1). Algorithm(1): Local ridge features
Goal: Extraction of local ridge features
Inputs: Win() // block of the image
Wy // the height of the block
W // the width of the block
Output: no_points, maxv, minv, mid_v, maxh, minh,
mid_h, hits_x, hits_y, hits_diag, hits_2diag, mid_ori, mean_ori
IJSER © 2013 http://www.ijser.org
International Journal of Scientific & Engineering Research, Volume 4, Issue 4, April-2013 1126

ISSN 2229-5518
Step 1 : Calculate the number of ridge points
Initialize pixel summation. For all pixel in Win()
Check if it is the ridge point (pixel =1).
Increase pixel summation.
End if
End for
no_points ← pixel summation
Step 2 : Calculate the maximum and minimum and average
of vertical cut lines
For all horiziontal line// ii=xs→xe
S←0// initialize pixel summation
For all vertical line // jj=ys→ye
Check if Win(ii,jj) = 1 Then Increase S; End If
End for
Check if ii = first row(xs) Then
minv ← S;
maxv ←S;
End If
Check if maxv < S Then maxv ← S; End If
Check if minv > S Then minv ← S; End If
End for
mid_v ← (maxv + minv) / 2;
Step 3 : Calculate the maximum and minimum and average of horizontal cut lines
For all vertical line
S←0// initialize pixel summation
For all horiziontal line
Check if Win(ii,jj) = 1 Then Increase S; End If
End for
Check if ii = first column (ys) Then
minh ← S; maxh ←S;
End If
Check if maxh < S Then maxh ← S; End If
Check if minh > S Then minh ← S; End If
Check if Win(ii, jj) = 1 Then S ← S + 1; End If
End If
End for
hits_diag ← S;
Step 7 : Calculate second diagonal hits
S ← 0;
For all pixel in block // ii as row, jj as column
Check if ii = Wy - jj - 1 Then
Check if win(ii, jj) = 1 Then S ← S + 1; End If
End If
End for hits_2diag ← S;
Step 8 : Calculate the average and mean of orientation
Initialize counter;
For all ridge pixel in the block // ii as row, jj as col-
umn
Win1(ii,jj)←Win(ii,jj);
End for
For all ridge pixel in the block // ii as row, jj as col-
umn
Initialize counter2;
Put the pixel position in disp(); //disp is an array of position
Step 8.1 : Start perform chain code
Trace the ridge start by this pixel with 3x3 Struc-
ture;
Do
Step 8.2 : Check if the tracing reaches a bifurcation point
Check If Win1(ii,jj) is bifurcation point Then
Step 8.2.1 : Trace the two branches of the bifurcation
point
Trace the first ridge start by the first neighbor (xb,yb) with 3x3 structure and put them in r1() and check for out of boundary; Trace the second ridge start by the second neighbor (xb2,yb2) with 3x3 structure and put them in r2() and check for out of boundary;
Step 8.2.2 : Calculate mean of x position and y position for
r1 pixels and r2
End for
mid_h ← (maxh + minh) / 2;
Px1 ←
4
i=1
r1(i). x
4
; py1 ←
4
i=1
r1(i).y ;
4
4 4
Step 4 : Calculate vertical hits
∑ ∑
Px2 ← i=1 ; py2 ← i=1 ;
jj ← (Wy / 2); S ← 0; 4 4

For all row in block // ii = 0 → wx - 1
Check if Win(ii, jj) = 1 Then S ← S + 1; End If
End for
hits_y ← S;
Step 5: Calculate horizontal hits
ii = (Wx / 2); S ← 0;
For all column in block // jj = 0 → Wy - 1
Check if Win(ii, jj) = 1 Then S ← S + 1; End If
End for
hits_x ← S;
Step 6 : Calculate diagonal hits
S ← 0;
For all pixel in block // ii as row, jj as column
Check if ii=jj Then
Step 8.2.3 : Calculate the distance from the bifurcation point
d1← )(Px1 − ii)2 + (py1 − jj)2 ;
d2← )(Px2 − ii)2 + (py2 − jj)2 ;
Check If d1≤ d2 Then
Take (xb,yb) as the next pixel and put it in disp();
Else
Take (xb2,yb2) as the next pixel and put it in disp();
End If
Increase counter2;
Step 8.3 : if the neighbor pixel is a ridge point
Else
Put the ridge pixel in disp();
Increase counter2;
End if
Loop (while pixel is not end point) // end of do
IJSER © 2013 http://www.ijser.org
International Journal of Scientific & Engineering Research, Volume 4, Issue 4, April-2013 1127

ISSN 2229-5518
Step 8.4 : Calculate the orientation of this ridge
Check If counter2 > 3 Then
For all ll = 0 → counter2 - 3
X1 ← disp(ll).h; Y1 ← disp(ll).v;
xf ← disp(ll + 2).h; yf ← disp(ll + 2).v;
∆x ← xf - X1; ∆y ← yf - Y1; Check If ∆x <> 0 Then
-1
Thus, as a first step the ability of each feature alone to per- form successful discrimination is determined. For defining the best discriminating features, the minimum distance classifica- tion method based on single feature is applied, and its true- positive matching ratio (i.e., efficiency) is determined. The best forty features which led to highest matching ratio are chosen. Then, the minimum distance classifier (MDC) based on two
θ ← ((tan
(∆y / ∆x)) / (pi / 180));
features from the forty features is applied and the best couple
Check If ∆y < 0 Then θ ← θ + 180; End if
Check If θ < 0 Then θ ← θ + 360; End if
Else
Check If ∆y ≥ 0 Then θ ← 90;
Else θ ← 270; End if
End if
ore(counter) ← Convert to integer(θ);
increase counter;
Delete ridge from Win1(ii,jj);
End for
Step 8.5 : Calculate the average and mean of orientation of
all ridge in the block
Find minimum value in ore() and put it in min;
Find maximum value in ore() and put it in max;
mid_ori ← Convert to integer ((max + min) / 2);
∑counter-1 ore(t)
of features which gave best matching efficiency is chosen, then
the minimum distance rule is re-calculated using the combina-
tion of three, and next four features, and so forth till reaching
the highest recognition rate. It is found that the use of 13 fea- tures led to matching efficiency (99.375%).
Also, a set of features which represents the spatial distribu- tion of local minutia (end and bifurcation points), pore, 16 ridges local attributes (i.e., including density, their orientation and intersection along different directions) is chosen. Then, determining the corresponding 112 moments are determined and used to get the highest possible recognition performance.
For studying the performance of the introduced cognition system, and explore the proposed system performance behav- ior the following parameters were adopted:
1. The correct recognition rate (i.e., true-positive rate) which
mean_ori ←
t=O
counter
is defined as the ratio between the number (nc) of correct
Step 9 : Return no_points, manv, minv, avg_v, maxh, minh,
avg_h, hits_x, hits_y, hits_diagonal, hits_2diagonal, avg_ori,
mean_ori
recognition decisions and the total number (nT) of tried tests:
nc
3.4 Moments Analysis
Each feature array extracted from the previous algorithm is

R =
T
(1)
fed as an input vector to the moments analysis stage in order to provide a feature vector invariant for scale, shifting, and rotation. In our proposed system, the seven invariant mo- ments, which have been proposed by Hu [20], are adopted.
3.5 Training Rule and Features Analysis
A training set of fingerprint samples is used to train the classi- fier and to address the feature list. Then the set is used to as- sess the recognition accuracy of the system (after the training phase). To get a robust recognition performance, there is a need to find out the list of features which shows little intra- class variability. In this work, a set of invariant moments (i.e.,
91 moment descriptors) have been used to represent the spa-
tial distribution of some ridges features (like, ridges density,
their orientation, intersection along different directions, i.e., 13 features). The selection of these features is due to their inter- class stability. The feature vectors are stored in intermediate data base table. Then, a statistical analysis was performed on these extracted features. The statistical analysis involves the determination of the mean and standard deviation of each feature and for each class.
This parameter is used when the system is used for recog-
nition purpose.
2. The processing time for preprocessing, feature extraction, and matching (decision making) stages.
3.6 Matching
To perform matching, the features of the fingerprint samples belong to training set are used to yield the template mean fea- ture vector for each person. The determined mean feature vec- tor (M) of each person, and the corresponding standard devia-
tion vector (a ) are saved in a database table, as an output of
the enrollment phase. In matching stage the mean and stand-
ard deviation template vectors for all persons are loaded from
the database, and then their similarity degree are computed
with the feature vector extracted from the tested fingerprint.
The mean and standard deviation vectors are calculated using
the following equations:

M(p, f) = ∑sT Fe(p, i, f) ∕ s (2)
The second stage in enrollment phase is feature analysis.
The aim of this stage is to evaluate the discrimination power
of each feature, and then to build the decision rule which
should use the best set of features leads to highest possible
recognition.
σ(p, f) = ∑sT
Fe(P, i, f) − M(p, i, f) (3)
IJSER © 2013 http://www.ijser.org
International Journal of Scientific & Engineering Research, Volume 4, Issue 4, April-2013 1128
ISSN 2229-5518
Where p, fare the person number and feature number, respec- tively, and sT is the total number of samples taken for p-
person.
The absolute difference (D) for each feature is computed be-
tween corresponding values taken from the test fingerprint
value and the template mean vector for each person divided by the corresponding standard deviation. By combining the square difference of the selected best 16 features (aDi), the recognition of the finger with the best similar finger in data- base is done by selecting the smallest value of aDi.
d. Di(f, ti ) = (f − ti )2 (9)
Where, f is the tested feature value, ti is the corresponding
template value for ith person, and ()it is the corresponding
standard deviation of that feature for ith person.
3. From the N (=40) kept features the best couple of features
which lead to the best recognition rate is searched for using comprehensive search mechanism. In this stage the four forms of similarity measures become:
-t 2
f -t 2
, f , t , t ) = f1
11
+ 2 21
(10)

D(p, f) = ∑i=1

Fe(p,if)-M(p,f)
σ(p,f)
(4)
a. D(f1
2 1 2
att1
att2
-t 1
1f 2-t2 1 1
, f , t , t ) = 1f1 11 +
(11)

Di(p) = ∑1
D(f)
(5)
b. D(f1
2 1 2
att1
att2
Where p, f are the person number and the feature number,
c. D(f1
2 1 2
2
1 11
2
2 21
rspetively.
, f , t , t ) = (f − t
) + (f − t )
(12)
Test Procedure
d. D(f1 , f2 , t1 , t2 ) = 1f1 − t11 1 + 1f2 − t21 1 (13)
The conducted test scenario in this project has passed through the following stages:
1. First, the standard deviation (()) and mean (M) values of
each adopted feature is computed and for each subject (i.e.,
person) (see equations 2, 3). Then, each feature (F) satisfies
the condition (F-M) / () ≥ 1.8 for most of the subjects is dis-
carded from the discriminating features list. This condition
is based on the fact that the high values of the deflection
value (F-M) / () indicate the weakness of the considered (F)
feature.
2. Second, the features included in the reduced list of features
are tested again to keep only the best (N) features whose
discrimination capabilities are the highest ones. In this pro-
ject the number (N) of best selected features is set 40. The discrimination ability is determined as the ratio of the number of correct recognition hits achieved when the test- ed feature is used alone to determine the similarity dis- tance measure. Here in this stage four forms of the similari- ty distance measures were tested, and the form which led to highest success rates of recognition is adopted at the next testing stages; the considered four forms of similarity measures are:
Where f1 , f2 are the first and second selected features, re-
spectively, which led to best highest recognition result.
At last, a set of test rounds is conducted and at each round
an additional pairs of features is added to the similarity dis-
tance measure, the added features are those led to better and
best recognition rate. The rounds of incremental additions of the best features are continued till reaching eleven rounds (i.e., sixteen features). At this round it is found that the use of a combination consist of 16 features have led to highest possible recognition efficiency (%100).
4 EXPERIMENTAL RESULTS
The effect of local ridge features, which introduced in this re- search, in improving the recognition performance has been investigated using fingerprint samples taken from FVC 2004
DB3_A [21]. The following results are observed.
For the local ridge features combination, a subset consists of 18 features have been selected from the overall set of fea- tures (i.e. 91 features). This selection is due to incremental comprehensive tests which were conducted on the training set of samples to find out the best set of features that can be used to yield best matching rates. The final highest recognition rate is (99.375%) after 12 rounds and the total number of features is

f-ti 2
a. ( , i ) =
it

|f-ti |
b. ( , i ) =
it
(6)
(7)
18 features. During the repeated additions some of the fea-
tures have been selected many times. The result is shown in
table (2).
Table (2): The local ridge features set added at each train-
c. Di(f, ti ) = |f − ti | (8)
ing round
IJSER © 2013 http://www.ijser.org
International Journal of Scientific & Engineering Research, Volume 4, Issue 4, April-2013 1129
ISSN 2229-5518
Table (3): The name and number of repetitions of each se- lected feature through the 12 rounds
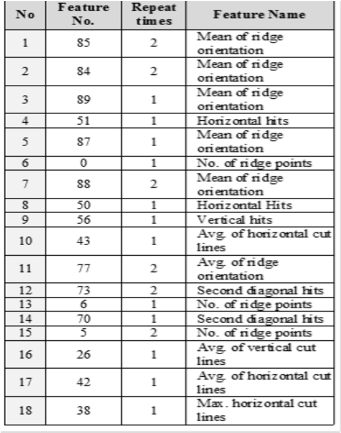
Also, for the combination of minutia, pore, and local ridge features, a subset consists of 16 features have been selected from the overall set of features (i.e. 112 features). The best at- tained recognition rate is 100%. This result is shown in table (4).
Table (4): The features set added during each round during training phase
During the additions some of the features have been added repeated many times. The results are shown in table (5).
Table (5): The name and number of repetitions of each ridge based feature selected through 11 rounds
IJSER © 2013 http://www.ijser.org
International Journal of Scientific & Engineering Research, Volume 4, Issue 4, April-2013 1130
ISSN 2229-5518
5 THE EFFECTIVENESS OF SYSTEM PARAMETERS
Our system parameters include the followings: (1) the num- ber of blocks and (2) the overlapping ratio (3) binarization's search depth (d). The test results showed that their values have significant effects on the performance of the proposed system. The performance is examination using the set of pore, minutia, and local; ridge. The recognition rate is calcu- lated first with using all the four distance measures. The re- sults shown in Table (6) where there are different values to the number of blocks and the overlapping ratio is 0.2. The table shows that the using of the first distance measure dur- ing the system parameters training stage leads to positive recognition rates higher than those from using the other dis- tance measures. So, this distance measure was adopted in our system.
Table (6): The final recognition rates for different values of blocks using different distance measures
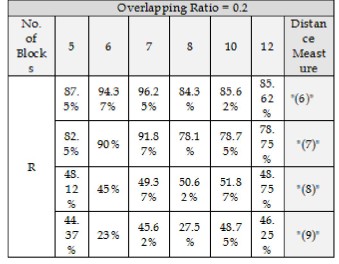
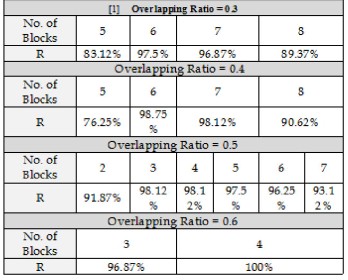
Table (7) shows the attained recognition rate versus the number of blocks and the overlapping ratio. The best achieved recognition rate is (100%), it is obtained when the number of blocks is (4) and the overlapping ratio is (0.6).
Table (7): The final recognition rates for different values of blocks and different values of overlapping ratio
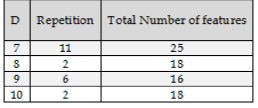
The binarization's search depth (d) parameter has an important role in our system. Although, the recognition rate remains equal to 100% when using different values of d, but the effect of d is on the number of selected features. Table (8) shows the number of selected features and their repetition using different values of d. Table (8) shows the number of selected features and their repetition using different values of d.
Table (8): The recognition rate, number of selected features and their repetition using different values of binarization search depth (d)
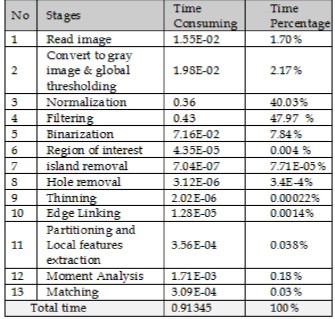
The following table describes the time consumed at each stage of the developed verification system.
Table (9): shows the mean of time consuming at each stage (in second) and their time percentages from the total time
IJSER © 2013 http://www.ijser.org
International Journal of Scientific & Engineering Research, Volume 4, Issue 4, April-2013 1131
ISSN 2229-5518
which may increase the power of our system, and finally using a dedicated hardware to speed up the processing time.
ACKNOWLEDGMENT
The authors wish to thank his supervisor Dr.Loay E. George.
6 CONCLUSION AND FUTURE WORK
In this research a fingerprint recognition model including preprocessing, partitioning, feature extraction, and matching is introduced, implemented and tested. At the feature extrac- tion stage, a new set of local ridge features has been intro- duced. The test results show that although the minutia have good discriminative power, but the use of local ridges feature (such as, local ridge orientation, ridge density, ridge hits) alone lead to promising performance, in particular with low- quality fingerprints.
In addition, the local ridge features can also work in com- bination with minutia and the level3 feature (pore) to give a significant performance improvement. This combination pro- duces excellent recognition rate (100%).
A new method for edge linkage based on the line extrapo-
lation method is introduced to connect the broken ridges which may occur due to binarization and thinning. This pro- cess plays great role for the subsequent local ridge feature ex- traction.
The experimental results show that partitioning into over- lapped blocks led to improve recognition accuracy and to compensate the recognition degradation due the partial loss in low-quality fingerprint image.
The recognition rate is highly affected by variation of block length and overlapping ratio.
For future work, our module can be extended in different di- rections; such as: using another enhancement method which may provide us with higher enhancement performance or lower processing time, or both; divide the fingerprint image using another mechanism or adding local ridge fingerprint attributes; this may increase the recognition rate to 100% without need for the combination with the other kinds of at- tributes (minutia and pore); using another matching method instead of minimum distance such as artificial neural method
REFERENCES
[1] A. Rawat, "A Hierarchical Fingerprint Matching system", M.Sc The- sis, Indian Institute of Technology Kanpur, July 2009.
[2] D. Zhang, Automated Biometrics: Technologies and Systems, Kluwer Aca-
demic Publishers, USA, 2000.
[3] A.K. Jain, Y. Chen, and M. Demirkus, “Pores and Ridges: High- Resolution Fingerprint Matching Using Level 3 Features”, IEEE Transactions on Pattern Analysis and Machine Intelligence, Vol. 29, No. 1, pp. 15-27, 2007.
[4] D. Maltoni, "A Tutorial on Fingerprint Recognition", M. Tistarelli, J.
Bigun, and E. Grosso (Eds.): Biometrics School 2003, Lecture Notes In
Computer Science 3161, pp. 43-68, 2005.
[5] A.N. Marana and A.K. Jain, "Ridge-Based Fingerprint Matching Us- ing Hough Transform", Brazilian Symposium on Computer Graphics and Image Processing IEEE Conference Publication, DOI:
10.1109/SIBGRAPI.2005.45, pp.112-119, pp. 112-119, 2005.
[6] S.J. Xie, J. Yang, D.S. Park, S.Yoon, and J. Shin (2011), "Fingerprint Quality Analysis and Estimation Approach for Fingerprint Match- ing"; In: J. Yang, and L. Nanni (Eds.), State of the art in Biometrics, In Tech, 2011.
[7] D. Maltoni, D. Maio, A.K. Jain, S. Prabhakar, Handbook of Fingerprint
Recognition, First Edition, Springer, New York, 2003.
[8] B. Bindra, O.P. Jasuja, and A.K. Singla, "Poroscopy: A Method of Per- sonal Identification Revisited", Internet Journal of Forensic Medicine and Toxicology, Vol. 1, No. 1, 2000.
[9] N. Ratha, and R. Bolle (Eds.), Automatic Fingerprint Recognition Sys-
tems, Springer, New York, 2004.
[10] A. Jain, and S. Pankanti, chapter 8: Automated Fingerprint Identifica- tion and Imaging Systems; In H.C. Lee and R.E. Gaensslen (Eds.), Advances in Fingerprint Technology, Second Edition, Boca Raton, Fla.: CRC Press, pp. 275-326, 2001.
[11] A. Ross, A. Jain, and J. Reisman, "A Hybrid Fingerprint Matcher",
Pattern Recognition, ISSN: 0031-3203, Vol. 36, No. 7, pp. 1661–1673,
2003.
[12] Y. He, J. Tian, L. Li, H. Chen, and X. Yang, "Fingerprint Matching Based on Global Comprehensive Similarity", IEEE Transactions on Pat- tern Analysis and Machine Intelligence, Vol. 28, No. 6, pp. 850–862, 2006.
[13] K. Kryszczuk, P. Morier, and A. Drygajlo, Study of the distinctive- ness of level 2 and level 3 features in fragmentary fingerprint com- parison, In: D. Maltoni, and A.K. Jain (Eds.), Springer, Lecture Notes in Computer Science 3087 , pp. 124–133, 2004.
[14] T.Y. Jeo, K. John. and V. Govindaraju, "Security and Matching of
Partial Fingerprint Recognition Systems", Proceedings of the Society of photographic Instrumentation Engineers, Biometric Technology for Human Identification, Vol. 5404, pp. 39-50, 2004.
[15] Nandakumar, K., and A. K. Jain, “Local Correlation-Based Finger- print Matching”, Proceedings Indian Conference on Computer Vision, Graphics & Image Processing, pp. 503-508, Kolkata, 2004.
[16] T.Y. Jea, and V. Govindaraju, "A Minutia-based Partial Fingerprint
Recognition System", The Journal of Pattern Recognition, Vol. 38, No.
10, pp. 1672-1684, 2005.
[17] M. Indra, S.Krishnaveni, and P. Suriyapriya, "Incorporating Ridges with Minutiae for Improved Fingerprint Verification", Signal & Image processing: An International Journal, ISSN: 2229-3922, Vol. 3, Issue: 5, P.
IJSER © 2013 http://www.ijser.org
International Journal of Scientific & Engineering Research, Volume 4, Issue 4, April-2013 1132
ISSN 2229-5518
81, 2012.
[18] Q. Zhu, M. Payne, and V. Riordan, “Edge Linking by a Directional Potential Function (DPF)”, Image and Vision Computing, Vol. 14, No. 1, pp. 59-70, 1996.
[19] A.K. Kadhim, “Metal Recognition System Based on Run-Length Fea- tures”, B.Sc. Thesis, University of Technology, 2004.
[20] M.K. Hu, “Visual pattern recognition by moment invariants”, Infor-
mation Theory, ISSN: 0096-1000, Vol. 8, Issue: 2, pp.179-187, 1962. [21] HTTP:bias.csr.unibo.it/fvc2004/databases.asp.
IJSER © 2013 http://www.ijser.org