
The research paper published by IJSER journal is about Financial Market Integration: Empirical Evidence from India and Select South Asian Countries 1
ISSN 2229-5518
—————————— ——————————
The developing countries have been transforming themselves into emerging economies by growing at an extraordinary pace while integrating rapidly to their regional and global markets due to globalization, new technological innovation and finan- cial integration (Stiglitz, 2006). The existence of strong eco- nomic and trading links, major initiatives in liberalization ac- tivities by the governments, advancement in international trade and finance, rapid developments in telecommunication and trading systems and formation of common trading blocs such as NAFTA, European Union and ASEAN have added some more momentum to such integration. Integrated finan- cial market is assumed to be of immense significance as it con- stitutes an important vehicle for promoting domestic savings, investment and economic growth (Mohan, 2004, 2005) and fostering the necessary condition for a country’s financial sec- tor to emerge as an international financial center (Reddy, 2003,
2006). The liberalization of financial markets also resulted in
regional economic integration, greater co-movement in the
stock prices and foreign investments. The recent global finan- cial crisis has focused more attention on the linkages among the stock markets of Asian countries. India has made tre- mendous strides in the global economy since opening up of the economy and subsequent economic and political reforms. The outcome being integration of various segments of capital market, strengthening competition, financial deepening with innovative instruments, easing of restrictions of foreign capital flows, lowering transaction costs and enhancing liquidity.
This paper aims to examine the relationship of Indian market
with the neighboring Asian markets. For this research event
study methodology is applied and hence, the daily closing prices of both crude oil and equity indexes of each country’s stock market (which act as a proxy for stock market perfor- mance) are considered. Section two briefly glances at the pre- vious studies on stock market integration among the various equity markets in the world, the causes behind increasing stock market integration are discussed in section three. In sec- tion four, the data source and the methodology adopted are presented. The empirical results and inferences are discussed in section five and section six concludes the paper.
Most of the literatures on integration of Asian stock markets have concentrated on the relationships using co-integration and vector regression models (Nath and Verma, 2003; Lamba,
2005; Raj and Dhal, 2008; Auzairy and Ahmed, 2009; Kora-
jazyk, 1995; Chittedi, 2009; Wong, Agarwal and Du, 2005; Ab-
as, 2009; Aktan, Mandaci, Kopurla and Ersener, 2009 and Chattopadhyay and Behera, 2008). Kumar (2002a, 2002b), in his study, confirmed that stock index of Indian stock market was not co-integrated with the developed markets. Mishra (2006) investigated the international integration of Indian stock market and found no long-run relationship between BSE and NASDAQ indices. Kroner and Ng (1998) also found no evidence of relationship among the Asian stock markets. However, correlation analyses signaled integrations among the markets in near future. Nath and Verma (2003) analyzed the level of capital market integration by examining the transmission of market movements among three major stock markets in Asian region, viz., India, Singapore and Taiwan.
IJSER © 2012
The research paper published by IJSER journal is about Financial Market Integration: Empirical Evidence from India and Select South Asian Countries 2
ISSN 2229-5518
They suggested that international investors could achieve long term gains by investing in the stock markets because of the independencies of these stock markets. Working in line with
above researches, Narayan et al (2004) examined the dynamic linkages between the stock markets of Bangladesh, India, Pa- kistan and Sri Lanka using Granger causality approach. They observed unidirectional Granger causality running from stock prices in Pakistan to India, Sri Lanka to India and from Pakis- tan to Sri Lanka in the short run. Bangladesh was the most exogenous of the four markets. Gupta and Agarwal (2011) in their paper observed the correlation of Indian Stock market with five other major Asian economies: Japan, Hong Kong, Indonesia, Malaysia and Korea. A weak correlation concluded that the Indian stock markets had offer diversification benefits to institutional and international investors. According to Raj and Dhal (2003), India’s stock markets were rather scarce de- spite various stylised facts suggesting, prima facie, the grow- ing linkage of the Indian market with global and major re- gional markets in Asia during the reform period beginning in the early 1990s. The study applied correlation and the vector error correction and co-integration model (VECM) to gauge such integration of India’s stock market with the United States, the United Kingdom and Japan, and with major re- gional markets such as Singapore and Hong Kong, the key financial centers in Asia. Ismail and Rahman (2009) investi- gated the relationship between the US and four Asian emerg- ing stock markets namely Hong Kong, India, South Korea and Malaysia using monthly data between 1996 and 2008. In order to identify the relationships, linear Vector Autoregressive (VAR) model and nonlinear Markov Switching Vector Auto- regressive (MS-VAR) model were used. It was found that the two models had managed to explore the possibility of rela- tionship between all the stock markets. Mallick (2006) used the dynamic conditional correlation (DCC) and multivariate GARCH model of Engle (1982) to measure the degree of co- movement of BSE and NASDAQ. Empirical findings con- firmed that there had been a significant increase in the mean of correlation coefficient between the markets in the crisis pe- riods compared to the pre-crisis period. This proved the exis- tence of contagion between the US and Indian markets and urged to find the channels of the contagion effect. Bose (2005) identified that the Indian stock market did not function in rel- ative isolation from the rest of Asia and the US as stock re- turns in India were highly correlated with returns in major Asian markets and was led by returns in the US, Japan, as well as other Asian markets during the post-Asian crisis and up to mid-2004. The degree of integration found between the Indian and other markets in the Asian region was, however, not of a very high order, consequently leaving sufficient room for port- folio diversification and not posing any immediate threat for capital outflows in case of regional crisis. The paper by Wong, Agarwal and Du (2005) empirically investigated the long-run
equilibrium relationship and short-run dynamic linkage be- tween the Indian stock market and the stock markets in major developed countries (United States, United Kingdom and Ja-
pan) after 1990 by examining the Granger causality relation- ship and the pair-wise, multiple and fractional co-integrations between the Indian stock market and the stock markets from these three developed markets. It was concluded that Indian stock market was integrated with mature markets and was susceptible to the dynamics in these markets in the long run. In a short run, however, both US and Japan, Granger had caused the Indian stock market but not vice versa. In addition, it was also observed that the Indian stock index and the ma- ture stock indices had structured fractionally co-integrated relationship in the long run with a common fractional, non- stationary component and found that the Johansen method was the best to divulge their co-integration relationship. Chen, Lobo and Wong (2006) examined the relation between India- US, US-China and India-China based on Fractionally Inte- grated VECM to examine co-integration between them. By supplementing the model with a multivariate GARCH model, the study also observed the first and second spillover effects. The result showed that all these pairs are fractionally co- integrated. The US market played a dominant role while there remained an interactive relationship between US and Chinese stock markets. Iqbal, Khalid and Rafiq (2011) attempted to find out dynamic relationship using Johansen (1988) and Juselius and Jones (1990) co-integration procedure for long run rela- tionship and Granger Causality test based on Toda and Ya- mamoto (1995). No integration was found among US, Pakistan and India. However, the Granger Causality test showed the evidence of unidirectional causality running from NYSE to Bombay and Karachi stock exchange.
A significant number of studies on financial market integra-
tion related to the developed markets and its spillover effects to the developing economies have been undertaken. Only a few studies have examined the co-movement of Indian stock market with international markets in general and other Asian markets in particular. Based on some studies, it is found that the price behavior of Indian market is statistically indistin- guishable from that of the US and UK markets and there is no evidence of systematic cyclical component or periodicity for these markets. Some conclude that the relationship of Indian market with international markets was poor throughout the entire seventies, but turned around significantly since early
1990s with liberalization measures initiated by the govern- ment. Given the newfound interest in the Indian stock mar-
kets, an intriguing question is how far India has gone down the road towards financial integration with its neighbouring countries. To answer this issue, we would examine the interre- lationship between Indian stock markets (both Bombay stock exchange and National stock exchange) and the leading Asian markets. While China, Japan, Hong Kong and Singapore
IJSER © 2012
The research paper published by IJSER journal is about Financial Market Integration: Empirical Evidence from India and Select South Asian Countries 3
ISSN 2229-5518
represent well-developed economies, Malaysia and Taiwan stand for developing economies and South Korea and Indone- sia belong to less-developed economy.
The study is based exclusively on secondary data obtained from various websites of Asian stock markets including yahoo finance and Bloomberg database.
We have considered daily data (five days in a week) compris- ing the closing indexes of both SENSEX and NIFTY (India), SSE (China), KOSPI (South Korea), TSEC (Taiwan), HSI (Hong Kong), JSX (Indonesia), NIKKEI (Japan), FTSE (Malaysia) and STI (Singapore). The sample period spans from August 12,
2002 to August 19, 2011. After matching daily closing indexes
of all the selected equity exchanges, there are 2252 observa- tions.
To study the long-term relationship among stock indices a common practice in the literature is to employ Johansen's co- integration method and the maximum Eigen value test. We have considered three specifications of the co-integrating equ- ation to observe the long-term relationship. They are (a) the co-integrating equation that assumes no deterministic trend in the data: with intercept only, (b) the co-integrating equation that allows linear deterministic trend in the data: with inter- cept only and (c) the co-integrating equation that allows linear deterministic trend in the data: with both intercept and trend. The short-term relationship between is explored by using the Granger causality tests or the Error Correction Model (ECM) approach. Furthermore, to observe whether any diversifica- tion benefits are offered by the stock markets, the return corre- lations among the indices are taken into consideration.
Assessment of the dynamic relations between Indian stock market indices and the various stock indices of other selected Asian countries may be undertaken through the model sug- gested either by Engle (1982) or Granger (1986, 1988) or Johan- sen and Juselius (1990) protocols. While Engle and Granger’s (1987) two-step ECM may be used in a multivariate context, the Johansen’s (1988, 1991) Vector Error Correction Model (VECM) yields more efficient estimators of co-integrating vec- tor as the model is regarded as full information maximum likelihood estimation model, which allows to test co- integration in a whole system of equation in one step without requiring a specific variable to be normalized. This allows re- searchers to avoid carrying over the errors from the first to the second step, unlike the case of Engle and Granger methodolo- gy. It also allows the avoidance of a priori of assumptions of endogenity or exogeniety of variables. Now the VECM is in the form of:
Δzt = Γ1Σ Δzt-1 + ... + Γk-1 Δzt-k+1 + Πzt-k + μt
(1)
Where, Δ denotes first difference, Γi = - (I-A1-…-Ai), (I = 1, … ,
k-1), and Π= - (I-A1- … -Ak). The short and long-run adjust-
ments to z is specified by the estimates of Γi and Π. Π= α βʹ, where α is the speed of adjustment to disequilibrium and β is the matrix of long-run coefficients that represents up to n-1 co- integration relationship and ensures that zts converge to their long-run steady state. This is to ensure that the variables are stationary and that shocks are only temporary and will dissi- pate and revert to their long-run mean. The tests for stationari- ty or unit roots employ the augmented Dickey-Fuller (ADF) and Phillips-Peron (PP) (1988) test performed on the variables in levels and first differences. Co-integration requires to prove that all the variables be integrated of the same order. To test the presence of unit roots, we have used the ADF test which considers the null hypothesis of H0: = 0.
This represents,
pΔyt = a0 + yt-1 + i Δyt-i+1 + t (2)
The ADF test assumes the asymptotic normality of the idio- syncratic error term, t, in (2).
The choice of lag-lengths may be decided using likelihood ratio test. Determining the appropriate lag length is important as too many lags reduce the power of the test due to estima- tion of additional parameters and a loss of degrees of freedom. In contrast, too few lags may not capture the dynamics of the actual error correction process, resulting in poor estimate of g and its standard errors. In this paper the multivariate forms of the Akaike information criterion (AIC) and the Schwartz Baye- sian criterion (SBC) are employed to determine lag lengths. The model selection criteria are developed considering maxi- mum likelihood estimation techniques, where:
AIC = T ln (residual sum of squares) + 2n and
SBC = T ln (residual sum of squares) + n ln (T)
To minimize the AIC and SBC, we have minimized the natural logarithm of the residual sum of squares adjusted for sample size, n, and the number of parameters included, T. It is ob- served by testing the null hypothesis that there are at most r co-integration vectors and thus (n-r) unit roots, i.e.
H0: λi= 0 where i= r+1,..…
The λ test statistics may be represented as,
n λtrace = -T Σ log (1-li ) r=0, 1, 2, …, n-2, n-1 (3)
The choice of the number of maximum co-integrating relation- ships is based on the λtrace test to examine the specific hypo- theses. We have rejected models where π has full rank, as in such a situation, zt is stationary and has no unit root and so there is no error correction.
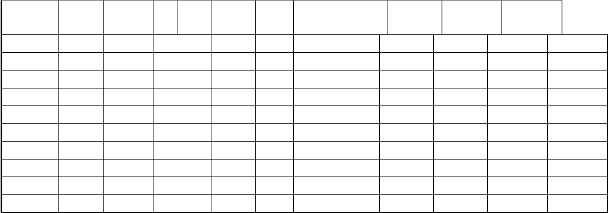
To perceive diversification benefits as are offered by the South Asian stock markets including India we have first computed the correlation coefficients of the stock market indices. The following table shows the correlation matrix.
IJSER © 2012
The research paper published by IJSER journal is about Financial Market Integration: Empirical Evidence from India and Select South Asian Countries 4
ISSN 2229-5518
NIFTY | SENSEX | SSE | KOSPI | TSEC | HfSroI m DFJSaXnd relatNesIKtoKZEπI in FPTPSEtest. BSoTthI these tests are per- formed at both the levels and on the first differences of the | |
NIFTY | 1.00 | stock indices. Table 2 shows the results of these tests. The re- | ||||
SENSEX | 0.78** | 1.00 | sults of the unit root tests indicate that all the series are inte- | |||
SSE | 0.55** | 0.97** | 1.00 | grated of order one (i.e., they are I (1). | ||
KOSPI | 0.70** | 0.86** | 0.70** | 1.00 | Table-2: Unit Root Test | |
TSEC | 0.54** | 0.95** | 0.67** | 0.90** | 1.00 | ADF test P-P test |
HIS 0.69** 0.95** 0.82** 0.94** 0.90** 1.S0e0ries
JSX 0.77** 0.95** 0.65** 0.94** 0.83** 0.87**
Constant
1.00
Constant + Trend
Constant
Constant + Trend
NIKKEI -0.13** 0.22** 0.13** 0.30** 0.46** 0.36** 0.07** 1.00
FTSE 0.70** 0.95** 0.71** 0.97** 0.91** 0.N93if*t*y
0.9-61*.*45 (00) .22**-0.97 (10.)00
-1.51 -1.34
STI 0.57** 0.89** 0.72** 0.91** 0.92** 0.S9e5n*s*ex
0.8-11*.*37 (10) .53**-1.22 (01.)91**
-11.3.090
-1.27
** Correlation is significant at 1% level
Table 1 identifies that the correlation coefficients between the Indian stock markets and the selected South Asian markets are low and in some cases negative. This means, investment in these selected markets may reap diversification benefits (with low portfolio risks) to the investors.
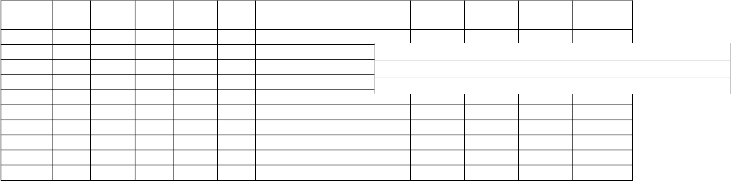
Prior to testing co-integration relationship, unit root tests are performed for each of the selected indices in determining the order of integration among them by applying the Augmented Dickey-Fuller test (1979,1981) and the Phillips-Perron test, with or without deterministic trend. The Dickey–Fuller test, fitting the regression model by ordinary least squares (OLS), is represented by:
Δyt = ρyt−1 + (constant, time trend) + ut
(4)
It is, however, apprehended that serial correlation may lead to
some problems. To defend against such, the augmented Dick- ey-Fuller test’s regression includes lags of the first differences of yt. The Phillips-Perron (PP) test, after acknowledging the augmented Dickey-Fuller test, has evolved the following equa- tion:
yt = πyt−1 + (constant, time trend) + ut
(5)
In (4) ut is I(0) and may be heteroskedastic. The PP tests take into account robust to serial correlation and heteroskedasticity in the errors ut non-parametrically by modifying the Dickey- Fuller test statistics with Newey-West (1987) heteroskedastici- ty- and autocorrelation-consistent covariance matrix estimator. Under the null hypothesis that ρ = 0, the PP Zt and Zπ statis- tics have the same asymptotic distributions as the ADF t- statistic and normalized bias statistics. One advantage of the PP tests over the ADF tests is that the former consider robust to general forms of heteroskedasticity in the error term ut. The other advantage is that the user does not have to specify a lag length for the test regression.
The study has not dealt with it, but the Dickey Fuller test pro-
duces two test statistics: a) the normalized bias T (π− 1) has a well defined limiting distribution that does not depend on nuisance parameters and b) it can also be used as a test statis- tic for the null hypothesis H0: π = 1. This is the second test
SSE -1.09 (0) -1.43 (0) -1.14 -1.88
KOSPI -0.89 (1) -1.73 (1) -0.94 -1.98
TSEC 0.81 (3) -1.45 (3) 0.99 -1.15
HIS -1.62 (2) -1.62 (2) -1.84 -1.47
JSX -1.14 (1) -4.03 (0) -1.35 -3.96
Nikkei -1.02 (0) -3.85 (0) -1.21 -3.32
FTSE -1.61 (0) -3.64 (0)** -0.83 -3.72 ** STI -1.07 (0) -1.92 (0) -2.07 -2.19
Nifty | -18.37 (0)* | -19.04 (0)* | -18.51* | -19.34 * |
Sensex | -11.93 (0)* | -11.29 (1)* | -12.39 * | -12.27* |
SSE | -14.51 (0)* | -14.53 (0)* | -14.52* | -15.67 (0)* |
KOSPI | -12.84 (0)* | -12.86 (0)* | -13.94* | -13.84 * |
TSEC | -7.24 (2)* | -7.45 (3)* | -7.84* | -8.11 * |
HIS | -6.12 (1)* | -8.62 (0)* | -13.47* | -13.27 * |
JSX | -19.14 (0)* | -19.83 (0)* | -18.34* | -17.60 * |
Nikkei | -17.47 (0)* | -17.85 (0)* | -18.54* | -18.97 * |
FTSE | -15.76 (0)* | -15.64 (0)* | -16.14 * | -17.12 * |
STI | -15.54 (0)* | -15.29 (0)* | -15.34 * | -15.57 * |
Figures in parenthesis are the lag order in the ADF equation that was selected based on the Schwartz Criterion.
* Significant at 1% level of significance.![]()
**Significant at 1% level of significance.
Next we have looked into whether the Indian stock markets are pair-wise co-integrated with each other and also with the South Asian markets. As mentioned earlier, we have exercised Johansen co-integration approach to test the interdependence among these markets. Table 3 identifies the results of the pair- wise co-integration tests and also reveals that both Sensex and Nifty do not have any long-run association with each other and these markets certainly do not share common stochastic trend with the selected Asian markets. For some markets, the long-run relationship is found dubious as the results of the co- integration tests are dependent on the specifications of the co- integrating equation and/or on the method used (trace vs. maximum Eigen value method) and/or on the number of lags included in the co-integration equation.![]()
Nifty Sen- S K TSE HSI JSX
IJSER © 2012
The research paper published by IJSER journal is about Financial Market Integration: Empirical Evidence from India and Select South Asian Countries 5
ISSN 2229-5518
sex S OS C E PI
tests were taken into consideration. Our findings suggest that: There are ample opportunities for the investors to
(?) indicates that the results of the co-integration are not ro- bust.
The results depend upon the co-integration equation
used and/or on the test method employed and/or on the num- ber of lags included in the co- integration equation
The results of the multivariate co-integration tests are found
not robust and are also dependent on the choice of the model or on the method employed or on the number of lags included in the co-integrating equation as well as on the sample period considered.
Table 4 shows the short-term association among the selected
Asian equity markets based on the Granger causality tests. The result reveals presence of short-run associations among them. However, it is observed that none of the South Asian markets has any control over each other, i.e, none of the South Asian markets leads the Indian stock market nor they are be- ing influenced by Indian stock market.
lio by investing in South Asian countries.
In future we will venture to conduct other co- integration tests (other than Johansen tests) to see whether the above results show robustness and employ other approaches, e.g., impulse response, variance decomposition, principal component method etc. to examine both the long-term and short-term associations of the equity markets.
[1] Abas, M. (2009). Analysis of Stock Market Linkages: Chi- nese, Indian and Major Markets. Unupublished Dissertation.
[2] Akin, C. and Kose, M. A. (2007). Changing Nature of North-South Linkages: Stylised Facts and Explanations. IMF Working Papers. No 07/280.
[3] Aktan, B., Mandaci, P. V., Kopurla. B. S. and Ersener. B.
(2009). Behaviour of Emerging Stock Markets in the Global
Financial Meltdown: Evidence from BRIC-A. African Journal of
Business Management. Vol. 3 (9).
[4] Auzairy, N. A. and Ahmed. R. (2009). The Impact of Sub-
t Stock Market Liberalization on the Integration of
Nif-
Sen-
SSE KOS-
TSE
HSI
sequen JSX Nikkei FTSE STI
[6] ChaNttopadhyaNyo, S. and NBoehera. SN. oK. (2008). Financial Inte-
HIS Yes Yes No No No - No No No No
an Stock Market. Working Paper. 12th Annual
JSX No No No No No No
Nikkei No No No No No No FTSE No No No No No No STI No No No No No No
These results are obtained at the 5% level of significance and using 4 lags
The study makes an approach to examine whether there is any inter-linking between the Indian stock markets with the lead- ing stock markets of the South Asian countries. We have em- ployed daily data from 2002 to 2011to explore the long-term association among them. We have applied the Johansen co- integration approach to identify the long-run association and to observe the short-term association the Granger causality
gration- for Indi No No No
ConfereNnoce on M-oney andNFoinance inNothe Indian Economy.
[7] CheNno, H., LoNbo, J. B. -and WonNg,o W-K. (2006). Links be-
tween tNheo IndianN, Uo S and NCohinese S-tock Markets. Working Pa-
per No. 0602.
[8] Chittedi, K.R. (2009). Global Stock Markets Development and Integration: with Special Reference to BRIC Countries. Unpublished.
[9] Dickey, D. and Fuller, W. (1979). Distribution of the Esti-
mates for Autoregressive Time Series with a Unit Root. Journal
of American Statistical Association. 74.
[10] Dickey, D. and Fuller, W. (1981). Likelihood Ratio Statistics
for Autoregressive Time Series with a Unit Root. Econometrica.
49.
IJSER © 2012
The research paper published by IJSER journal is about Financial Market Integration: Empirical Evidence from India and Select South Asian Countries 6
ISSN 2229-5518
[11] Engle, R. F. (1982). Autoregressive Conditional Hete- roskedasticity with Estimates of the Variance of United King- dom Inflation. Econometrica. Vol. 50.
[12] Engle, R. F. and Granger, C. W. J. (1987). Co-Integration, Error Correction: Representation, Estimation and Testing. Eco- nometrica. Vol. 55(2).
[13 ]Giannetti, M., Guiso, L. J., Padula. T. and Pagano, M.
(2002). Financial Market Integration, Corporate Financing and
Economic Growth. European Economy. Economic Papers #179. [14] Granger, C. W. J. (1986). Developments in the Study of Cointegrated Economic Variables. Oxford Bulletin of Economics and Statistics. Vol 48.
[15] Granger, C. W. J. (1988). Some Recent Developments in a
Concept of Causality. Journal of Econometrics.Vol 39 (1/2).
[16] Gupta, N. and Agarwal,V. (2011). Comparative Study of
Distribution of Indian Stock Market with Other Asian Mar- kets. International Journal of Enterprise Computing and Business Systems. Vol. 1 Issue 2.
[17] Ismail, M. T. and Rahman, R. A. (2009). Modelling the Relationships between US and Selected Asian Stock Markets, World Applied Sciences Journal. 7 (11).
[18] Iqbal, A., Khalid. N. and Rafiq. S. (2011). Dynamic Interre-
lationship among the Stock Markets of India, Pakistan and
United States. International Journal of Human and Social Sciences.
6:1 2011.
[19] Johansen, S. (1988). Statistical Analysis of Cointegrating
Vectors. Journal of Economic Dynamic and Control. Vol. 12.
[20] Johansen, S. (1991). Estimation and Hypothesis Testing of
Cointegrating Vectors in Gaussian Vector Autoregressive
Models. Econometrica. Vol. 59.
[21] Korajczyk, A. R. (1995). Stock Market Integration for De- veloped and Emerging Markets. The World Bank Policy Research Department. Policy Research World Paper No. 1482
[22] Kose, M. A., Prasad, E., Rogoff, K. and Shang-Jin Wei. (2006). Financial Globalisation: A Reappraisal. IMF Working Papers. No. 06/189.
[23] Kose, M. A, Otrok, C. and Prasad, E. S.(2006). Regionaliza-
tion vs. Globalization: Explaining North-South Business
Cycles. IMF Working Paper.
[24 ]Kose, M. A., Otrok, C. and Prasad, E. S. 2006a. How Do
Trade and Financial Integration Affect the Relationship Be- tween Growth and Volatility? Journal of International Economics. Vol. 69.
[25] Kroner, K. and Ng, V. (1998). Modeling Asymmetric Com- ovements of Asset Returns. Review of Financial Studies. 11.
[26.] Kumar, N. (2002a). Towards an Asian Economic Commu- nity- Vision of Closer Economic Cooperation in Asia: An Overview. Research and Information System for Non-Aligned and other Developing countries (RIS). Discussion Paper 32. New Del- hi.
[27] Kumar, N. (2002b). Towards an Asian Economic Commu- nity: The Relevance of India. Research and Information System for
Non-Aligned and other Developing countries (RIS). Discussion
Paper 34. New Delhi.
[28] Lamba, A.S. (2005). An Analysis of the Short- and Long-
Run Relationships between South Asian and Developed Equi- ty Markets, International Journal of Business, Vol. 10(4).
[29] Mallik, G. (2006). Has the Stock Market Integration between the Asian and OECD Countries Improved after the Asian Crisis? Frontiers in Finance and Economics. Vol. 3(2). Markowitz, H. and Tobin, J. (1952) Portfolio Selection. Journal of Finance. 7.
[30] Mishra, D. (2006). Financing India’s Rapid Growth and its Implications for the Global Economy. Mimeo, World Bank. Mohan, R. (2004). Financial Sector Reforms in India: Policies and Performance Analysis. RBI Bulletin. October.
[31] Mohan, R. (2005). Globalisation, Financial Markets and
the Operation of Monetary Policy in India. BIS Papers. No 23. Basel. May.
[32] Narayan, P., Smyth, R. and Nandha, M. (2004). Interde-
pendence and Dynamic Linkages between the Emerging Stock
Markets of South Asia. Accounting and Finance. Vol. 44(3).
[33] Nath, G. C and Verma, S. (2003). Study of Common Sto- chastic Trend and Co-integration in the Emerging Markets: A Case Study of India, Singapore and Taiwan. Research paper. NSE- India.
[34] Phillips, P. C. B. and Perron, P. (1988). Testing for a Unit
Root in Time Series Regression. Biometrika. Vol. 75. No. 2.
[35] Raj, J. and Dhal, S. (2008). Integration of India’s Stock
Market with Global and Major Regional Markets. BIS Papers.
No. 42.
[36] Reddy, Y. V. (2003). The Global Economy and Financial
Markets: Outlook, Risks and Policy Responses. RBI Bulletin.
October.
[37] Reddy, Y. V. (2006). Reforming India’s Financial Sector:
Changing Dimensions and Emerging Issues. RBI Bulletin. June. Stiglitz, J. (2006). Making Globalization Work, W W Norton.
[38] Toda, H.Y. and Yamamoto. (1995). Statistical Inference in Vector Autoregressions with Possibly Integrated Processes. Journal of Econometrics, 66.
[39] Trichet. J-C. 2005. The Process of European Financial Inte- gration: Where Do We Stand? Speech delivered at WHU Otto Beisheim School of Management. Vallendar. 13 January.
[40] Wong, W-K., Agarwal, A. and Du, J. (2005). Financial Inte-
gration for Indian Stock Market: A Fractional Cointegration
Approach. Working Paper No. 0501. Department of Economics, National University of Singapore.
IJSER © 2012