International Journal of Scientific & Engineering Research, Volume 2, Issue 4, April-2011 1
ISSN 2229-5518
Feature Selection for Cancer Classification: A Signal-to-noise Ratio Approach
Debahuti Mishra, Barnali Sahu
Abstract— Cancers are generally caused by abnormalities in the genetic material of the transformed cells. Cancer has a reputation as a deadly disease hence cancer research is intense scientific effort to understand disease. Classification is a machine learning technique us ed to predict group membership for data instances. There are several classification techniques such as decision tree induction, Bayesian classifier, k-nearest neighbor (k-NN), case-based reasoning, support vector machine (SVM), genetic algorithm etc. Feature selection for classification of cancer data is to discover gene expression profiles of diseased and healthy tissues and use the knowledge to predict the
health state of new sample. It is usually impractical to go through all the details of the features before picking up the right features. This paper provides a model for feature selection using signal-to-noise ratio (SNR) ranking. Basically we have proposed two approaches of feature selection. In first approach, the genes of microarray data is clustered by k-means clustering and then SNR ranking is implemented to get top ranked features from each cluster and given to two classifiers for validation such as SVM and k-NN. In the second approach the features (genes) of microarray data set is ranked by implementing only SNR ranking and top scored feature are given to the classifier and validated. We have tested Leukemia data set for the proposed approach and 10fold cross validation method to validate the classifiers. The 10fold validation result of two approaches is compared with hold out validation result and again with results of leave one out cross validation (LOOCV) of different approaches in the literature. From the experimental evaluation we got 99.3% accuracy in first approach for both k-NN and SVM classifiers with five numbers of genes and with 10fold cross validation method. The accuracy result is compared with the accuracy of different methods available in the literature for leukemia data set with LOOCV, where only multiple-filter-multiple wrapper approach gives
100% accuracy in LOOCV with leukemia data set.
Index Terms—Classification, Feature selection, Cancer data, Microarray, Signal-to-noise ratio
—————————— ——————————
LL organisms except viruses consist of cells. East has one cell, where as human have trillions of cells. Document cell consists of nucleus and inside nucleus there is DNA, which encodes the programs for making future organisms. Genes make proteins in two steps. First DNA transcribed to mRNA and mRNA is translated in to proteins [1]. Gene expression is the activation of genes that results in a protein. Proteins are the blue prints for the characteristics of the living organisms.A microarray is a sequence of dots of DNA, protein, or tissue arranged in an array for easy simultaneous analysis. The most famous is the DNA microarray, which plays an integral role in gene expression profiling. The substrate material is glass, plastic or a silicon chip. Important applications of microarrays include the identification of genetic individuality of tissues or organisms, the diagnosis of genetic and infectious disease [2][3].Cancers are caused by abnormalities in the genetic materials of the transformed cells. It mostly results from acquired mutations and epigenetic changes that influence gene expression. A major focus in cancer research is identifying
genetic markers.
Debahuti Mishra, ITER, Siksha O Anusansdhan University, Odisha, India. Email: debahuti@iter.ac.in
Barnali Sahu, ITER, Siksha O Anusansdhan University, Odisha, India. Email: sahu.barnali08@gmail.com
Clinical diagnosis of cancer based on gene expression data has two main targets: first to achieve the correct diagnostic for a cancer patient with a greatest confidence. Second, to identify the gene responsible for a particular type of cancer, this helps in the diagnosis and prognosis of cancer. These objectives imply to develop best classification models which ensure a true classification of a cancer sample with a low risk of misclassification. Many high level data analysis techniques such as clustering and classification algorithms work better with smaller number of genes. This approach usually covers one or more components of microarray data analysis that include dimensionality reduction through a gene subset selection, the construction of new predictive features and model inference [2].
The goal of this paper is to make an intensive study on the techniques available for finding the patterns among the genes or feature selection using SNR ranking and to analyze the result of our two approaches for feature selection which gives significant meaning to classify the genes which are responsible for cancer disease.
This paper is arranged in the following way: introduction to cancer classification data is given in section 1, section 2 deals with preliminary concept of microarray, classification techniques, SNR ranking, k- means clustering. Section 3 deals with related work on
IJSER © 2011
International Journal of Scientific & Engineering Research, Volume 2, Issue 4, April-2011 2
ISSN 2229-5518
feature selection of cancer data using SNR approach,
section 4 deals with the proposed model, section 5 contains experimental evaluation, section 6 explains the validation and comparison of our work and section 7 concludes the paper.
2 PRELIMINARIES
All cells in an organism carry the same genetic information and only a subset of the genes is active (expressed). Analyzing the gene with respect to whether and to what degree they are expressed can help characterize and understand their functions. It can further be analyzed how the activation level of genes changes under different conditions such as for specific diseases [3][4].
Microarray data are generally high dimensional data having large number of genes in comparison to the number of samples or conditions. There are many efficient methods for the analysis of microarray data such as clustering, classification and feature selection.
Feature selection is the preprocessing task for both clustering and classification. Different types of experiment can be done by microarray technology. Microarray technology measures the expression level of genes. That can be used in the diagnosis, through the classification of different types of cancerous genes leading to a cancer type[5].Basically, genes of microarray data are treated as features, a set of features(genes) give rise to a
Support Vector Machine (SVM): Support vector machines
(SVM) is a supervised learning techniques which analyze data and recognize patterns, used for statistical methods and regression analysis[7]. SVM training algorithm builds a model that predicts whether a new sample falls into one category or the other. SVM model is a representation of the samples as points in space, mapped so that the samples of the separate categories are divided by a clear gap that is as wide as possible. New samples are then mapped into that same space and predicted to belong to a category based on which side of the gap they fall on. Support vector machine constructs a hyper plane or a set of hyper planes in a high or infinite dimensional space, which can be used for classification, regression or other tasks.![]()
Input: | k = | Number of clusters |
P = | A data set containing n features (n | |
number of genes) |
![]()
1. Select number of cluster k.
2. Randomly choose k features from the data set as
the initial cluster center.
3. Repeat until the termination criteria fulfilled
3.1 Assign each feature to one of the clusters according to the similarity measure
3.2 Update the cluster means.
4. until no change in the value of cluster’s mean
pattern. If we could get the correct pattern from the data
set it is easier to classify an unknown sample based on that pattern.
Our study is mainly based on feature selection and pattern classification for gene expression data related to cancer diagnosis. There are several classification techniques such as SVM, k-NN, neural network, naïve bayesian, decision tree, random forest, top scoring pair.
k-NN: k-NN is the simplest ML technique for classifying objects based on closest training examples in the feature space[6]. It is instance based learning. It gathers all training data and classifiers often via a majority voting, a new data point with respect to the class of its k-nearest neighbor in the given data set. k-NN obtain the neighbors in the given data set. k-NN obtain the neighbors for each data by using Euclidian or Mahalanobis distance between pairs of data items. The major advantage of k-NN is its simplicity.
In this approach we have used Euclidean distance as distance measure.
The signal to noise ratio (SNR) test identifies the expression patterns with a maximal difference in mean expression between two groups and minimal variation of expression within each group [8]. In this method genes are first ranked according to their expression levels using SNR test Statistic. The SNR is defined as follows:
Signal to noise ratio= (µ1 +/µ2 )( σ1+ σ2) (1)
Where µ1 and µ2 denote the mean expression values for the sample class 1 and class 2 respectively. σ1 and σ2 are the standard deviations for the samples in each class.
IJSER © 2011
International Journal of Scientific & Engineering Research, Volume 2, Issue 4, April-2011 3
ISSN 2229-5518
Wai-Ho et al.[9] presents an attribute clustering method
,which is able to group genes based on their
interdependence to mine meaningful patterns from microarray data. Gene selection methods used are Attribute clustering, t-value, k-means, Biclustering, MRMR, RBF and Classifiers used are C5.0, Neural Networks, Nearest Neighbor, Naïve Bayes. Data sets used for the experiment are Colon cancer and Leukemia. Supoj Hengpraprohm et al.[10] proposed a method which yields higher accuracy than using the SNR ranking alone and higher than using all of the genes in classification.
Selection of informative features using k-means and SNR ranking. DLBCL, Ovarian, Colon, Prostrate, Breast cancer, CNS, Leukemia, Lung Cancer are the data sets used for the experiments. Hualong Yu et al. [11] demonstrated that a modified discrete PSO is a useful tool for selecting marker genes and mining high dimensional data.
SNR ranking is used to select top ranked informative genes. Then PSO is applied to select few marker genes.SVM is used for evaluation of prediction. Colon cancer data set is used for the experiment. Yukee Leung et
Microarray
Data
Cluster genes by k- means
Apply SNR ranking to clusters
Collect top scored genes from clusters
Train the classifiers with filtered genes
Validation
Accuracy Accuracy
Apply SNR ranking to feature set
Select top ranked genes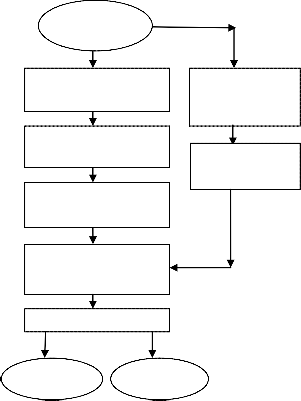
al.[12] make use of multiple filter and multiple wrappers to improve the accuracy of the classifiers.
Some of MFMW selected genes have been conformed to be biomarkers. Multiple filters are SNR, Pearson correlation, t-statistics. Multiple wrappers are SVM, WV,
3NN and data sets used are LEU [13], COL62 [14], BRER49 [15], LYM77 [16], PROS102 [17], LUNG182 [18]. Shamsul Huda et al. [19] proposed a hybrid wrapper and filter feature selection algorithm by introducing filters feature ranking score in wrapper stage to get a more compact feature set. They have hybridized mutual information based maximum relevance filter ranking method with artificial neural network based wrapper approach to get the accuracy.
Chenn-jung Huang et.al [20] have under gone a comprehensive study on the capability of probabilistic neural network associated with SNR scoring method for cancer classification. The experimental results show that the combination of PNN with the SNR method can achieve better results for Leukemia data set.
Fig.1. Model for the comparison of accuracies of SVM and kNN in two approaches with 10 fold cross validation method
We have used leukemia data set of cancer microarray data from Biological data analysis web site [21]. The Data set contains 7,129 genes and 72 samples (47 ALLs, 25
AMLs). For our approach we have taken 50 genes and 72 samples (47 class1, 25 class2) of original data set. The experiment is done in MATLAB version 7.6.0.324 (R2008a), windows XP, PC of Intel Pentium dual CPU. We have implemented two different approaches of feature selection used for classification model to discover differentially expressed genes.
Step 1: First, the features of data are clustered by applying k-means clustering algorithm. As by applying clustering technique we can group similar type of features in same cluster so that best feature from each cluster can be selected. In our approach we have tested the model with 5,
10 and 20 clusters.
IJSER © 2011
International Journal of Scientific & Engineering Research, Volume 2, Issue 4, April-2011 4
ISSN 2229-5518
Step 2: The features in each cluster is ranked by applying signal-to-noise ratio scoring technique, so that differentially expressed genes can be easily extracted from each cluster.
Step3: After that best scored feature in each cluster is selected. We can assure that applying SNR and selecting the best scored feature from each cluster the resultant feature gene subset have no redundancy.
Step4: The data with the selected biomarkers are tested
by different classifiers. The classifiers used are
3NN, SVM
Step5: For validation we have used 10fold cross
validation approach. The performance of
different classifiers with respect to the number of clusters is given in table 1
Step1: SNR scoring technique is applied to the rows of the data set.
Step2: Basing on the SNR score the features are ranked.
Step3: 5, 10, 20 top scored features are chosen
randomly.
Step4: The new data set with these features are fed to
different classifiers independently.
Step5: 10fold cross validation accuracy is listed in table
2.
TABLE 2
ACCURACY OF SVM AND K-NN IN SECOND METHOD AND SVM
TABLE 1
ACCURACY OF SVM AND K-NN IN FIRST METHOD WITH
Method Data set
No of genes![]()
10fold CV
accuracy
DIFFERENT CLUSTERS
(%)
5 97.5
SNR+SVM Leukemia
10 96.1
![]()
10fold CV
20 91.4
5 95.4
Method Data set No of
accuracy
SNR+ k-NN Leukemia
10 90.0
clusters![]()
(%) ![]()
20 98.1
Kmeans+SNR+ SVM Leukemia
5 99.3
10 94.1
From table 2 we can observe that kNN classifier with 20
20 96.1
5 99.3
genes give better result is 98.1% accuracy than SVM
classifier in 10fold cross validation approach. The
Kmeans+SNR+ kNN Leukemia![]()
10 89.3![]()
20 94.9
accuracy chart of second approach is given bellow in fig.
2
From the above table 1 we can see that both SVM and kNN classifiers are giving same accuracy with 5 numbers of genes in 10fold cross validation method i.e 99.3%. The comparison of accuracy of two classifiers are given bellow in fig.2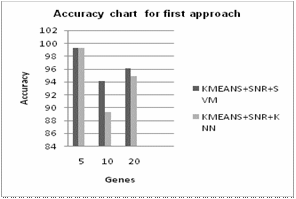
Fig.2. Accuracy of SVM and kNN in first approach with 10fold cross validation
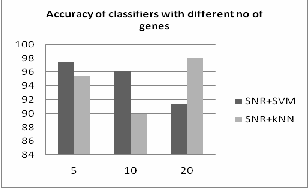
Fig.3. Accuracy of SVM and kNN in second approach with 10fild cross validation
In the paper [22] we have implemented the given two approaches with leukemia data set and validated with k- NN, SVM, PNN and FNN classifiers. We have used hold out validation method to find the accuracy of different classifiers with the above two feature selection approach. In this paper we have considered only two classifiers such
IJSER © 2011
International Journal of Scientific & Engineering Research, Volume 2, Issue 4, April-2011 5
ISSN 2229-5518
as SVM and k-NN the accuracies of these two classifiers with hold out validation method for two approaches are given in table 3 and 4 respectively.
TABLE 3
HOLD OUT VALIDATION ACCURACY OF SVM AND K-NN IN
FIRST METHOD
![]()
SVM
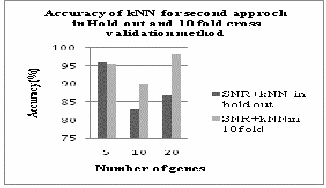
From fig. 4 we can analyze that SVM classifier gives better result in hold out validation method than 10fold cross validation method. But from figure 5 we can conclude that kNN classifier gives better result in first approach with 10fold cross validation method.
kNN
TABLE 4
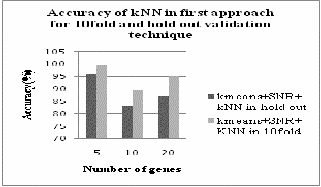
Fig.5. Accuracy of k-NN in first approach with hold out and 10fold cross validation
HOLD OUT VALIDATION ACCURACY OF SVM AND K-NN IN
SECOND METHOD
![]()
![]()
![]()
SNR+SVM Leukemia 5 96![]()
10 96![]()
20 96![]()
SNR+kNN Leukemia 5 96![]()
10 96![]()
20 96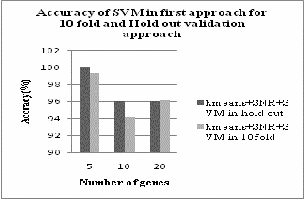
Fig.4. Accuracy of SVM in first approach with hold out and
10fold cross validation
Fig.6. Accuracy of k-NN in second approach with hold out and 10fold cross validation
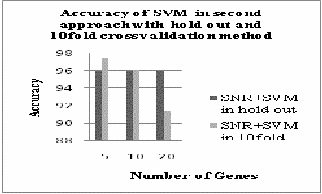
Fig.7. Accuracy of SVM in second approach with hold out and 10fold cross validation
IJSER © 2011
International Journal of Scientific & Engineering Research, Volume 2, Issue 4, April-2011 6
ISSN 2229-5518
Comparing fig.2 and fig.3 we can analyze that the 10fold cross validation accuracy of k-NN and SVM is same i.e
99.3% which is better than the second approach. Where in the second approach SVM gives 97.5% with 5 genes and k-NN gives 98.1% accuracy with 20 genes .Hence in second approach k-NN gives better result with large number of features
In case of hold out validation method only SVM gives 100% accuracy with and k-NN gives 96% accuracy with 5 numbers of genes.
From the above comparisons we can conclude that SVM gives better results with less number of features in first approach.
Now if we are going to compare the results of two
validation method for our two approaches than from fig.
4 and fig.5 we can see that SVM gives better result in hold
out validation than 10fold cross validation method for
first approach. But k-NN gives better result for 10fold
cross validation than hold out validation.
From fig.6 and fig.7 we can analyze that in second
approach both k-NN and SVM gives better accuracy in
10fold validation method.
From the literature we have collected the accuracies of
different methods or approaches for LOOCV method for
Leukemia data set, given in table 5 and the accuracy chart
of different approaches are given in fig.8.
Again comparing our approach and methods present
in literature we can see that MFMW gives 100% accuracy
with 4 numbers of genes and our first approach with
Hold out validation with SVM gives 100% accuracy but
first approach with 10fold cross validation approach in
SVM and k-NN classifier gives 99.3% accuracy with 5
numbers of genes.
TABLE 5
LOOCV ACCURACY OF DIFFERENT APPROACHES FOR
LEUKEMIA DATASET
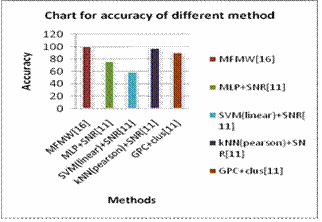
Fig.8. Accuracy of different approaches for Leukemia data set with LOOCV
From the above comparative analysis we can conclude that our first approach for feature selection is better in comparison to our second approach as due to clustering technique similar features will be grouped in to the same clusters. After applying SNR ranking and selecting top scored features from each cluster may give a true pattern which helps to enhance the classification accuracy. But in case of second approach after applying SNR ranking we can randomly choose the top scored features where we can get redundant feature or noisy features with similar SNR score and does not provide any relevant information about the data. Therefore the performance of the learning algorithms decreases. Again in comparison to hold out validation and 10fold validation approach k-NN and SVM perform well in first approach for 10fold cross validation and only SVM perform well for hold out validation method.![]()
[1] Gregory Piatetsky-Shapiro, Pablo Tamayo, “Microarray Data Mining: Facing the Challenges”, SIGKDD Explorations, Volume5, Issue 2, pp. 1-5, June 2003
[2] Minca Mramor Gregor Leban, Janez Demar and Bla
Zupan, 2007, "Visualization-based cancer microarray
data classification analysis", Bioinformatics, Vol. 23,
No.16, pp.2147-2154, 2007.![]()
[3] Wolfgang Huber, Anja Von Hey debreck, Martin Vingron,”Analysis of microarray gene expression data, Hand book of statistics genetics,” 2nd edition, Wiley.2003
[4] Hong-Hai Do,Toralf Kirsten,Erhard Ralm,”Comparative
Evaluation of Microarray-based Gene expression Database,GI- Proceedings, pp 26-34.
IJSER © 2011
International Journal of Scientific & Engineering Research, Volume 2, Issue 4, April-2011 7
ISSN 2229-5518
[5] Ana C.lorena, Ivan G.costa, Marcilio c. p. de Souto”,On the complexity of gene expression classification data sets,” Eighth International Conference on Hybrid intelligent System,pp
825-830.2008
[6] V.N. Vapnik, “Statistical Learning Theory”, Wiley- Interscience Publications, 1998
[7] Vapnik VN.”The nature of statistical Theory”.Springer- Verlag;1995
[8] Miroslava Cuperlovic-Cuf, Nabil Belacel, Rodney. j.
Ouellette, “Determination of Tumour marker genes from gene expression data, DDT”, Vol-10, Number 6 pp429-437, 2005
[9] Wai-Ho Au,Keith C.C.Chan,Andrew K.C. Wong, Yang
Wang. Attribute clustering for Grouping, IEEE/ACM Transactions on computational biology and Bioinformatics, Vol 2.,No 2, pp83-101,2005
[10] Supoj Hengpraprohm, Prabhas Chongstitvatana, “Selecting Informative Genes from Microarray Data for Cancer Classification with Genetic Programming Classifier using K- Means Clustering and SNR Ranking”, Frontiers in the Convergence of Bioscience and Information Technologies , pp211-216, 2007.
[11] Hualong Yu,Guochang Gu,Haibo Liu,Jing Shen, Changming Zhu,. “A Novel Discrete Particle Swarm Optimization Algorithm for Microarray Data-based Tumor Marker Gene Selection”, International Conference on Computer science and software Engineering, pp. 1057-1060, 2008
[12] Yukyee Leung, Yeungsam Hung, “A Multi-Filter-Multi-
Wrapper “Approach to Gene Selection and Microarray Date Classification”, IEEE/ACM Transactions on Computational Biology and Bioinformatics, Vo1. 7, No .1, pp.108-117, 2010.
[13] T.R. Golub, D.K. Slonim, P. Tamayo, C. Huard, M.
Gaasenbeek, J.P. Mesirov, H. Coller, M.L. Loh, J.R.
Downing, M.A. Caligiuri, C.D. Bloomfield, and E.S. Lander, “Molecular Classification of Cancer: Class Discovery and Class Prediction by Gene ExpressionMonitoring,” Science, vol. 286, no. 5439, pp. 531-537, 1999.
[14] U. Alon, N. Barkai, D.A. Notterman, K. Gish, S. Ybarra, D.
Mack,and A.J. Levine, “Broad Patterns of Gene Expression Revealed by Clustering Analysis of Tumor and Normal Colon Tissues Probed by Oligonucleotide Arrays,” Proc. Nat’l Academy of Sciences USA, vol. 96, no. 12, pp. 6745-6750,
1999
[15] M. West, C. Blanchette, H. Dressman, E. Huang, S. Ishida, R. Spang, H. Zuzan, J.A. Olson Jr., J.R. Marks, and J.R. Nevins, “Predictingthe Clinical Status of Human Breast Cancer by Using Gene Expression Profiles,” Proc. Nat’l Academy of Sciences USA, vol. 98, no. 20, pp. 11462-11467,
2001.
[16] M.A. Shipp, K.N. Ross, P. Tamayo, A.P. Weng, J.L. Kutok,
R.C.T. Aguiar, M. Gaasenbeek, M. Angelo, M. Reich, G.S. Pinkus, T.S. Ray, M.A. Koval, K.W. Last, A. Norton, T.A. Lister, J. Mesirov, D.S. Neuberg, E.S. Lander, J.C. Aster, and T.R. Golub, “Diffuse Large B-Cell Lymphoma Outcome Prediction by Gene-Expression Profiling and Supervised Machine Learning,” Nature Medicine, vol. 8, pp. 68-74,
2002.
[17] D. Singh, P. Febbo, K. Ross, D. Jackson, J. Manola, C. Ladd, P. Tamayo, A. Renshaw, A. D’Amico, and J. Richie, “Gene Expression Correlates of Clinical Prostate Cancer Behavior,” Cancer Cell, vol. 1, no. 2, pp. 203-209, 2002.
[18] G.J. Gordon, R.V. Jensen, L.L. Hsiao, S.R. Gullans, J.E.
Blumenstock, S. Ramaswamy, W.G. Richards, D.J. Sugarbaker, and R. Bueno, “Translation of Microarray Data into Clinically Relevant Cancer Diagnostic Tests Using Gene Expression Ratios in Lung Cancer and Mesothelioma,” Cancer Research, vol. 62, no. 17, pp. 4963-4967, 2002.
[19] Shamsul Hunda, John Yearwood, Andrew Strainieri, “Hybrid wrapper-filter approach for input feature selection using Maximum Revalance and Artificial Neural Network Input Gain Measurement Approximation”, Fourth International conference on Network and system security, pp442-449, 2010.
[20] Chenn-Jung Huang ,Wei-Chen Liao, “A Comparative
Study of Feature Selection Methods for Probabilistic Neural Networks in Cancer Classification”, Proceedings of the 15th IEEE International Conference on Tools with Artificial Intelligence (ICTAI’03),Vol 3, pp1082-3409, 2003.
[21] http://sdmc.lit.org.sg/GEDatasets/
[22] Debahuti Mishra, Barnali Sahu,”A signal to noise classification model for identification of differentially expressed genes from gene expression data,”3rd International conference on electronics computer technology,2011(Accepted)
IJSER © 2011