International Journal of Scientific & Engineering Research, Volume 6, Issue 2, February-2015 750
ISSN 2229-5518
Feature Analysis and Classification of BI-RADS Breast Cancer Using Genetic Algorithm
Prakash Bethapudi, E Sreenivasa Reddy, T Sitamahalakshmi, Kamadi VSRP Varma
Abstract—The intended work deals with Genetic Algorithm which helps in predicting benign and malignant breast cancer cases more effectively. The breast cancer mammographic mass dataset (BI-RADS) was taken from UCI Machine Learning Repository, center for machine learning and intelligent systems. A 3-fold cross validation on BI-RADS dataset was used and applied the proposed Genetic algorithm. The proposed method’s performance was superior to earlier techniques. The examined results in partitioning the benign and malignant cases using genetic algorithm is more promising with a classification accuracy of 84.4% which is more prominent then many of the existing classifier techniques which used BI-RADS dataset. In the proposed method we also analyzed the prominence of sub features of each individual features like Mass-Shape (Round, Oval, Lobular and Irregular);Mass-Margin (Circumscribed-1, Microlobulated-2, Obscured-3, illdefined-4 and Spiculated-5) and Mass-Density (High-1, ISO-2, Low-3 and Fat content-4) of BI-RADS dataset and identified the accuracy in classification and more prominent features suitable for better classification of breast cancer cases.
Index Terms: Benign, BI-RADS, Breast-Cancer, Classifier, Genetic-Algorithm, Malignant, Mammographic-mass .
1 INTRODUCTION
—————————— ——————————
[1]reast cancer is the principal cause of deaths among most of the women of various countries. In this paper, we used an algorithm entitled genetic algorithm which pro- duced finest results over techniques used beforehand in cate- gorizing Benign and malignant breast cancer instances on BI- RADS data. Now a day’s data mining and machine learning techniques are playing a predominant role in classifying most of the cancer cases like the benign and malignant tumors in breast cancer repository. Research is going on effectively on most of the medical datasets. For classification and feature extraction most of the classifiers and feature selection tech- niques are used and applied on the multiple datasets effective- ly. Many of these techniques showed better classification accu- racies. These classifications helps the radiologists to concen- trate more on the results obtained for better examination and treatment Data mining is the most essential and important task in classification of various datasets. Lot of research is go- ing on medical datasets using multiple classifiers and feature selection techniques. Many of the classifiers showed good classification accuracy. Coming to the WBC dataset, various classifiers showed various accuracies [2] EM Clustering Algo-
————————————————
• Prakash Bethapudi is currently working as an Assistant Professor in De- partment of CSE, GIT , GITAM University, VISAKHAPATNAM,
INDIA, PH-919391593939. E-mail: prakash.vza@gmail.com
• Dr E Sreenivasa Reddy is currently working a Professor, HOD, in De- partment of CSE, College of engineering, NAGARJUNA University, GUNTUR, INDIA, PH-917893111985. E-mail: edra_67@yahoo.com
• Dr T Sitamahalakshmi is currently working as a Professor in Department of CSE, GIT, GITAM University, VISAKHAPATNAM, INDIA,
PH-08916536532. E-mail: tsm@gitam.edu
• Kamadi VSRP Varma is currently working as an Assistant Professor in Department of CSE, GIT , GITAM University, VISAKHAPATNAM, INDIA, PH-919440537658. E-mail: gitamvarma@gmail.com
rithm gave an accuracy of 78.9%, Ahmad and Dey Clustering technique gave an accuracy of 78.5%, Bagging technique gave an accuracy 0f 80.7%, Adaboost.M1 gave an accuracy of 78.4%,
[3] Gini Fuzzy SLIQ Decision Tree Algorithm gave an accura- cy of 81.4 and the proposed system Genetic Algorithm gave an accuracy of 84.4% on BIRADS dataset, which is better than the existing systems. The results have been displayed in Table.7.
The rest of the paper is organized as follows; the Section II describes flow chart of proposed model and it’s description; Results were discussed in Section III. Conclusionwas dis- cussed in Section IV.
2 DESCRIPTION OF PROPOSED MODEL
In the anticipated model, we considered the [4]BI-RADS da- taset of Wisconsin breast cancer dataset taken form UCI Ma- chine Learning Repository, center for machine learning and intelligence systems. This data consists of 961 records in total. The entire data contains two Class: benign with: 516 cases; and malignant with: 445cases.The database consists of six Attrib- utes in total among which 1 is a goal field, 1 is a non- predictive field and 4 are predictive attributes. Attribute in- formation is as follows.1. BI-RADS assessment: 1 to 5 (ordinal),
2. Age: patient's age in years (integer) ranged from 18 to 96 years, 3. Mass-Shape: has sub features, like round=1; oval=2; lobular=3;and irregular=4 (nominal). 4. Mass-Margin: has sub features like circumscribed=1; microlobulated=2; obscured=3; ill-defined=4;and spiculated=5 (nominal), 5. Mass-Density: has sub features like high=1; iso=2; low=3; fat-containing=4 (ordi- nal); and finally 6. Severity with two classes: benign=0 or ma- lignant=1 (binominal). Total database have some missing at- tribute values as follows: BI-RADS assessment: 2 values miss- ing; Age:5 values; Shape: 31 values; Margin: 48 values; Density
: 76 values and Severity:0 values. Initially, missing data are filled with the mean value of that particular field. As previous-
IJSER © 2015 http://www.ijser.org
International Journal of Scientific & Engineering Research, Volume 6, Issue 2, February-2015 751
ISSN 2229-5518
ly discussed this dataset consists of six attributes in total. After necessary preprocessing done by filling all the missing data values with their mean values, we have classified all the 961 instances into two classes.
The first class is classified as non-cancerous and the second class is classified as cancerous cases. From these two classes we extracted three folds using some technique. We may ex- tend the folds according to our wish as folds3, folds5, folds10 and so on. Now from these folds we prepare a training dataset as well as testing dataset. As previously discussed this dataset consists of six attributes in total. After necessary preprocessing done by filling all the missing data values with their mean values, we have classified all the 961 instances into two clas- ses. The first class is classified as non-cancerous and the se- cond class is classified as cancerous cases. From these two classes we extracted three folds using some technique. We may extend the folds according to our wish as folds3, folds5, folds10 and so on. Now from these folds we prepare a training dataset as well as testing dataset. We provide the train dataset and the test dataset to the proposed genetic algorithm and applied rules on them. Finally by using test data and classifi- cation technique we got the accuracy of 84.4% on the data which is more promising then the existed results from various techniques. [5]Confusion matrix has been constructed for the three extracted folds. The accuracy, sensitivity and specificity for rules on each fold are retrieved. This is carried out for mul- tiple times using different ranges of rules.
Here we considered the folds for 50, 100, 150, 200 and 250 rules for all the three folds using the genetic algorithm. We examined exceptional results when compared to the existing results which have been retrieved by various techniques. The accuracy, sensitivity and specificity of the proposed model are presented in the table 2.With the proposed model we achieved an average accuracy 84.4% which is compared with the exist- ing techniques and are presented in the table.5.Similarly we considered individual attribute and analyzed their importance in the classification. We applied the proposed genetic algo- rithm on each attribute and their sub classes. We followed the same three fold validation process for the subfields of each individual fields1.Mass-Shape (Round, Oval, Lobular and Ir- regular); 2.Mass-Margin (Circumscribed-1, Microlobulated-2, Obscured-3, illdefined-4 and Spiculated-5) and 3.Mass-Density (High-1, ISO-2, Low-3 and Fat content-4).We tested the fields by applying the proposed genetic algorithm for 50, 100,150,200 and 250 rules and examined that as we are increasing the rules we noticed better classification accuracy for some fields from which we can analyze that this algorithm works better for some of the sub fields.
2.1 Chromosome Representation
Rule condition is of the form “ Ai OP Vij ”; Where
‘Ai’represents the i-th inter-predicted attribute, ‘OP’ repre-
sents the assessment operator {<, >, <=, >=, = =} and
‘Vij’denotes j-th value of the i-th attribute. The predicted at-
tributes for the BI-RADS database is shown in figure 1. And
the operators used for combining the attributes are shown in figure 2.
Figure 1:Inter-predicted attributes
Figure 2: Operators used for combining inter-predicted attrib- ute values
2.2 Algorithm of the Proposed Model
1. Start
2. Preprocess the data
3. Divide into classes
4. Divide into folds
5. Divide into training data
6. Divide into testing data
7. Apply Genetic Algorithm for training and testing da-
ta
8. [Start] select initial population of n chromosomes randomly.
9. [Fitness] measure fitness for each chromosome in the population
i. [New population] generate new population
ii. [Selection] Select parent 1 and parent 2 chromosomes from a population according to their fitness
iii. [Crossover] perform cross over on the par- ents to form a new offspring (children). Off- spring may be same as parent if no crossover was performed.
iv. [Mutation] perform mutation on new off- spring at each locus.
v. [Accepting] put new offspring in the new population
10. [Replace] Apply Algorithm on newly generated pop- ulation.
11. [Test] If the end condition is met, stop, and return the best solution in current population
12. [Loop] Go to step ii.
2.3 Operators of GA
The performance is influenced mainly by crossover and muta- tionin genetic algorithm.
2.3.1. Crossover
There are different [6] crossover techniques like one point crossover, two point crossover, cut and splice crossover, uni- form crossover and half uniform crossovers.
IJSER © 2015 http://www.ijser.org
International Journal of Scientific & Engineering Research, Volume 6, Issue 2, February-2015 752
ISSN 2229-5518
2.3.1.1 One-point Crossover
This contains only one crossover point on both parents. All
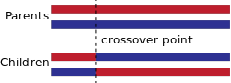
data beyond that crossover point in both organism strings areexchanged between the two parents. The subsequent or- ganisms are the children, shown in figure 3.
Figure 3: One point crossover
2.3.1.2 Two-point Crossover
In two point crossover, two crossover points must be selected
on the parent organism strings. Everything within the two
points is swapped between the parent organisms, interpreting
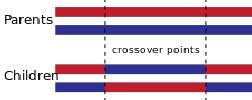
two child organisms, shown in figure 4.
Figure 4: Two point crossover
2.3.1.3 Uniform Crossover and Half Uniform Crossover
The Uniform Crossover uses a fixed mixing ratio between two parents and enables the parent chromosomes to contribute the gene level rather than the segment level. If the mixing ratio is
0.5, the offspring has approximately half of the genes from first parent and the other half from second parent, although
cross over points can be randomly chosen as shown in figure
5.
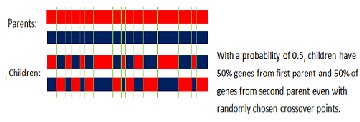
Figure 5: Uniform and half uniform crossover
In the uniform crossover, individual bits in the string are compared and swapped between two parentswith a fixed probability, say, 0.5.
In the half uniform crossover scheme, exactly half of the non- matching bits are swapped. Thus first the Hamming dis-
After we have decided what encoding we will use, we can make a step to crossover. Crossover selects genes from parent chromosomes and creates a new offspring. The simplest way how to do this is to choose randomly some crossover point and everything before this point copy from a first parent and then everything after a crossover point copy from the second parent.
The sequential steps for crossover operation:
1. Select two parent rules from the tournament selection process.
2. Select a random point in the individual parent ex- pression.
3. Exchange the sub parts front and rare parts at the se- lected point
4. Find the fitness of the newly formed rules; if the fit- ness of the off springs is maximumadd these rules to the initial rules.
5. Repeat the above process for required number of times
Crossover looks like this (| is the crossover point):
Chromosome | 1 | 11011 | 00100110110 |
Chromosome | 2 | 11011 | 11000011110 |
Offspring | 1 | 11011 | 11000011110 |
Offspring | 2 | 11011 | 00100110110 |
There are other ways how to make crossover, for example we can choose more crossover points. Crossover can be rather complicated and very depends on encoding of the encoding of chromosome. Specific crossover made for a specific problem can improve performance of the genetic algorithm.
2.3.2 Mutation
After a crossover is performed, mutation takes place. This is to prevent falling all solutions in population into a local op- timum of solved problem. Mutation changes randomly the new offspring. For binary encoding we can switch a few randomly chosen bits from 1 to 0 or from 0 to 1.
Steps from Mutation with attribute modification:
1. Select a random point within the attribute range.
2. Form the new rule by changing the selected attribute value.
3. Compute the fitness of the newly formed rule if the fitness is greater than the parent then add this rule to the initial population
4. Repeat the above process for required number of
times
Mutation can then be following:
tance (the number of differing bits) is calculated. This number | Original Offspring 1 | 1101111000011110 |
is divided by two. The resulting number is how many of the | Original Offspring 2 | 1101100100110110 |
bits that do not match between the two parents will be | Mutated Offspring 1 | 1100111000011110 |
swapped. | Mutated Offspring 2 | 1101101100110110 |
IJSER © 2015 http://www.ijser.org
International Journal of Scientific & Engineering Research, Volume 6, Issue 2, February-2015 753
ISSN 2229-5518
The mutation depends on the encoding as well as the crossover. For example when we are encoding permuta- tions, mutation could be exchanging two genes.
Based on the confusion matrix shown in figure 6, The accura- cy, Sensitivity, and Specificity have been calculated for all the three folds by the formulas shown in the below table.1 The accuracy is calculated on fold1 using a specified set of rules on it and the percentage of accuracy have been retrieved. Similar- ly the sensitivity and specificity too are calculated on fold1 using the set of specified rules say 50 for first run and the per- centage of sensitivity and specificity have been calculated. In the same way, Accuracy, sensitivity and specificity have been calculated by applying 100, 150, 200 and 250 rules on fold1 and the percentage of accuracy were calculated. The same process is carried out for fold2 and fold3 by applying 50, 100,
150, 200 and 250 rules and the percentage of accuracy, sensitiv-
ity and specificity have been calculated. The obtained results
were compared with the results of previous methods applied
BI-RADS breast cancer dataset. The results obtained by the
proposed system proved to be more encouraging when com- pared to the results of the previous systems. The proposed system used three folds but can use more number of folds say
5,10,15… for more encouraging results which may be carried out as further work
Measure | Formula |
Accuracy | TP + TN 
TP + TN + FP + FN |
Sensitivity | TP 
TP + FN |
Specificity | TN 
TN + FP |
Table-1: Formulas of accuracy, sensitivity and specificity
ues we replaced the missing values in the attribute with aver- age of the attribute. BI-RADS has six conditional attributes and one decision attribute. Out of five conditional features three are predictable features they are Mass Shape, Mass Mar- gin and Mass Density. We performed the classification on the sub features of each predictable feature using Genetic Algo- rithm and the average accuracy results are presented in table
6.The average accuracy obtained with complete data set (with all predictable and sub features)is presented in table 5.After applying rules on each folds, we get set of final rules and final operators based on which classification takes place which is of the form “A1 OP Vij ” , using the attributes and operators shown in figure1 and figure2.In the proposed system we con- sidered ( A1,A2,A3,A4,A5 )as attributes and rules as ( = = as rule1; > as rule2; <as rule3; >= as rule 4 and <= as rule5 ). A sample final rules and operations obtained after each run is shown in table1 and table2.
1 | 5 | 2 | 5 | 3 | 4 | 0.723397 |
2 | 5 | 2 | 5 | 3 | 4 | 0.723397 |
3 | 3 | 4 | 3 | 5 | 5 | 0.723397 |
4 | 3 | 5 | 3 | 3 | 4 | 0.723397 |
5 | 3 | 5 | 5 | 3 | 4 | 0.723397 |
6 | 5 | 2 | 5 | 3 | 4 | 0.723397 |
7 | 3 | 4 | 3 | 5 | 5 | 0.723397 |
8 | 3 | 5 | 3 | 3 | 4 | 0.723397 |
9 | 3 | 5 | 5 | 3 | 4 | 0.723397 |
10 | 5 | 2 | 5 | 3 | 4 | 0.723397 |
. | . | . | . | . | . | . |
58 | 2 | 2 | 5 | 4 | 4 | 0.693012 |
Table 2: Operators used in classification of each tuple for 150 rules


Positive Negative


True Positive False Negative
Positive


False Positive True Negative
Negative
Figure 6: Confusion matrix
3 RESULTS
We used BI-RADS data set with three fold cross validation for feature analysis and classification, where each training set has 641 tuples and the corresponding test set has 320tuples out of 961 total sample tuples. BI-RADS data set has missing val-

Table 3: Rules obtained in classification of each tuple for
150 rules
Hence from table 2 and table 3, we conclude that for 150 rules on fold 1 we obtained classification as follows
if (A1 <= 4 && A2 > 0 && A3<= 0 && A4<4.2 && A5>=1 then class = 1 ) similarly all tuples are classified and
IJSER © 2015 http://www.ijser.org
International Journal of Scientific & Engineering Research, Volume 6, Issue 2, February-2015 754
ISSN 2229-5518
if( A1 > 4.5 && A2 > 0 && A3 <= 0 && A4 >= 1 && A5 >= 1 then class = 2 ) for the last tuple(58) shown in tables2 and 3.
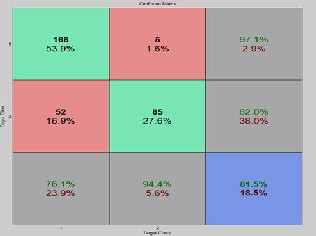
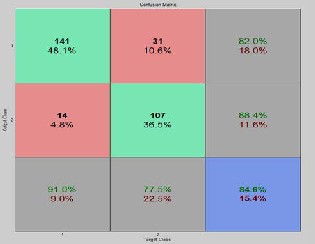
Figure 7: Accuracy, sensitivityand specificity results ob- tained for150 rules on BI-RADS dataset for fold-1
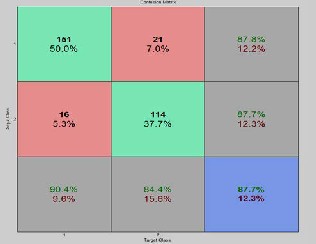
Figure 8: Accuracy, sensitivityand specificity results ob- tained for 150 rules on BI-RADS dataset for fold-2
Figure 9: Accuracy, sensitivityand specificity results ob- tained for 150 rules on BI-RADS dataset for fold-3
The overall average of sensitivity is 76.1, specificity is 94.4 and
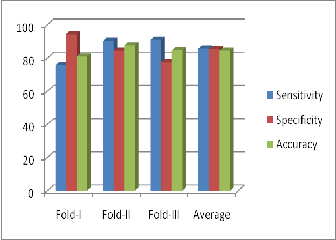
81.5 for fold – 1 and similarly we get same set of multiple tu- ples and average values of sensitivity, specificity and accuracy for fold – 2 and fold – 3 for 150 rules. The same process is car- ried out for all sets of rules, 50,100 200 and 250 and their classi- fication accuracy, sensitivity and specificity are retrieved and the results are analyzed. Confusion matrix with sensitivity, specificity, and accuracy for three folds when applied on 150 rules are shown in figure 7, figure 8 and figure 9. Similarly The overall Graphical representation of individual features for three folds independently for 50,100,150,200 and 250 initial rules is shown in figure 10 and the Comparison results of the existing are analysed andare shown in figure 11.
Figure10: Average accuracy, sensitivity and specificity for
50, 100, 150, 200 and 250 initial rules
IJSER © 2015 http://www.ijser.org
International Journal of Scientific & Engineering Research, Volume 6, Issue 2, February-2015 755
ISSN 2229-5518
Table 5: Average accuracy, sensitivity and specificity for dif- ferent rules on BI-RADS Dataset with three folds
Shape/ Rules | Round | Oval | Lobular | Irregular | Average |
Rules 50 | 86.06 | 83.13 | 77.0 | 72.63 | 79.75 |
Rules 100 | 86.40 | 82.63 | 76.63 | 74.10 | 79.94 |
Rules 150 | 84.40 | 82.63 | 77.0 | 72.63 | 79.34 |
Rules 200 | 87.80 | 83.73 | 77.0 | 72.63 | 80.29 |
Rules 250 | 88.73 | 86.10 | 77.0 | 76.70 | 82.15 |
Table 6: Accuracy and average accuracy results obtained with three folds on individual mass shapes of BI-RADS dataset
Table 7: Comparisons of existing and recent experimental re- sults on BI-RADS dataset
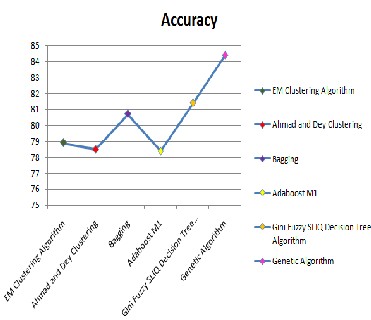
Figure11: Comparison results for the existing methods with the proposed method for BI-RADS dataset.
4 CONCLUSION
From the results obtained for various rules when applied, we achieved better classification accuracy when compared to the other existing techniques. When we applied the proposed sys- tem on BIRADS dataset we achieved the accuracy rate of 84.4 which is better than existing techniques where their results ranged between 78.4 and 81.4 shown in table.5. We also ap- plied the proposed model on each field and their sub fields for different rules 50 to 250 and analyzed the importance of each field shown in table 6. When applied on Mass shape, we found
IJSER © 2015 http://www.ijser.org
International Journal of Scientific & Engineering Research, Volume 6, Issue 2, February-2015 756
ISSN 2229-5518
that round and oval shapes acquired better classification accu- racy when compared to the other two lobular and irregular. Also by increasing the rules the classification accuracy too got increased shown in table.6. Coming to mass margin, we found that circumscribed, micro-lobulated and obscured gave better classification accuracy than the other two ill-defined and speculated. And for mass density, ISO and LOW gave better classification accuracy than high and fat content. Form this we can conclude that the proposed model gives prominent results for mass shapes like round and oval, mass margin like circum- scribed, micro-lobulated and obscured; and mass density like ISO and LOW. The overall results were prominent when com- pared to the existing systems which are displayed in table 7. Also in future work we may try to improve the accuracy rate of non-classified and other fields by bringing up a hybrid model which classifies the BI-RADS data very effectively and more accurately.
ACKNOWLEDGEMENTS
My Sincere thanks toUCI Machine Learning Reposi- tory for providing the datasets of Wisconsin breast cancer pa- tients. My Special thanks to Head of the department, Comput- er Science and Engineering Prof P V Nageswar Rao GIT, and the management of GITAM UNIVERSITY, VISAKHAPAT- NAM, INDIA, for providing me the necessary software and resources in carrying out the research work. My Heartfelt thanks to my wife S Jaya Kalyani, children and family mem- bers for their continuous support in all my works.
REFERENCES
1. World cancer report (International Agency for Re- search on Cancer, Lyon, France), 2008.
2. SM Halawani, M Alhaddad and A Ahmad (2012).JSIR, Vol 71, pp594-600. A study of digital mammograms by using clustering algorithms.
3. Prakash Bethapudi, E Sreenivasa Reddy, KVSRP Varma (2015) IJCA, Vol 111, Number 14, Article 8. Classification of Breast Cancer using Gini Index based Fuzzy Supervised Learning in Quest Decision Tree Algorithm
4. https://archive.ics.uci.edu/ml/machine-learning- databases/mammographic- masses/mammographic_masses.data
5. http://en.wikipedia.org/wiki/Confusion_matrix
6. http://en.wikipedia.org/wiki/Crossover_(genetic_al gorithm)
IJSER © 2015 http://www.ijser.org