Department of Physics, Gaya College, Gaya, Bihar, India - 823001
E-mail : rvkcharan@rediffmail.com
International Journal of Scientific & Engineering Research Volume 4, Issue 1, January-2013 1
ISSN 2229-5518
FORMATION OF PLANT BATTERY FROM XEROPHYTES
R.V.K. Charan,
Department of Physics, Gaya College, Gaya, Bihar, India - 823001![]()
E-mail : rvkcharan@rediffmail.com
Abstract:- Plants have got abundant bio-energy in form of electricity which is conserved mostly in their stem as food, and out of their different families the xerophytes’ have got the maximum energy due to their high conservation of food owing to adeptness of dry condition. The conserved bio-electrical power is produced actually across their eukaryotic cells due to formation of infinite primary cells according to the Nerst theory of Electrode potential. Now, since the nature has cascaded the cells in different fashion i.e. against the Ohm’s law of electricity it is not possible to get the whole power additively directly in natural fashion The present study is to harness the total conserved bio-electrical power in form of a simple Plant battery to operate low power electrical instruments. This is a step forward towards a new bio- source of non-conventional energy.
Keywords:-EPD , Stimulating , Ohmic circuit, eukaryotic cell, cascaded.
The nature has attributed abundant bio-energy to plants in form of electricity which is conserved as food in their organs mostly in their stems . Out of various families of plants, the cactaceae family that include xerophytics mainly have got the maximum energy ,obviously due to high conservation of food owing to their adeptness of dry conditions.
Several researchers, such as: Koppan et al (2)of Hungary and Morat et al(1) of Paris and Koppan et al (2)of Hungary have already worked on the Electrical Potential Difference(EPD) of the bio-energy conserved inside plant and have found that the EPD of a plant is directly proportional to the water potential and hence to the sap flux density.
Now, since these quantities are maximum in xerophytes, the EPD in such plants
IJSER © 2013 http://www.ijser.org
International Journal of Scientific & Engineering Research Volume 4, Issue 1, January-2013 2
ISSN 2229-5518
become maximum. Some other researchers, such as: Zimmermann et al(3) of Jena,USA has calculated the speed of electrical signaling in plant as 5-10 cm per minute owing to the EPD against enemies if the plant is wounded by cutting of its tissues .Further, the effect of oscillating / stimulating magnetic field on plant’s pulsation which is created due to the EPD has also been observed by the author(4,5) and has been found to have excited the pulsation rate. The excitation of the pulsation rate has been well harnessed by the author (6) in replacing the use of fertilizers to increase the plant’s growth.
The present study is to harness the total bio-electrical energy conserved inside the plants, specially inside the xerophytes, in form of a plant battery. This shall be a step forward towards a new source of bio-energy in a non-conventional form and shall add to the knowledge of bio-electrical power as well as of the science of plants.
Method:-We know that the total electrical potential of a group of chemical cells, called a
Battery, is achieved by cascading them in obeyance of the Ohm’s law of electricity i.e. by connecting positive polarity to negative polarity and negative polarity to positive polarity which is the cascading of the opposite polarities. But , as found experimentally, the nature has cascaded the plants’ cells in different fashion. So it is not possible to get the total EPD of the bio-energy directly .Hence, a suitable process is developed here to extract the total EPD of the plant for formation of an useful Plant Battery as a bio- physical source of energy to operate an instrument. To measure the electrical parameters i.e. the EPD in unit of Volt, current I in milliammeter, internal resistance r and the corresponding load resistance R in ohm of a plant (under investigation) an
Ohmic circuit is designed as shown below in Figure – 1.
IJSER © 2013 http://www.ijser.org
International Journal of Scientific & Engineering Research Volume 4, Issue 1, January-2013 3
ISSN 2229-5518
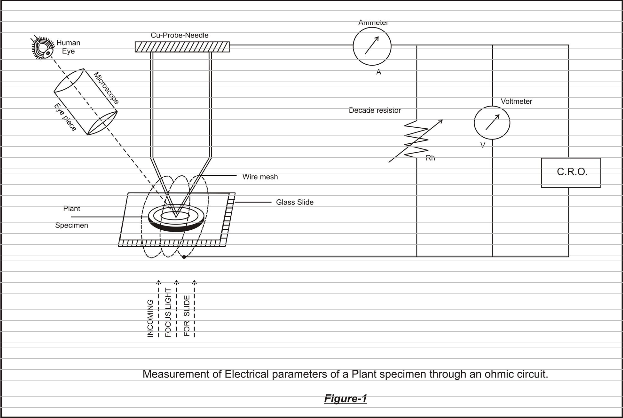
In the Ohmic circuit, a miliammeter for measuring the electrical current I and an external variable load resistor R are attached in series with the sample electrical source of plant’s section(under experiment). Further, a D.C. voltmeter along with an Oscilloscope (for more accuracy) is attached across the load resistor R to measure the EPD in volts. Now several transverse sections of its stem cell are obtained by cutting it into the thickness of nearly 0.5 micron.
Then a sample section is placed on a glass slide covered with wire mesh of copper for
seeking an external electrical connection from its lower surface .The wire mesh is used
IJSER © 2013 http://www.ijser.org
International Journal of Scientific & Engineering Research Volume 4, Issue 1, January-2013 4
ISSN 2229-5518
to allow the incoming focus light of the microscope into the slide The electrical connection from the upper surface of the section is taken through a copper- probe – needle. The two electrical connections are then introduced in an ohmic circuit as an electrical source. Now, according to Ohm’s law of electricity,
The internal resistance of the cell is given as,
r = V / I – R ……………………………………………….(I) Now, at r = R ,the maximum power transfer resistor is given as,
r 1 = V /2 I ………………………………………………(II)
And the electrical power is given as,
P = V . I ……………………………………………….(III)
For investigation, some xerophytic species of cactaceae family ,such as: Sanpedro cactus, Pentalobi Cactus,Opuntia dillenii, Opuntia elatior & Aloe vera were taken for the experiment where as some mesophytic species, such as Vaijantri, Calotropis procera were also taken for comparison. The aforesaid species are then placed into the aforesaid ohmic circuit (Fig.-1)as as electrical source one by one for measuring their electrical parameters. The values thus measured were computed in the aforesaid relations (I) ,(II) and (III) to calculate the internal resistance r ,electrical power P and the maximum power transfer resistor r1.The variations of these values with the load resistor R have been well exhibited in the corresponding one to one graphs in Figure Sl. No.2 to 8 of R- versus-r and r1 on the same axes and further in R-versus-V and versus-P graphs in Figures Sl. no. 09 & 10 .Here the r1 - line intersects the r-line with the load line of R at the critical point making r = r1 ≈. R. After knowing the values of
the load resistor R at the critical points and then the corresponding EPDs (i.e. the
IJSER © 2013 http://www.ijser.org
International Journal of Scientific & Engineering Research Volume 4, Issue 1, January-2013 5
ISSN 2229-5518
Voltages) from the 3D graph of R- versus – V in Figure Sl. no.09 a resultant bar – diagram graph in between the Species and the EPD in then drawn in Figure Sl. No.11 for comparative study. of EPD’s Further, for comparative study of the electrical power of the species a 3D graph is also plotted in Fig.Sl.no.10 in between R-versus-Power .
Result :- It has been observed that the EPD of a plant cell varies for different area of
the stem section. It becomes maximum in the xylem to phloem areas where as it reaches to its minimum value in the epidermis to the pith areas. The higher EPD areas can be defined as conducting area due to presence of more sap water, where as the less watery areas can be defined as non-conducting areas .Their variations in Figs..Sl. No.2-10 reveal the aforesaid various positions of the EPD. It has been observed here that the EPD varies from 6 to 10 milivolts up to the higher values of 70 to 83 mV in the mesophytic species of Vaijantri and the Calotropis procera respectively ,where as it reaches to its further higher value up to 140-180 mV in the xerophytic species. Out of the xerophytic species the opuntia elatior and the Aloe vera have got the EPD up to the maximum value of 176-180 mV. Further, their graphs of load resistance R-versus-the internal cell resistance r & the maximum power transfer resistance r1 (vide Figure Sl.No.02 to 08) reveal that the value of r begins from its maximum value to its minimum where as in reverse the value of r1 starts from its minimum value up to its maximum. In the aforesaid graph r- line intersects the r1-line along with the load line of R at a critical point where r = r1 ≈ R .This critical point of intersection can be considered as the best suitable value of the load resistor R for maximum smooth power transfer to external circuit. However, in cases of the plant species Vaijantri and Opuntia Dillenii the load line
of R intersects the r-line not at the intersection point of R and r1 lines but nearer to them.
IJSER © 2013 http://www.ijser.org
International Journal of Scientific & Engineering Research Volume 4, Issue 1, January-2013 6
ISSN 2229-5518
This is possibly due to some experimental errors. So in such errorful cases for getting the aforesaid critical value of R the average of values of two intersecting points is taken which is clearly exhibited in the graphs in figure Sl.no.2 & 5.
It has been also found interestingly that the natural cascading of the sections of the stem cells have been set in a directions against the cascading of cells as per the Ohm’s Law of electricity for i.e. after positive polarity negative polarity should come and after negative polarity positive polarity should come. The opposite natural cascading of plant’s cells bring down the overall voltage to be minimum and the total resistance to be higher. With this result it has been found interestingly that the total internal resistance of the plant’s cell increases with the increase of the thickness of the stem. Thus, or formation of a fruitful plant battery it is advisable at first to select the maximum energy contained species i.e. the opuntias or the Aloe vera out of the xerophytes as found from the comparative study of the EPDs from the 3D Graph of species -versus – EPD in its Figure Sl.no.09 along with the resultant Bar –diagram graph in figure Sl. No.11. Thereafter, the stem cells are cascaded in a battery like pot according to the Ohm’s Law of cascading of cells of electricity i.e. after the positive polarity the opposite negative polarity is attached and after the negative polarity the opposite positive polarity is attached. The aforesaid result for higher electrical power of the species can also be observed by viewing the R- versus- Power 3D graph in Figure Sl.no.10. Then an external workable load resistor has to be so chosen to match with the aforesaid critical load resistor R for smooth functioning of the maximum battery power.
Discussion:- The aforesaid bio-electrical power or the EPD of plants is produced
actually across their eukaryotic cells, which is possibly due to formation of infinite
IJSER © 2013 http://www.ijser.org
International Journal of Scientific & Engineering Research Volume 4, Issue 1, January-2013 7
ISSN 2229-5518
number of primary electrical cells across their living cell systems by dissolution of various metals(such as : N, P, K, Ca, Al, etc.) from high to low concentrations into the electrolyte formed in their food by photosynthesis from water. These metals are mostly found in the phloem area of vascular bundle in their different chemical form. The aforesaid formation of primary electrical cells are done actually in accordance with the “Nerst theory of Electrode Potential” in which the ionic action takes place between metals of high to low concentration into an electrolyte. Further, as stated above(1,2),as the bio-EPD across a cell is directly proportional to the sap flux density and as this quantity is found to be maximum in Aloe vera and opuntias,the EPD in these species are maximum. It is well exhibited in the graph of R – versus- V and R-versus- Power 3D graphs in Figure Sl. No.09 & 10 to be viewed along the resultant bar-diagram of Species- versus – EPD (Figure Sl. No.11). So for formation of a fruitful Plant Battery of maximum EPD i.e. of maximum bio-energy out of xerophytes it is advisable to form it out of the sections of the stem cells of opuntias or the Aloe vera and then to apply the critical value of the load resistor R for the best suitable power transfer state. For making electrical connections to the stem cells of selected species they first are covered with pressured copper plates and then cascaded as per the Ohm;s law of electricity in a battery box. .
A Plant Battery thus formed out of the aforesaid xerophytic species are a good source of bio-energy which is very useful to operate low potential instruments. After formation of the battery if the exposed portions of the cells are covered with any insulating materials, such as wax ,lac, etc,,then the life of the battery can be extended
even up to six months. However, it has got certain limitations, such as:
IJSER © 2013 http://www.ijser.org
International Journal of Scientific & Engineering Research Volume 4, Issue 1, January-2013 8
ISSN 2229-5518
(i) High potential instruments can’t be operated by this,
(ii) If the pressure on the copper plate covering the plant’s stem section is increased beyond a threshold preset value, then the natural electrolyte i.e. the sap preserved inside the cell as food may leak out destroying the very formation of the cells and their bio-EPD as a whole.
(iii) Further, the battery should be protected from any short circuiting from outside as it may also destroy the plant cell generating the EPD.
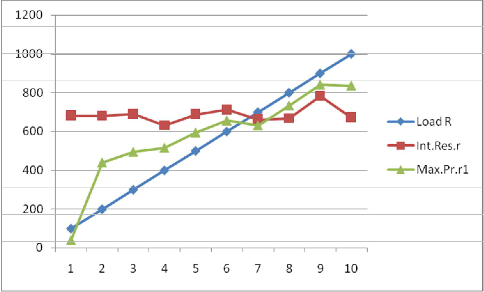
FIGURE SL. NO.02
Variations of Load Resistance R with Internal Resistance r and Maximum Power Transfer
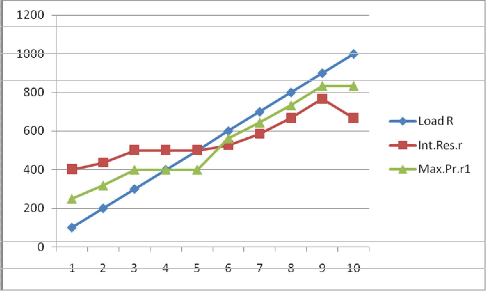
Resistance r1 of the plant specie – Vaijantri
IJSER © 2013 http://www.ijser.org
International Journal of Scientific & Engineering Research Volume 4, Issue 1, January-2013 9
ISSN 2229-5518
Here the load line R intersects the internal resistance line r at value of 500 ohms quite nearer (possibly due to some experimental errors)to the intersecting point of the two resistance line o f internal resistance r and maximum power transfer resistance r1 .
![]()
Hence, the Inference at the intersecting point is r = r1 ≈ R = Average: (562 + 500)/2 = 531
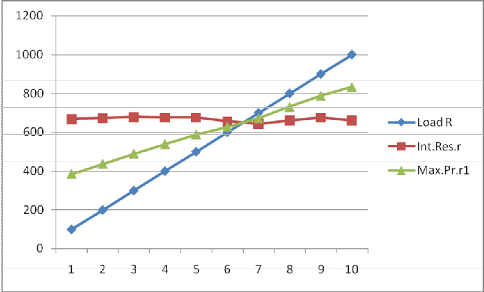
FIGURE SL. NO.03
Variations of Load Resistance R with Internal Resistance r and Maximum Power Transfer
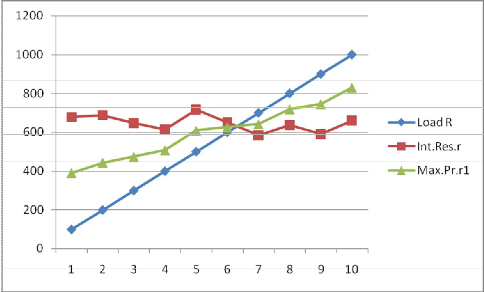
Resistance r1 of the plant specie – Calotropis Procera
IJSER © 2013 http://www.ijser.org
International Journal of Scientific & Engineering Research Volume 4, Issue 1, January-2013 10
ISSN 2229-5518
Here the load line R intersects at the two intersecting point of the internal resistance r and maximum
power transfer resistance r1 at a value of 625 ohms.
![]()
Hence, the Inference at the interference point is r = r1 = R = 625 ohms
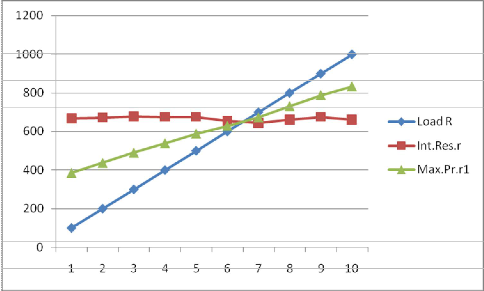
FIGURE SL. NO. 04
Variations of Load Resistance R with Internal Resistance r and Maximum Power Transfer
Resistance r1 Of the plant specie – Sanpedro Cactus
IJSER © 2013 http://www.ijser.org
International Journal of Scientific & Engineering Research Volume 4, Issue 1, January-2013 11
ISSN 2229-5518
Here value all the three lines of load r ,internal resistance rand maximum power transfer resistance r1 intersect at a common point of 826.8 ohms.
![]()
Hence, the Inference at the interference point is r = r1 = R = 826.8 ohms
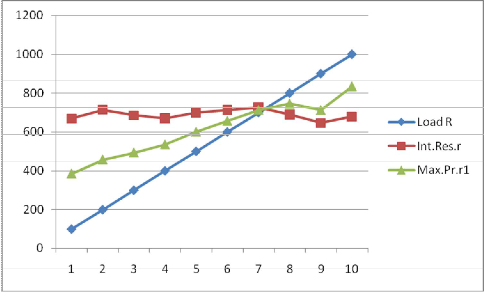
FIGURE SL. NO. 05
Variations of Load Resistance R with Internal Resistance r and Maximum Power Transfer
Resistance r1 of the plant specie – Opuntia Dillenii
IJSER © 2013 http://www.ijser.org
International Journal of Scientific & Engineering Research Volume 4, Issue 1, January-2013 12
ISSN 2229-5518
Here the load resistance line R intersects internal resistance line r at the value of 662.5 ohms quite nearer (possibly due to some experimental errors)to the intersecting point of 631.2 ohms of internal resistance r and maximum power transfer resistance r1
![]()
Hence, the Inference, r = r1 ≈R = Average:(662.5+631.2)/2 =646.85 omhs
FIGURE SL. NO.06
Variations of Load Resistance R with Internal Resistance r and Maximum Power Transfer
Resistance r1 of the plant specie – Pentalobo Cactus
IJSER © 2013 http://www.ijser.org
International Journal of Scientific & Engineering Research Volume 4, Issue 1, January-2013 13
ISSN 2229-5518
Here the load line R intersects the intersecting point of resistance liner and maximum power transfer
resistance line r1 at a value of 672 ohms.
![]()
Hence, the inference at the intersection point is r = r1 = R =672 ohms
FIGURE SL. NO.07
Variations of Load Resistance R with Internal Resistance r and Maximum Power Transfer
Resistance r1of the plant specie – Opuntia Elatior
IJSER © 2013 http://www.ijser.org
International Journal of Scientific & Engineering Research Volume 4, Issue 1, January-2013 14
ISSN 2229-5518
Here the load line R intersects at the two intersecting point of the internal resistance r and maximum
power transfer resistance r1 at a value of 713.5 ohms.
![]()
Hence, the inference at the intersection point is r= r1 = R = 713.5 ohms
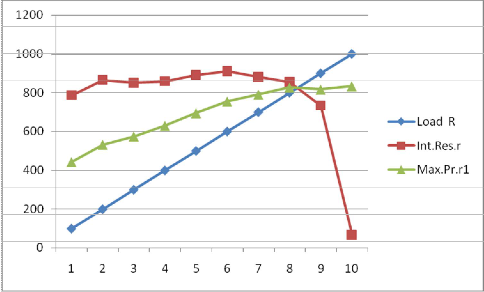
FIGURE SL. NO.08
Variations of Load Resistance R with Internal Resistance r and Maximum Power Transfer
Resistance r1 of the plant specie – Aloe Vera
Here the load line R intersects at the two intersecting point of the internal resistance r and
maximum power transfer resistance r1 at a value of 713.5 ohms.
IJSER © 2013 http://www.ijser.org
International Journal of Scientific & Engineering Research Volume 4, Issue 1, January-2013 15
ISSN 2229-5518
![]()
Hence, the inferenceat the intersection point is r= r1 = R = 713.5 ohms
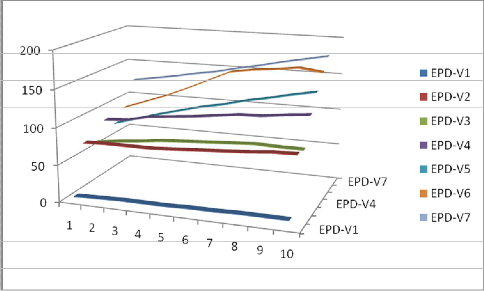
FIGURE SL. NO. 09
Variation of EPD (i.e.voltage) as per the all species taken for experiment in 3D
positions
IJSER © 2013 http://www.ijser.org
International Journal of Scientific & Engineering Research Volume 4, Issue 1, January-2013 16
ISSN 2229-5518
Here the 3D variation of the EPD shows clearly the independent rise of EPD of the species.In it the V1 represents as the specie Vajantri,V2 as Calotropis Procera,V3 as Sanpedro Cactus,V4 as Opuntia Dillenii,V5 as Pentalobi Cactus,V6 as Opuntia Elatior and V7 as Aloe Vera
FIGURE SL. NO. 10
Variation of Electric Power – versus - all species taken for experiment in 3D
positions
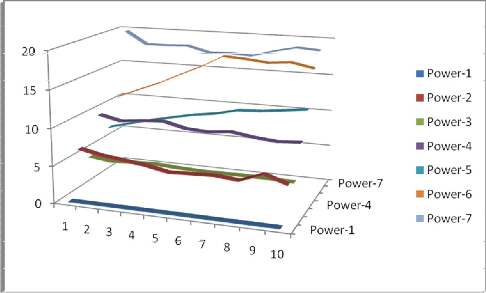
Here the 3D variation of the Electric Powers as per the species shows clearly the independent rise of the power of the species and is very nearer to that of variations of EPDs .In it the Power-1
IJSER © 2013 http://www.ijser.org
International Journal of Scientific & Engineering Research Volume 4, Issue 1, January-2013 17
ISSN 2229-5518
represents as the electric power of the specie Vajantri,Power-2 as that of Calotropis Procera,Power-3 as that of Sanpedro Cactus,Power-4 as that of Opuntia Dillenii,Power-5 as that of Pentalobi Cactus,Power-6 asthat of Opuntia Elatior and Power-7 as that of Aloe Vera.
FIGURE SL. NO.11
Bar Diagram of Species –versus—EPD (i.e.voltage)

Here , a comparative variation chart of EPD as per the all species taken for experiment is
shown.In it Op. Elatior is Opuntia Elatior,Pen. Cactus is Pentalobi Cactus,Op.Dillenii is
IJSER © 2013 http://www.ijser.org
International Journal of Scientific & Engineering Research Volume 4, Issue 1, January-2013 18
ISSN 2229-5518
Opuntia Dillenii,San. Cactus is Sanpedro Cactus and Cal. Procera is Calotropis Procera in full term.
References:-
1 ) .Morat et al,Electrical Potential on Tree, A Measurement of the Sap Flow,C.R. Acad, Sci., Science de la vie / life Sciences,317:98-101 ,Paris (1994)..
2) Koppan et al, Proceedings of 7th Hungarian Congress on Plant Physiology
,Institute of Nuclear Research of The Hungarian Acedamy,Debrencen,Hungary,SI- p.06,Acta Biologica Szegediensis,Vol.46 (3-4): 37-38 ,Hungary (2002).
3 ) Zimmermann et al,System Potentials, A Novel Electrical Long-Distance
Apoplastic Signal In Plants, Induced by Wounding, Plant Phyisiology,:149(3): 1593
DOI:10,1104/pp.108,133884.,Jena,U.S.A. (2009)
4 ) Charan R V K, Effect of Oscillating Magnetic Field On Plants(Short Note),
Indian.J.Theo.Phy. No.1.Vol.,57,2009,p-79 ,Kolkata,India (2009).
5 ) Charan R V K, Effect O f Stimulating Magnetic Field On Plant, Article Base.Com, USA, (Published online-06.06.2009).
IJSER © 2013 http://www.ijser.org
International Journal of Scientific & Engineering Research Volume 4, Issue 1, January-2013 19
ISSN 2229-5518
6 ) Charan .R V K. ,Magnetic Stimulation Replacing Fertilizers Causing Health
Hazards In Plants, J. of Life Sciences, David publishing., Vol.5, No.4, sl.36, p-322-325
U.S.A. April,( 2011).
Acknowledgment: - The author expresses his sincere gratitude to Dr. Arvind Kumar
Sinha, Professor of Botany and to Dr. Ranjana Singh, Research Scholar of Botany for their sincere cooperation with valuable suggestions all the time. His gratitude shall not be complete unless it is extended to the University Grant Commission at Kolkata for providing financial assistance through a minor research project and to the his Department of Physics and the parent Gaya College , Gaya , Bihar ,India at large for providing the necessary infrastructure.
---------------------------------------------------------------------------------------------------
IJSER © 2013 http://www.ijser.org