The research paper published by IJSER journal is about F-CHART METHOD FOR DESIGNING SOLAR THERMAL WATER HEATING SYSTEMS 1
ISSN 2229-5518
F-Chart Method for Designing Solar Thermal
Water Heating Systems
I. F. Okafor and G. Akubue
Abstract- Solar energy systems convert solar energy into useful energy. But the performance of these systems depends on weather and exhibit a nonlinear dependence. This makes it difficult to accurately analyze their performance by simply observing their response to short-term or average weather conditions. Thus this work analyzes the use of f-chart method in designing liquid solar heating systems due to its simplicity and ability to estimate the fraction of total heating load supplied by solar heating system. This method is widely used in designing both active and passive solar heating systems, especially in selecting the sizes and type of solar collectors that provide the hot water and heating loads. It designs solar water heating system for a family of six in Nsukka community using f-chart method and the annual fraction of the load supplied is 0.44, indicating that 44% of the annual load is supplied by solar energy. It also presented the design considerations for long-term performance for the solar water heating system, f-chart validation and its limitations.
Keywords- f-chart method, solar energy, water heater
——————————————————————————————
1 INTRODUCTION
SOLAR energy is simply a radiant energy direct from the Sun to the Earth surface, occurring between
0.3 and 1.2 micrometer in the spectrum of light waves [1]. As the Earth orbits the Sun, it receives about 1,353W/m2 of energy as measured on a surface kept normal to Sun. But only a fraction this energy gets to the Earth surface. Some of them are reflected back into the space, while others are scattered by water droplets in the clouds and dust particles. Thus the average solar radiation received at the Earth’s surface is approximately 630W/m2 [2]. Nigeria receives an average solar radiation of about
7.0kW/m2 day (25.2MJ/m2day) in the far north and about 2.5kWh/m2 day (12.6MJ/m2day) in the coastal latitude [3]. But this has not been adequately harnessed due to a number of barriers - economic/financial, technical, institutional and legislative barriers, etc.
Solar energy is used for a variety of heating
purposes such as heating of home and spaces, industrial processes, thermal treatment of water
———————————————————
National Center for Energy Research
And Development, University of Nigeria, Nsukka, Enugu State, Nigeria izufrank123@yahoo.com
supply, production of hot water and steam for industries etc. It is also used in the generation of electricity using solar-powered thermal electric generating systems. Solar energy systems convert solar energy into either thermal or electrical energy and such systems can either be passive or active systems. The passive systems do not require input of any form of energy apart from the solar radiation, while the active systems require additional mechanisms such as circulation pumps, air blowers or automatic systems etc.
The performance of all solar energy systems depends on the weather factors (level and distribution of isolation, ambient temperature), solar system parameters (collector type, storage capacity) and load characteristics (space heating, water heating, temperature level). Solar energy systems exhibit nonlinear dependence on weather and this makes it difficult to accurately analyze their performance by observing their response to short- term or average weather conditions [4]. Due to the nonlinear dependence of these systems on weather conditions on both short-term (e.g. hourly) and long- term (e.g. seasonal), analyses of these systems require an examination of their performance over a long period of time. As a result, experiments are very expensive and time-consuming and difficult to vary parameters to see their effect on the system performance.
IJSER © 2012 http://www.ijser.org
The research paper published by IJSER journal is about F-CHART METHOD FOR DESIGNING SOLAR THERMAL WATER HEATING SYSTEMS 2
ISSN 2229-5518
In alternative, computer simulations can provide analyses of the solar energy systems when provided with necessary meteorological data. Mathematical
models can also be formulated to simulate the transient performance of these systems. This can provide the same information on the thermal performance of these systems as that of physical experiment with less time and expense. But using detailed computer simulations in the routine design of solar energy systems are not satisfactory as they require so much time, fund and expertise to obtain the desired results [4]. It therefore becomes very necessary to develop a simplified design procedure for estimating the long-term average performance of these solar energy systems which could require only very few calculations using the available meteorological data.
Different design methods have been developed
for designing solar energy systems, which ranges from detailed simulation, simple designing methods such as f-chart method to rule of thumb [2]. This work analyzes the use of f-chart method in designing liquid solar heating systems due to its simplicity and ability to estimate the fraction of total heating load supplied by solar heating system. This method is widely used in designing both active and passive solar heating systems, especially in selecting the sizes and type of solar collectors that provide the hot water and heating loads [5].
2 THE F – CHART METHOD
F – chart is the authoritative solar system analysis and design program written by S.A. Klein and W.A Beckman, the originators of the F – chart method [6]. The F – chart method provides a means of easily determining the thermal performance of active solar heating systems (using either liquid or air as the working fluid) and solar domestic hot water systems. The F – chart method is essentially a correlation of the results of hundreds of simulations of solar heating systems. The conditions of the resulting correlations give F, the fraction of the monthly heating load (for space heating and hot water) supplied by solar energy as a function of two dimensionless variables involving collector characteristics, heating loads, and local weather. F- Chart is utilized in estimating the long-term average
of solar collectors such as flat-plate, evacuated tube and compound parabolic concentrating etc.
2.1 System Configuration
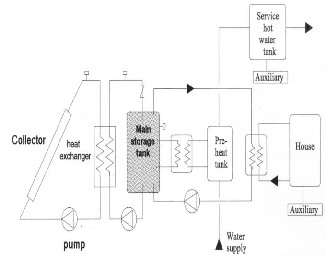
Fig. 1 shows a standard configuration of the solar heating system covered by the f-chart method. This system may use water or an antifreeze solution as the collector heat transfer fluid. If the collector heat- transfer fluid is not water, a heat exchanger is used between the collectors and the tank. A water-to air heat exchanger is used to transfer heat from storage tank to the building. Controllers, relief valves, pumps, and piping make up the remaining equipment. In this system, energy from the collector loop is transferred from the collector fluid to the preheat storage tank directly or via an external heat exchanger. A typical- use profile, was assumed in the development of the correlation. Losses from the auxiliary tank were not considered in the correlation [4]. The range of design parameters for which this method is applicable is given in table1. The f-chart correlation for solar domestic water heating system performance developed for the two-tank system is shown in figure 2.
2.2 Basic Equations of the f-Chart Method
The f-Chart method is a correlation of the results of many hundreds of thermal performance simulations of solar heating systems [5]. The resulting simulations give f, the fraction of the monthly heating load (for space heating and hot water) supplied by solar energy as a function of two dimensionless parameters, X and Y. Where X is the ratio of collector losses to heating loads and Y is the ratio of absorbed solar radiation to the heating loads are given in equations (1) and (2).
Reference collector energy
X= loss during a month (1)
Total heating load during a month
Total energy absorbed on the
Y = Collector plate during a month (2)
Total heating load during a month
The equations [8] for X and Y can be written as follow:
performance of the following solar systems: water
storage heating, pebble bed storage heating, building
storage heating, domestic water heating, integral


X FR U L

F ' R
F

A
100 T t
L
(3)
R
collector-storage DHW, passive collector-storage
wall, etc [5]. It is used in evaluating the performance
IJSER © 2012 http://www.ijser.org
The research paper published by IJSER journal is about F-CHART METHOD FOR DESIGNING SOLAR THERMAL WATER HEATING SYSTEMS 3
ISSN 2229-5518


Y FR n
F ' R
F
A
L .N (4)
A solar water heating system is to be designed for a family of six in Nsukka community (Latitude of 6o 52
o

R n N’, Longitude 7
24’E and altitude 397m [9]), with
For liquid heating systems, the f-chart method is based upon the system configuration shown in figure 3. The monthly solar fraction f can be determined from the following relation, which has been obtained by regression from a detailed computer simulation:
f = 1.029Y - 0.065X - 0.245Y2 +
0.0018X2+0.0215Y3 (5)


Subject to the conditions that: 0 X 15 and


0 Y 3, [7].
This equation cannot be used outside the range
shown by the curves in figure 3 as a result of its nature. However, if a calculated point falls outside this range, the graph can still be used for extrapolation with satisfactory results.
The monthly total heating load is also needed for
these calculations. It consists of the water heating load and the piping heat losses. The monthly water heating load is calculated by using the equation [8]:
Lw = cpρhw(Tw - Tm)N (6)
Also, the monthly piping heat loss is calculated as:
Lp = Upl (Tw - Tα)NΔtp (7)
The monthly total heating load is the sum of the
above two terms: L = Lw + Lp (8)
2.3 F- Chart Calculation Method

In f-Chart method, system performance is expressed in terms of f, which is the fraction of the heating load supplied by solar energy during each month. The relationship between f and the dimensionless variable X and Y is shown in figure 3 for the water system. The f-chart method proceeds as follows: (i) the dimensionless variables X and Y are calculated for each calendar month. (ii) The intersection of the X and Y values in figure 3 locates a value of f which is the fraction of the heating load supplied by solar energy for that month. The calculations are repeated for each month. The fraction of the annual heating load supplied by solar energy f is the sum of the product of monthly solar energy fraction fi and the monthly thermal load Li divided by the annual load L [5].

one cover collector facing south at a slope of 22o. Assuming the water heating collector characteristics are: FRUL= 4.00W/m2, FR(τα)n = 0.74 and (τα)/(τα)n =
0.94 as determined from standard collector tests [2].
The water storage tank capacity is 120litre/m2 and
the collector-heat exchanger correction factor, F1R/FR is 0.97. Table 1 shows the monthly average daily radiation HT(MJ/m2) in Nsukka [10]. The average daily radiation for January in Nsukka is 16.6MJ/m2. The fraction f of the load to be supplied by solar energy with the collector area of 20m2 is determined using equations (3) and (4). The heating load for the hot water is determined as follows using equation (6), with the average ambient temperature of 26.6ºC, hot water required temperature of 80oC and water required per day, 120liters.
Lw = cpρhw(Tw - Tm)N = 0.83GJ.
With the collector area Ac of 20m2, X/Ac and Y/Ac are determined as follows using equations (3) and (4):
X/Ac = 0.92m-2
Y/Ac = 0.41m-2
The storage size correction factor = (M/75)-0.25 = 0.88
Thus the corrected X/Ac = 0.88 x X/Ac and Y/Ac = 0.88
Y/Ac. Table 2 shows the calculated results for the
entire months of the year. For the collector area of
20m2, X and Y are determined by multiplying the corrected X/Ac and Y/Ac with the collector area. Table
2 show the calculated results for X and Y for the entire months of the year. The variables X and Y are then used to determine fi, the monthly fraction of the load to be supplied by solar energy. The energy contribution for each month is the product of fi and the monthly heating and hot water load Li. For January using equation (5) the monthly fraction of the load to be supplied by solar energy is determined as follows:
f = 1.029(7.2) - 0.065(16.2) – 0.245(7.2)2 + 0.0018(16.2)2
+ 0.0215(7.2)3 = 2.41
The solar energy supplied by this system in January
is fL = 2.41x 0.83GJ = 1.97GJ.
f i Li
f =
L
(9)
The annual system performance is obtained by
i
3 DESIGNING SOLAR WATER HEATING SYSTEM USING F-CHART METHOD
summing the energy quantities for all months as
given in equation (9). The annual fraction of the
load supplied by solar energy is obtained as follows: F = 9.89/22.59 = 0.44 (44% from solar energy). This
IJSER © 2012 http://www.ijser.org
The research paper published by IJSER journal is about F-CHART METHOD FOR DESIGNING SOLAR THERMAL WATER HEATING SYSTEMS 4
ISSN 2229-5518
indicates that 44% of the annual load is supplied by solar energy.
4 DESIGN CONSIDERATIONS FOR LONG- TERM PERFORMANCE
The f-Chart curves are numerically generated using fixed nominal values for storage capacity per unit collector area, collector liquid flow rate per unit collector area, and load heat exchanger size relative to space heating load. Thus it is very important to take into account the sensitivity of these design parameters in long-term performance of the system and to make corrections when necessary. The parameters to consider are discussed in the following sections.
4.1 Storage Capacity. The annual performance of a liquid solar system is relatively insensitive to storage capacity as long as the capacity is more than 50 liters
4.3 Load Heat Exchanger Size. The size of load heat exchanger strongly affects the performance of the heating system. The size of heat exchanger is measured by the dimensionless parameter:
Z = (eL . Cmin)/(U . A) (11)
Practical values of Z are generally between 1 and 3 when the cost of heater exchanger is considered [2]. The dependence of the system performance on the size of load heat exchanger is found to be asymptotic and only small improvement of the system performance can be achieved if the value of (eL . Cmin)/(U .A) is increased beyond 2or 3 [7]. The f-chart for liquid system was developed with (eL .Cmin)/(U .A)
= 2. This chart can be used to estimate the annual performance of systems having other values of (eL
.Cmin)/(U.A) by multiplying Z with the following

correction factor: Load heat exchanger correction factor
of water/square meter of collector [2]. Only small
improvements in annual performance can result from any added storage capacity. The f-Chart has


Kl 0.39 0.65
exp
0.139
eL
U A
Cmin
been generated for a storage capacity of 75 liters of
stored water per square meter of collector area. It can also be used to estimate the annual performance of systems with other storage capacities in the range of 37.5 to 300litre/m2 by multiplying the dimensionless parameter X by a storage size correction factor Xc/X:
Xc/X = (Actual storage capacity/Standard
Storage capacity)-0.25 (10) For 0.5 ≤ (Actual storage capacity/Standard storage capacity) ≤ 4.0. Where the standard storage capacity is 75 liters of water per square meter of collector area [2].
4.2 Collector Liquid Flow Rate. The dependence of the system performance on the collector flow rate is asymptotic and only a small gain in energy collection rate is realized if the flow rate-specific heat product is increased beyond 50W/k per square meter of collector area [2]. Having a longer flow rate can reduce energy collection rate significantly, particularly if the fluid boils and energy must be dumped through the pressure relief valve. The f- Chart has been generated using a collector fluid flow rate equivalent to 0.015 liter/s of antifreeze solution per square meter of collector area. Since an increase in collector flow rate beyond this nominal value only has a small effect on system performance, the correlations are applicable for all practical collector liquid flow rates.
For 0.5 (eL . Cmin) 50 (12) (U. A),
where eL = Heat exchanger’s exploitation coefficient and Cmin = minimum fluid capacitance rate (product of the fluid’s mass flow rate and specific heat capacity) in the load heat exchanger [7].
5 VALIDATION OF F-CHART METHOD
The f-Chart method has been validated in two ways. First, the performance predictions of f-Chart have been compared with calculations made by Transient System Simulation Program (TRNSYS) and found that the standard error between the TRNSYS simulations and the f-Chart results was about
2.5%.[12]. Secondly, f-Chart has also been compared
with experimental results. Many experimental data on solar heating system performance are now available since the f-Chart method was developed. The f-Chart method was compared with the experimental performance of five active solar domestic hot water systems with f-Chart predictions for a two year period [11]. In this comparison, the f-
Chart predictions were fund to be 1% to 5% lower than the experimental measurements. The f-Chart predictions and experimental performance for 20 space heating and 11 solar domestic hot water systems were also compared [12]. They conclude that good agreement between experimental and predicted performance is obtained for systems
IJSER © 2012 http://www.ijser.org
The research paper published by IJSER journal is about F-CHART METHOD FOR DESIGNING SOLAR THERMAL WATER HEATING SYSTEMS 5
ISSN 2229-5518
having the configurations assumed in the development of the f-Chart method. Other studies have also shown good agreements between
experimental results and f-Chart predictions.
6 F – CHART LIMITATIONS AND DISADVANTAGES
The f-Chart method is widely used in designing new systems and performance analyses of existing systems. It is very useful in the applications for which it was developed; the f-Chart has some limitations. The f-Chart was developed only for standard type of solar space and domestic water heating systems [4]. The parameters ranges for which the method is applicable are limited. Using the f-Chart method for system other than those for which it was originally developed or for design parameters outside the range of the correlations may produce erroneous results. Although the systems and parameter ranges for which the f-Charts are applicable are clearly indicated in the original references, the method has been incorrectly applied to space heating systems with no storage, solar cooling systems, and systems having control strategies that differ from those for which the method was designed[4]. Performance estimates obtained from the f-Chart method have been shown to be in good agreement with the experimental performance of many carefully monitored systems. But, the f-Chart method was not intended to be used for performance prediction and cannot be expected to predict the performance of real systems where there are many factors (such as improper installation) that prevent a system from operating as designed.
The f-Chart method estimates only the thermal performance of a system. Parasitic energy use by the
pumps, fans and controllers is not accounted for. Although the parasitic energy used is ordinarily a small fraction of about 5% of the total energy use in
well-designed systems [13]. The only meteorological data input to the f-Chart method are monthly solar radiation and ambient temperatures. Specific local effects, such as high mountains or typical morning fog, cannot be accounted for. This shows that the f- Chart method significantly under predicts system performance in overcast climates. The under prediction occurs because the distribution of solar radiation is very different from that built into the f- Charts.
7 CONCLUSION
F-chart is the authoritative solar system analysis and design program developed by S.A. Klein and W.A. Beckman. It provides a means of easily determining the thermal performance of solar energy heating systems (using either liquid or air as working fluid). This work has analyzed the use of f-chart method in designing liquid solar heating systems due to its simplicity and ability to estimate the fraction of total heating load supplied by solar heating system. It also designed a solar water heating system for a family of six in Nsukka community using f-chart method. The major advantage method is that it provides a means of designing solar energy systems with less computational effort. Performance estimates obtained from the f-chart method have been shown to be in good agreement with the experimental performance of many carefully monitored systems, but cannot be used where there are many factors (such as improper installation) that prevent a system operating as designed.
Fig.1: Standard F-chart system configuration for space heating using a liquid storage tank [8]
Table 1


Ranges of design parameters used in the f-chart for liquid systems [8]
0.6 (τα)n 0.9 |
5 F’R.A 120 m2 |
2.1 UL 8.3 W/m2 oC |
30 β 80 deg |
83 (U.Α)h 667 W/oC |
IJSER © 2012 http://www.ijser.org
The research paper published by IJSER journal is about F-CHART METHOD FOR DESIGNING SOLAR THERMAL WATER HEATING SYSTEMS 2

ISSN 2229-5518
Oct. | 16.2 | 25.3 | 0.92 | 0.40 | 0.81 | 0.35 |
Nov. | 17.1 | 26.7 | 0.93 | 0.44 | 0.83 | 0.39 |
Dec. | 16.2 | 25.7 | 0.92 | 0.41 | 0.81 | 0.36 |
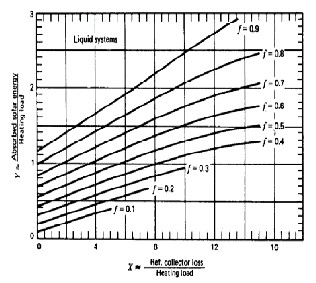
Fig.2 Schematic of the Standard f-chart system configuration for water heating only [8]
Table 3
Monthly Heating Load Calculations Using F-Chart
Method
Figure 3: The f-Charts for Systems Using Liquid
Heat Transfer and Storage [2]
Table 2
Monthly Av. Solar Radiation and Ambient
Temperature in Nsukka
Nomenclature
Ac = Area of solar collector (m2),
F’R = Collector-heat exchanger efficiency factor (%),
FR = Collector heat removal factor (%),
UL = Collector overall energy loss coefficient
(W/m2-°C),
Δτ = Total number of seconds or hours
in the month,
Ta = Monthly average ambient temperature (°C),
L = Monthly total heating load for space heating
and hot water (GJ),
HT = Monthly averaged, daily radiation incident on
collector surface per unit area (MJ/m2),
N = Number of days in the month,
(τα ) = Monthly average transmittance-absorptance
IJSER © 2012 http://www.ijser.org
The research paper published by IJSER journal is about F-CHART METHOD FOR DESIGNING SOLAR THERMAL WATER HEATING SYSTEMS 3
ISSN 2229-5518
product (%),
(τα)n = Normal transmittance-absorptance
product (%), and
Tref = Reference temperature (100 °C). cp = specific heat of water
ρ = density of water
hw = hot water daily consumption
Tw = required hot water temperature
Tm = mains water supply temperature
N = number of days in the month.
Up = piping heat loss coefficient
l = pipe length
Tα = ambient temperature in the vicinity of piping
Δtp = number of hours of use per day.
References
[1] Oluka, S.I., Onwualu, A.P. and Eneh I.I. Engineer-in-Society, 1999. SNAAP Printers and Publisher, Enugu.
[2] Duffie, J.A. and Beckman, W.A. Solar Engineering of Thermal Processes, 1980. New York: Wiley Interescience.
[3] Ilenikhena, P.A. Potential Areas of Solar Energy Applications in Nigeria for National Development. Proceedings of Int’l W/shop on Renewable Energy for Sustainable Development in Africa, 2007.
[4] Module 3.3. Design of Solar Thermal Systems,
(nd) (Unplublished manuscript).
[5] Haberl, J. S.and Soolyeon Cho P.E. Literature
Review Of Uncertainty Of Analysis Methods (F- Chart Program), 2004. Energy Systems Laboratory Texas Engineering Experiment Station Texas A&M University System.
[6] F-Chart Active and Passive Solar Systems
Analysis , 2008. www.fchart.com/fchart/fchart.shtml [7] Intelligent Energy for Europe Identification of an optimal combined scheme S/W application for Solar
& Biomass systems evaluation. ACCESS Accelerated Penetration of Small-Scale Biomass and Solar Technologies Work Package IV, EIE/05/ 048/ SI2.420191, 2005.
[8] Agbo, S. N. and Unachukwu, G.O. Design and
Performance of a Domestic Thermosyphon Solar Water Heater for an Average-Sized Family in Nsukka Urban. Trends in Aplied Sciences Research 2 (3) 224-230, 2007. Academic Journals.
[9] Ugwuoke, P.E. and Okeke C.E. Statistical
Evaluation of Average Global and Diffuse Solar Radiation on Horizontal Surfaces at Nsukka, Nigeria. Nigerian Journal of Solar Energy. Published
by Solar Energy Society of Nigeria. Vol. 19 No. 2,
2008. www.sesn.org.nig.
[10]. Agbo, S. N and Ezema. Evaluation of the
Regression Parameters of the Angstrom-page Model for Predicting Global Solar Radiation. Proceedings of Int’l W/shop on Renewable Energy for Sustainable Development in Africa, 2007.
[11] Fanney A.H. and Klein, S.A. Performance of
solar Domestic Hot Water Systems at the National Bureau of Standard-measurements and Predictions. Journal of Solar Energy Engineering, 1983.
[12] Duffie, J.A. and Mitchell, W.J. F-Chart:
Predictions and Measurements. J. Solar Energy Eng.
105: 3-9, 1983.
[13] Mosley, J. and Clark, G. The effect of detailed Solar Climatology on accuracy of f-chart. Proc. ASES/ISES Annual Meeting, Philadelphia PA, 1981.
IJSER © 2012 http://www.ijser.org