International Journal of Scientific & Engineering Research, Volume 1, Issue 2, November-2010 1
ISSN 2229-5518
Exudates Detection Methods in Retinal
Images Using Image Processing
Techniques
V.Vijayakumari, N. Suriyanarayanan
Abstract— Exudates are one of the most common occurr ing les ions in diabetic retinopathy. Exudates c an be identified as areas with hard white or yellowish colors and varying sizes , shapes and loc ations near the leaking capillaries within the retina. The detection of exudates is the major goal. For this the pre-r equisite stage is the detection of optic disc. Onc e the optic disc is found
certain algorithms c ould be us ed to detect the pres enc e of exudates. In this paper f ew methods are us ed f or the detection and the perf ormanc e of all the methods are c ompared.
Keywords — Capillaries, diabertic retinopathy, exudates ,optc disks.
—————————— • ——————————
India and China are, and will remain, the leading coun- tries in terms of the number of people with diabetes melli- tus in the year 2025. Among the 10 leading countries in this respect, five are in Asia. Although only a moderate increase in the total population in China is expected in the next 25 years, China is estimated to contribute almost 38 million people to the global burden of diabetes in the year
2025. India, due to its immense population size and high diabetes prevalence, will contribute 57 million [1]and [2]. These figures are based on estimated population growth, population ageing, and urbanization, but they do not take into account changes in other diabetes-related risk factors.
So, Diabetic screening programmes are necessary in addressing all of these factors when working to eradicate preventable vision loss in diabetic patients. When per- forming retinal screening for Diabetic Retinopathy [3] some of these clinical presentations are expected to be imaged. Diabetic retinopathy is globally the primary cause of blindness not because, it has the highest inci- dence and it often remains undetected until severe vision loss occurs. Advances in shape analysis, the development of strategies for the detection and quantitative characteri- zation of blood vessel changes in the retina are of great importance. Automated early detection of the presence of exudates can assist the ophthalmologists to prevent the spread of disease more efficiently.
Direct digital image acquisition using fundus cameras combined with image processing and analysis techniques has the potential to enable automated diabetic retinopathy screening. The normal features of fundus images include optic disk, fovea and blood vessels. Ex-
udates and haemorrhages are the main abnormal features which is the leading cause of blindness in the working age population.
Optic disk is the brightest [4] part in the normal fundus images which can be seen as a pale, round or vertically slightly oval disk. Finding the main components in the fundus images helps in characterizing detected lesions and in identifying false positives. Abnormality detection in images is found to play an important role in many real life applications [5] suggested neural network approach for the detection and classification of exudates. A decision support frame work for deducing the presence or absence of DR are developed and tested [6]. The detection rule is based on binary-hypothesis testing problem which simpl- ifies the problem to yes/no decisions. The results suggest that by biasing the classifier towards DR detection, it is possible to make the classifier achieve good sensitivity.
Here, in this method we use the concept that in normal retinal images the optic disc is the brightest part and next to it comes the exudates. So once after detecting the optic disc, the centre point is determined for extraction of vari- ous features in the image. Then the optic disc is removed from the image, thus we are now left with exudates as the next brightest region. Here again we can apply Binary Image [7] and proper threshold value is set and the ex- udates can be easily identified from the test image. The
IJSER © 2010 http://www.ijser.org
International Journal of Scientific & Engineering Research, Volume 1, Issue 2, November-2010 2
ISSN 2229-5518
results are shown in figures 1 and 2.
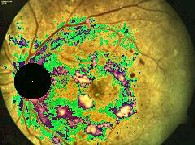 Figure 3. REFERENCE IMAGE
Figure1. INPUT OPTIC DISK EXTRACTED IMAGE 
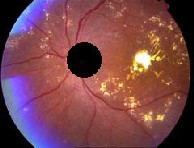
 Figure 4. TEST IMAGE
Figure2. OUTPUT BINARY IMAGE SHOWING EX- UDATES IN WHITE
For The concept behind this method is that, a normal and healthy retinal image is taken and it is kept as the refer- ence to isolate the abnormalities in the test image. This reference image acts as the template. Both the reference image and test images are converted from RGB to GRAY levels and then pixel by pixel both the images are com- pared. During comparison, the additional objects present in the test image get isolated and they are clearly visible in the output. If the test image is normal, then while com- parison it gets cancelled as there is no difference of pixel value between the two, where as in the test image with exudates, the optic disc gets cancelled and only exudates are separated in the output. and is shown in figure 3 to 5
The basic requirement of this method is that, we should have a normal and healthy retinal image as refer- ence and the test images must be taken in the same orien- tation as the reference, it should be of same lighting, an- gle, etc… It should be taken in the same manner as that of the reference, then only this algorithm will work well or else it would produce wrong result. Hence this basic need must be satisfied to work with this method.
Figure 5. OUTPUT IMAGE WITH EXUDATES DE- TECTED
Color information has shown to be effective for le- sions detection under certain conditions. On the basis of color information, the presence of lesions can be preliminarily detected by using MDD (Minimum Dis- tance Discriminant) classifier based on statistical pat- tern recognition techniques.
If the background color of a good quality re- tinal image is sufficiently uniform, then a simple and effective method to separate hard lesions from such background can be easily applied by selecting a proper threshold. However, the limitation of these thresholding techniques is that they typically only work well for the training images, but once an unseen image comes along, they may not be able to accurate- ly detect the exudates. This is because the processing steps require different threshold parameters for dif-
IJSER © 2010 http://www.ijser.org
International Journal of Scientific & Engineering Research, Volume 1, Issue 2, November-2010 3
ISSN 2229-5518
ferent types of retinal images and need user’s inter- vention on a case by case basis. As a result, these thresholding based algorithms are not scalable for analyzing large number of retinal images. This MDD (Minimum Distance Discriminant) classifier uses a simple but effective method, based on statistical clas- sification to identify lesions in retinal images[8].
Objects in an image usually can be described in terms of some features f1, f2… fk such as color, size, shape, texture and other more complex characteris- tics. These features, f1, f2….fk form a k-dimensional feature space, F. ideally, we have to find a space F such that different objects map to different, non- intersecting clusters in this feature space. If this con- dition is satisfied, we can easily identify different ob- jects and classify them into corresponding classes by certain rules. Suppose we have N different objects to be identified in an image. Let Ci(fi1,fi2,…..,fik) denote the center of class i in the k-dimensional feature space F, where i=1,2,….N. let X(x1,x2,….xk) be the unknown object’s feature measurement values in F. Let Di(X), i=1, 2…N, be the discriminant function that is used to determine whether X should be classified as belong- ing to class i. Given a specified pixel x with feature vector X, we classify pixel x as belonging to class i if Di(X) is the maximum along all Dj(X), where j=1,
2,….N and j not equal to i.
The color features are taken as the feature space, F. The color fundus retinal image consists of three planes-red, green and blue, each plane with 256 levels of intensity denoted as (R, G and B). Color can be also represented by 8, <, and L in the spherical co- ordinates. The relation between the two color spaces is expressed as:
L denotes the exposure or brightness of an image, whereas 8, < emphasize the differences or changes of col- ors. When L is held constant, 8 and < describe the chro- maticity is an illuminant surface. Since our focus is to dif- ferentiate between yellowish lesions and other darker objects in the color retinal images, we need to include both the brightness of the image as well as the changes of color information. Hence, we have selected L, 8, < as our feature space, F (fL, f8, f<). Then we need to derive an ap- propriate discriminant function. Our discriminant D(X) is derived from Bayes rule which is given as,
(MDD).
Applying Di(X) as defined above to the problem of detecting presence of exudates in retinal images, we de- fine only two classes-yellow patches (lesions) and dark reddish background. The feature centers of lesions and
background, Clesion(fL,f8,f<) and Cbkgnd(fL,f8,f<), can be ob- tained and trained by selecting small windows inside exudates patches and background regions respectively in a set of typical sample images.
The means of exudates and background are then computed and stored as feature centers for the two classes respectively. For each pixel X (xL, x8, x<) from the retinal image, the discriminant Dlesion and Dbkgnd(X) are calculated. If Dlesion(X) is less than Dbkgnd(X), then pixel X is classified as lesion otherwise it is being classified as back- ground. In this way, exudates or other yellowish lesions can be quickly detected. This simple and fast algorithm is able to achieve good accuracy in the detection of exudates in color fundus images. The results are shown in figures 6 to 11
Figure 6. TRAINING IMAGE FOR EXUDATES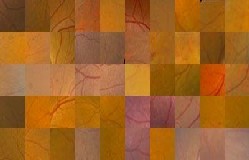
Figure7. TRAINING IMAGE FOR BACK GROUND
Figure 8. INPUT IMAGE WITH OPTIC DISC CIRCLED
IJSER © 2010 http://www.ijser.org
International Journal of Scientific & Engineering Research, Volume 1, Issue 2, November-2010 4
ISSN 2229-5518
we know the position of the optic disc for the image. Using this knowledge we select a group of pixels that surrounds the Optic Disc and the mean of these pix- els form the Cbgnd. Optic Disc usually has the same color and intensity as that of exudates. So the pixels that belong to the OD are used for calculation for Cyell.
Figure 9. OPTIC DISC EXTRACTED IMAGE
Figure 10. IMAGE CONVERTED TO SPHERICAL COORDINATES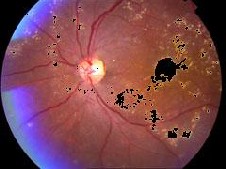
Figure 11. OUTPUT IMAGE WITH EXUDATES MARKED AS BLACK
This image works on the RGB co-ordinates rather than spherical co-ordinates. In the Minimum Dis- tance Discriminant (MDD) Classifier method, the cen- tre of class is found using a training set and hence remains fixed. But this may cause problem because of difference in image illumination and their average in- tensity. So a method is employed such that the centre of class (Cyell and Cbgnd) varies dynamically depend- ing on the image.
From previous Optic Disc detection method
i=1
i=1
Where m & n are number of pixels in yellowish and background region respectively, that are used to calculate these centers and Yi and Bi are the vectors of the 3 color features in the different region of Optic disc and back- ground.
The method attempts to detect exudates by using the two important features of exudates, its color and its sharp edges. It is carried out in the following steps.
• Detection of Optic Disc.
• Detection of yellowish objects in the image.
• Detection of objects in the image with sharp edges.
• Combination of the previous steps to detect yel- lowish objects with sharp edges.
Principal Component Analysis between clusters and propagation through radii are used to detect Optic Disk. The area enclosing the Optic Disk is traced out and re- moved from the retinal image.
Figure 12 INPUT IMAGE WITH OPTIC DISK CIRCLED
IJSER © 2010 http://www.ijser.org
International Journal of Scientific & Engineering Research, Volume 1, Issue 2, November-2010 5
ISSN 2229-5518
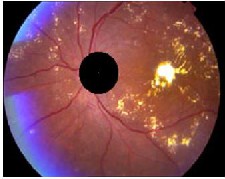
Figure 13 OPTIC DISC EXTRACTED IMAGE
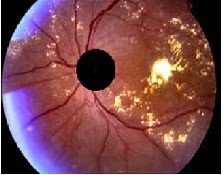
Figure 14 CONTRAST ENHANCED IMAGE
The detection of yellowish objects is carried out perform- ing color segmentation based on statistical classification method. It is based on the fact that if a group of features can be defined, so that the objects in an image map to non intersecting classes in feature space, then we can easily identify different objects classifying them into corres- ponding classes. We define two classes yellowish objects and background which are characterized using only three color features(R, G, and B).
Using Baye’s theory the Minimum Distance Discriminant
(MDD) is found as,
Where i=1 ….N, N is the number of classes, here N=2.
So for each pixel X (xR,xG,xB) the distances Dyell(X) and Dbgnd(X) are calculated. If Dyell(X) is less than Dbgnd(X), then the pixel X is classified as yellowish lesion, otherwise it is classified as background.
Next we performed an adjustment for non- uniformity of illumination, because of lighting variation, decreasing color saturation, skin pigmentation etc… the color of lesions in some regions of an image may appear dimmer than the background color that is located in another region and would be wrongly classified. We used a new color image; this image is obtained performing an operation of channels (N1, N2, N3) of the NTSC color space,
And then converting the image obtained (N1, N2, and N3) into the RGB color space again. We improve both contrasting attributes of lesions and overall color satura- tion in image making Optic disc and exudates to appear with same color independent of their location. Minimum Distance Discriminant (MDD) is applied to all pixels and the exudates are identified. While converting the ntsc im- age to rgb the color map is scaled to value ‘1’.Hence in mathematical computation the contrast improved image’s value has to be multiplied by 255 since both the centre of class were obtained from the original RGB image where maximum intensity value is represented by 255. Along with exudates, other lesions like drusens, artifacts, Optic disc are also identified and the exudates are shown in figure 15 as black color.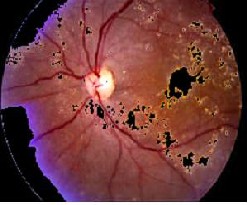
Figure 15. DETECTION OF YELLOW OBJECTS FROM THE IMAGE
There are various algorithms to find the edges of an im- age like sobel, canny etc…In our case we used sobel op- erator to find the sharp edges. We have a binary image with edges being shown white. This image contains the edges of optic disc, blood vessels, exudates and also the image boundary. So this cannot be independently used to determine the exudates.
Figure 16. DETECTION OF SHARP OBJECTS FROM THE IMAGE
IJSER © 2010 http://www.ijser.org
International Journal of Scientific & Engineering Research, Volume 1, Issue 2, November-2010 6
ISSN 2229-5518
To detect only exudates and to remove all the false detections in the previous stages, we combined the two images obtained using Minimum Distance Discriminant (MDD) and edge detecting method through a Boolean operation, feature based AND. In feature based AND, ON pixels in one binary image are used to select object in another image. We used the image with objects having sharp edges to select objects in the image with yellowish elements, because in the last one the lesions are detected completely, not only their contours. Thus we obtain le- sions characterized by two desired features-yellowish color and sharp edge. The boundary region encloses the exudates and is shown in figure17.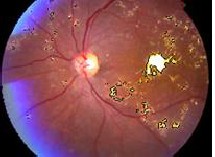
Figure 17. OUTPUT IMAGE GIVING BOUNDARY OF EXUDATES
The feature extraction again needs the proper thresholding values. The basic requirement in template matching is that we need both normal and abnormal images. The orientation, angle , lighting of both reference and the abnormal image should be same otherwise it would give wrong identification of the presence of exudates. Minimum distance discriminant (mdd) classifier is based on statistical recognition technique and this gives better result. But this works on spherical coordinates and the center is found using a training set and hence remain fixed. This may cause problem and employed such that the centre of class varies dynamically, depending on the image. Enhanced minimum distance discriminant (mdd) classifier uses rgb values of the image and the abnormality is characterized by the features yellowish color and sharp edges.
The authors wish to thank Raghuvarran, Sujitha for their support.The special thanks to THE EYE FOUNDATION for providing the real time retinal images.
[1] King H, Aubert RE, Herman WH. “Global burden of diabetes
Care 1998; Vol.21: Page 1414- 31.
[2] Sagar A.V., Balasubramaniam S., Chandrasekaran V., “A Novel Integrated Approach Using Dynamic Thresholding and Edge Detection (IDTED) for Automatic Detection of Exudates in Digi tal Fundus Retinal Images” Computing: Theory and Applica tions, ICCTA’07. International Conference on Issue Date: 5-7
March 2007 PP: 705-710 ISBN: 0-7695- INSPEC Accession Num
ber: 9420643 Digital Object Identifier: 10.1109/ICCTA.2007.16
[3] Fong DS, Aiello L, Gardner TW, King GL, Blankenship G, Caval lerano JD, Ferris FL, II, Klein R: Diabetic retinopathy.
Diabetes Care 26:226-229, 2003
[4] Huiqili, and Opas Chutatape, (2004) “Automated Feature Ex traction in Color Retinal Images by a Model based Approach”, IEEE transactions on biomedical engineering, vol.51, no.2, Feb ruary 2004 Digital Object Identifier : 10.1109/tbme.2003.820400
[5] Nguyenl, H.T., M. Butler, A. Roychoudhryl, A.G. Shannonl, J. Flack and P. Mitchell, 1996. “Classification of diabetic retinopathy using neural networks”. Proceedings of the 18th Annual International Conference of the IEEE Engineering
in Medicine and Biology Society, Oct. 31-Nov. 3, Amsterdam, pp: 1548-1549
[6] Kahai, P., K.R. Namuduri and H. Thompson, 2006. A decision support framework for automated screening of diabetic retinopathy. Int. J. Biomed. Imaging., 2006: 1-8.
[7] Milan Sonka,Hlavac and Roger Boyle(2008),Digital Image Processing and Computer Vision, Cengage Learning India Private Limited.
[8] Wang, H, Wynne Hsu, kheng Guan Goh, Mong Li Lee, (2000). “An Effective Approach to Detect Lesions in Color Retinal Images”. IEEE Conf. on Computer Vision and Pattern Recognition (2000) 181-187, Vol: 2, PP.181-186, ISBN:0-
7695-0662-3, INSPEC Accession Number:6651776
DOI:10.1109/CVPR.2000.854775
IJSER © 2010 http://www.ijser.org