International Journal of Scientific & Engineering Research, Volume 6, Issue 2, February-2015 550
ISSN 2229-5518
Experimental Optimization of Naphthalene
Bioadsorption from Aqueous Solution onto Water
Melon Peels Using Response Surface
Methodology
S. E. AGARRY AND O. O. OGUNLEYE*
—————————— ——————————
Naphthalene is a hydrocarbon comprising two fused aromatic rings, with a melting point of 80.2◦C and solubility in water at 25oC of 0.24mM [1, 2]. It is a raw chemical for a number of industrial syntheses, in particular the production of phthalic anhydride [3]. Naphthalene is a primary irritant and the US environmental protec- tion agency (EPA) has classified it as a priority toxic pollutant [4].
Despite its low solubility in water it is frequently encountered in effluent in complex mixtures such as petroleum fractions, creosote or pharmaceutical waste [5]. In addition, naphthalene may originate from biological sources such as endophytic fungi [6,7], magnolia flowers [8], deer hair [9] and termite nests [10], or from plants and natural soil associated with termite nests [11]. Systematic exposure to naphthalene and its derivatives has been shown to give rise a vari- ety of diseases and disturbances to the human metabolism [12, 13].
The ever increasing demand for water has caused considerable attention to be focused towards recovery and re-use of waste waters [14]. The removal of these kinds of pollutants from the environment cannot be accomplished by traditional methods [15]. It is now uni- versally recognized that adsorption technology provides a feasible and effective method for the removal of pollutants from contaminat- ed water resources and waste waters [16]. Activated carbons are the most commonly used adsorbent in the adsorption process due to their high adsorption capacity, high surface area and high degree of sur- face reactivity; however, regeneration is difficult and expensive [17]. In recent years, extensive research is now focused on new, efficient, low-cost and easily obtainable agricultural by-products such as or- ange peels, banana peels and banana stalks, plantain peels, spent tea
leaves, soya bean hull, grape fruit biomass [18, 19, 20, 21,22, 23,24]
as adsorbents.
Bioadsorption capacity is highly influenced by some process conditions, such as temperature, pH solution, pollutant/contaminant concentration, stirring speed, contact time and particle size, among others. In addition, the physical-chemical properties of bioadsorbent and pollutants play significant role in bioadsorption processes. Sev- eral researchers have reported the individual effects of these process conditions. However, only a few researchers have reported the influ- ence of the interactions between the process conditions using re- sponse surface methodology [25, 26, 27]. Response Surface Meth- odology (RSM) is a collection of mathematical and statistical ap- proach for experimental design useful for analyzing and evaluating the effects of several independent variables and also interactive ef- fects among the variables on the response. It also has an important application for searching optimum conditions of variable to predict targeted responses [28, 29]. Nevertheless, no study has been found in the literature for optimization of bioadsorption of organic pollu- tant/chemicals by agricultural solid waste neither modified nor un- modified. These interactions are required to generate a statistical model that represents adequately the response surfaces of bioadsorp- tion processes.
Citrullus lanatus is a vine-like plant of Cucurbitaceae fami- ly. This flowering plant produces a special type of fruit known as water melon, a berry which has a thick rind (exocarp) and fleshy center (mesocarp and endocarp). The main purposes of this study are to investigate the potential of water melon peels as low-cost bioad-
IJSER © 2015 http://www.ijser.org
International Journal of Scientific & Engineering Research, Volume 6, Issue 2, February-2015 551
ISSN 2229-5518
sorbent in naphthalene removal from waste or contaminated water as well as to investigate the single and interactive effects of initial naph-
thalene concentration, pH, temperature and contact time on naphtha-
lene bioadsorption using RSM. Empirical model correlating response to the four independent variables was then developed and optimiza- tion of process conditions for naphthalene bioadsorption was deter- mined using central composite face-centered design (CCFD).
Naphthalene (99% pure, chemical grade) being products of
Sigma-Aldrich, USA, was purchased from a chemical store, Lagos,
Nigeria. Due to the low water solubility of naphthalene (polyaro- matic hydrocarbons) the water– methanol solution was used as the aqueous solution. A stock solution was prepared by dissolving 1 g of naphthalene in de-ionized water-methanol solution. The water- methanol solution was composed of 50 ml of methanol and 950 ml of de-ionized water. From this original stock solution, test solutions with various concentrations (100, 200, 300 mg/l) were prepared with de-ionized water.
Water Melon Peels (WMP), a waste product of water melon
fruit pulp to be used as adsorbent were obtained from a local market in Ogbomoso, Nigeria. The water melon peels were washed with tap water, cut into small pieces and then sundried. The dried small-size WMP was washed repeatedly with hot water (70oC) to remove any soluble matter present and further oven-dried at 85oC for 48 h. The oven-dried small-size WMP was further reduced to small-sized parti- cles by grinding using a serrated disk grinder. The powdered WMP particles were sieved using a 100-mesh sieve. The sieved WMP powdered particles were stored in an air-tight bottle prior to sorption
experiment.
To optimize the range of batch adsorption experimentation for 23 full-factorial Box-Behnken design, the bioadsorption tests were carried out in a glass-stoppered, Erlenmeyer flask with 100 ml
of working volume and an initial concentration of 100 mg/l of naph- thalene. A weighed amount (10 g) of bioadsorbent was added to the solution. The flasks were agitated for 180 min on a temperature- controlled water bath shaker at ambient temperature (25 ± 2oC)). The influence of initial naphthalene concentration (100, 200, 300, 400,
500 mg/l), pH (5, 6, 7, 8, 9), temperature (30, 35, 40, 45, 50 oC) and
contact time (30, 60, 90, 120, 150, 180 min) were evaluated during the present study. Samples were collected from the flasks at prede- termined time intervals for analyzing the residual naphthalene con- centration in the solution. Prior to analysis, samples were centrifuged to separate bioadsorbent from the sorbate and minimize interfer- ences. At time t = 0 and equilibrium, the naphthalene concentrations were determined using UV-spectrophotometer at an absorbance wavelength of 275 nm. The percentage of naphthalene removal was calculated using Eq. (1) [30]:
had four independent variables viz., initial naphthalene concentra- tion, pH, temperature and contact time. Each of the independent var-
iables was studied at three levels (1, 0, +1), with 30 experimental
runs. The levels were selected based on above preliminary study results. The variables optimized were initial naphthalene concentra- tion in the range of 100-300 mg/l, pH, 5 – 9, temperature, 30-50oC and time, 30-180 min, respectively. Change in naphthalene (i.e. per- cent naphthalene reduction) was considered as experimental re- sponse. Table 1 shows the coded and actual values of factors and levels used in the experimental design. The statistical software De- sign Expert6.0.8, (Stat-Ease Inc., Minneapolis, USA) was used to evaluate the analysis of variance (P < 0.05) to determine the signifi- cance of each term in the fitted equations and to estimate the good- ness of fit in each case.
![]()
![]()
Dependent variable | - 1 | 0 | + 1 |
Initial Concentration (X1), mg/l pH (X2 ) Temperature ( X3), oC Contact time (X4) (min) | 100 5 30 30 | 200 7 40 105 | 300 9 50 180 |
![]()
FT-IR spectrum of WMP were obtained in order to identify the func- tional groups like -OH, -CO, -CHO, N-H, - CONH, -C=C- and -
COOH present in these peels that can be involved in bonding with
2,6-DCP during bioadsorption.. Table 3 shows the FT-IR spectrum
elucidation of dried WMP structure.
C − C
The absorption peaks (bands) at 3760 cm-1 was assigned to OH
Removal (%) = o t ×100
Co
(1)
stretch (alcohol and carboxylic acid), OH non-bonding, N-H stretch
(amines) and C-H stretch (alkanes). The bands appearing at 3415 cm-
1 was assigned to bonded OH group, those at 2923.68 cm-1 to C-H,
Where
Co (mg/l) is the initial naphthalene concentration in waste
CH2, CH3
(alkanes) and COOH (carboxylic acid) and the bands ap-
water.
Ct is the concentration of naphthalene in waste water at
pearing at 1615.55 cm-1
to C-H (alkane), C=C (aromatic) and C=O
-1
time, t .
stretch. The absorption peaks (bands) at 1409.23 cm
were attributed
to C-H bend, C-O (alcohol), C-N, and OH (carboxylic acid) and that
at 1247.66 cm-1
to C-O (alcohol), SO3
2- stretching, and C-H bend.
-1
The Box-Behnken factorial experimental design employed
The absorption peaks (bands) at 1034.33 cm
were attributed to C-O
(alcohol), C-H, C=N bend (nitriles), and PO43- stretching while the
IJSER © 2015 http://www.ijser.org
International Journal of Scientific & Engineering Research, Volume 6, Issue 2, February-2015 552
ISSN 2229-5518
weak band in the region of 540.31 cm- 1was assigned to N-containing
IJSER © 2015 http://www.ijser.org
International Journal of Scientific & Engineering Research, Volume 6, Issue 2, February-2015 553
ISSN 2229-5518
![]()
![]()
Run Concentration(mg/l) Actual Coded![]()
pH
Actual Coded![]()
![]()
Temperature (oC) Actual Coded![]()
Contact Time (min) Actual Coded
1 100 (-1)
2 300 (+1)
3 100 (-1)
4 300 (+1)
5 100 (-1)
6 300 (+1)
7 100 (-1)
8 300 (+1)
9 100 (-1)
10 300 (+1)
11 100 (-1)
12 300 (+1)
13 100 (-1)
14 300 (+1)
15 100 (-1)
16 300 (+1)
17 100 (-1)
18 300 (+1)
19 200 (0)
20 200 (0)
21 200 (0)
22 200 (0)
23 200 (0)
24 200 (0)
25 200 (0)
26 200 (0)
27 200 (0)
28 200 (0)
29 200 (0)
30 200 (0)
5 (-1)
5 (-1)
9 (+1)
9 (+1)
5 (-1)
5 (-1)
9 +1)
9 (+1)
5 (-1)
5 (-1)
9 (+1)
9 +1)
5 (-1)
5 (-1)
9 (+1)
9 (+1)
7 (0)
7 (0)
5 (-1)
9 (+1)
7 (0)
7 (0)
7 (0)
7 (0)
7 (0)
7 (0)
7 (0)
7 (0)
7 (0)
7 (0)
30 (-1)
30 (-1)
30 (-1)
30 (-1)
50 (+1)
50 (+1)
50 (+1)
50 (+1)
30 (-1)
30 (-1)
30 (-1)
30 (-1)
50 (+1)
50 (+1)
50 (+1)
50 (+1)
40 (0)
40 (0)
40 (0)
40 (0)
40 (0)
40 (0)
40 (0)
40 (0)
40 (0)
40 (0)
40 (0)
40 (0)
40 (0)
40 (0)
30 (-1)
30 (-1)
30 (-1)
30 (-1)
30 (-1)
30 (-1)
30 (-1)
30 (-1)
180 (+1)
180 (+1)
180 (+1)
180 (+1)
180 (+1)
180 (+1)
180 (+1)
180 (+1)
105 (0)
105 (0)
105 (0)
105 (0)
105 (0)
105 (0)
105 (0)
105 (0)
105 (0)
105 (0)
105 (0)
105 (0)
105 (0)
105 (0)
bioligands, C-H bend and C=C which are out of plane. The FT-IR spectra showed that carboxyl, carbonyl and hydroxyl groups were very prominent functional groups on the surface of the water melon peels which could play major role in naphthalene bioadsorption.
Results of the naphthalene bioadsorption onto water melon
with respect to percentage removal are presented in Table 4.
At each pair of experimental runs, run number 1 and 2; 3
and 4; 5 and 6; 7 and 8; 11 and 12; 13 and 14; 15 and 16; 17 and 18 had the same process conditions with different initial naphthalene concentration; results shows that percentage (%) naphthalene remov- al decreased with increased initial naphthalene concentration. This observation is due to the fact that all bioadsorbent have a limited number of active sites and at a certain concentration the active sites become saturated [31]. Effect of different solution pH were investi- gated at the same process condition of initial concentration, tempera- ture and contact time for each pair of experimental runs (run num- bers 1 and 3; 2 and 4; 5 and 7; 6 and 8; 13 and 15; 14 and 16; 19 and
25) and the findings demonstrated that increase in solution pH from
5 to 7 resulted in increased bioadsorption (i.e. percentage (%) naph- thalene removal) and above the pH of 7, the naphthalene bioadsorp- tion decreased. This observation is consistent with previous studies on the bioadsorption of naphthalene onto spent tea leaves [22], acti- vated carbon derived from bean pods [15] and on chemically oxi- dized mesoporous carbon [32]. Solution pH affects the surface charge of the biosorbent and the metal speciation. Functional groups![]()
of biosorbents can be protonated or deprotonated depending on their dissociation constant that is function of the solution pH. For exam- ple, carboxylic groups are ionized when solution pH is acidic [33,
34]. At this condition, positively charged pollutant/contaminant spe-
cies can be adsorbed on negatively charged surface functional groups by means of electrostatic forces.
Relatively, run numbers 1 and 5; 2 and 6; 9 and 13; 10 and 14 had the same process operating condition with different temperature; finding shows that increase in temperature led to increased bioadsorp- tion. This was mainly due to increased surface activity, suggesting that bioadsorption of naphthalene onto WMP was endothermic. A rise in temperature usually accelerates and increases mass transfer. Similar observations have been reported for the bioadsorption of naphthalene onto spent tea leaves [22] and organo-sepiolite [15].
Furthermore, runs number 1 and 9; 2 and 10; 3 and 11; 4 and
12; 5 and 13; 6 and 14; 7 and 15; 8 and 16 had the same process condi-
tions for bioadsorption but carried out at different contact time; the results revealed that the amount of naphthalene removed from aqueous solution increased with increase in contact time.
IJSER © 2015 http://www.ijser.org
International Journal of Scientific & Engineering Research, Volume 6, Issue 2, February-2015 554
ISSN 2229-5518
![]()
of the different bioadsorption process variables: initial naphthalene concentration, pH, temperature and contact time. All terms regard- less of their significance are included in the following equations:![]()
Y%N = 95.36 - 1.08A – 1.97B + 1.10C + 20.97D – 0.31A2 – 2.31B2
– 1.46C2 – 23.31D2 + 0.094AB + 0.16AC + 0.53AD + 0.41BC +
0.66BD + 0.34CD
(3)
Where A is initial naphthalene concentration, B is pH; C is temperature
and D is contact time.![]()
The experimental data were fitted to a second order poly- nomial regression model (Eq. (2)) containing 4 linear, 4 quadratic
and 5 interaction terms [35] using the same experimental design software to derive the equation for percentage (%) naphthalene re- moval.
β + β A + β B + β C + β D + β A2 +
o 1 2 3 4 11
To test the fit of the model, the regression equation and determination coefficient ( R 2 ) were evaluated (Table 5). The model F-value of
3310.73 implies the model is significant for percentage (%) naphtha-
lene removal. There is only a 0.01 per cent chance that a model F-
value, this large could occur due to noise alone. The low probability value (< 0.0001) for naphthalene bioadsorption (i.e. % naphthalene removal) indicates that the model is significant. The value of the deter- mination coefficient ( R 2 = 0.9997) being a measure of goodness of fit to the model indicates a high degree of correlation between the ob- served value and predicted values. The determination coefficient ( R 2 = 0.9997), suggests that more than 99.97 per cent of the variance is attributable to the variables and indicated a high significance of the model. Thus, 0.03 per cent of the total variance cannot be explained by the model. The fitted model is considered adequate if the F-test is sig- nificant (P < 0.05). The analysis of variances (ANOVA) quadratic re- gression model demonstrated that the model was highly significant as evident from the very low probability (P < 0.0001) of the F -test and insignificant result from the Lack of Fit model (Table 4). The Lack of Fit test is performed by comparing the variability of the current model residuals to the variability between observations at replicate settings of the factors. The Lack of Fit is designed to determine whether the select- ed model is adequate to describe the observed data, or whether a more complicated model should be used. The Predicted R-Squared value of
0.9983 is correspondently in reasonable agreement with the Adjusted
R-Squared value of 0.9994. Adequate Precision measures the signal to noise ratio. A ratio > 4 is desirable. The ratio of 145.538 in this research indicates an adequate signal. This model can be used to navigate the design space. The coefficient of variation (CV) as the ratio of the stand- ard error of estimate to the mean value of the observed response is a measure of reproducibility of the model, generally a model can be con- sidered reasonably reproducible if its CV is not greater than 10 per cent. Hence, the low variation coefficient value (CV = 0.67 per cent) ob- tained indicates a high precision and reliability of the experiments.
Y = β 22 B
+ β 33C
+ β 44 D
+ β12 AB + β13 AC (2) TTable 5: Analysis of variance (ANOVA) for the quadratic re-
+ β14 AD + β 23 BC + β 24 BD + β 34 CD
onto water melon peels
Where
β o is the value of the fixed response at the centre point of
-value
-value
the design;
β1 , β 2 , β 3 , β 4
are linear coeffi-
cients; β11 , β 22 , β 33 , β 44
β12 , β13 , β14 , β 23 , β 24 , β 34
are quadratic coefficients;
are the interaction effect coeffi-
cients regression terms, respectively; A, B, C and D are the levels of independent bioadsorption process variables.
The significance of each coefficient in the equation was de-
termined by Student t-test and P-values. F-test indicated that all the factors and interactions considered in the experimental design are statistically significant (P < 0.05) at the 95 per cent confidence level. The regression equation obtained after analysis of variance gives the![]()
The coefficient of the model (parameter estimation) and the
corresponding P-values are presented in Table 6. The significance of regression coefficients was considered, ignoring those with an insig- nificant effect on the response at a significance level of 95 per cent.
IJSER © 2015 http://www.ijser.org
International Journal of Scientific & Engineering Research, Volume 6, Issue 2, February-2015 555
ISSN 2229-5518
The P-values of the regression coefficients suggest that among the independent test variables, linear, quadratic and interaction effects of
solute concentration, temperature and process time are highly signif-
icant. The insignificant effects (factors and interactions) with P- values higher than 0.05 were ignored. In this study, A, B, C, D, B2, C2, D2, AD, BC, BD and CD are significant model terms for naph- thalene bioadsorption. Thus, statistical analysis of all the experi- mental data showed that initial concentration, pH, temperature and contact time had a significant effect on percentage (%) naphthalene removal in this study. Moreover, it is observed that contact time ex- erted more pronounced linear effect (higher positive coefficient val- ue) on percentage (%) naphthalene removal and relatively followed by temperature. That is, percentage (%) naphthalene removal was
mostly and positively influenced by contact time. The initial naph- thalene concentration and pH negatively (due to negative coefficient
naphthalene removal of 95.45 percent was obtained with 200 mg/l of initial naphthalene concentration and contact time of 105 min.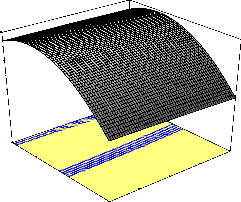
100.615
87.7493
74.8835
62.0176
49.1518
180.00
value) influenced rate of naphthalene bioadsorption. The quadratic effect of the independent variables on the rate of naphthalene bioad-
142.50
105.00
200.00
250.00
300.00
sorption was negative.
D: Contac t T i me
67.50
30.00
100.00
150.00
A : Ini ti al naphthal ene c onc entrati on
![]()
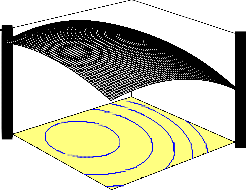
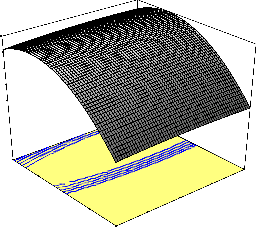
Fig. 2 shows the 3D response surface plot of the interaction effect between pH and temperature. This three dimensional plot ex- plains that both pH and temperature has significant individual impact on percentage naphthalene removal as the individual coefficient of pH is negative and that of temperature is positive while their interac- tion effect is positive. However, the impact of temperature is more than that of pH as the individual coefficient value is higher for tem- perature () than for pH (1.17). The percentage naphthalene removal increased with increase in temperature as pH increased from 5 to 7. Maximum percentage naphthalene removal of 95.45 percent was
obtained at 40oC and a neutral pH of 7 when bioadsorption process
was carried out at a contact time of 105 min using an initial naphtha- lene concentration of 200 mg/l. Further increase in both the pH (>
7)) and temperature (> 40oC) results in a significant decrease in per- centage naphthalene removal.![]()
* Significant at p < 0.05
Table 6 showed that percentage naphthalene removal was
influenced positively by interaction of initial naphthalene concentra- tion (A) and contact time (D), pH (B) and contact time (D), pH (B) and temperature (C); and, temperature (C) and contact time (D), re- spectively. However, there was no significant interaction between initial naphthalene concentration (A) and pH as well as between ini- tial naphthalene concentration (A) and temperature (C). The linear effect of contact time and temperature exerted more pronounced positive influence (due to higher coefficient) on naphthalene bioad-
95.9336
93.9777
92.0219
90.066
88.1101
50.00
45.00
40.00
7.00
8.00
9.00
sorption than their interaction effects. The graphical representation of the response shown in Figs. 1 – 4 helped to visualize the effect of
C: T emperature
35.00
30.00
5.00
6.00
B : pH
initial concentration (A), pH (B), temperature (C) and contact time (D) on percentage (%) naphthalene removal. The effect of interaction of initial concentration (A) and contact time (D) on percentage naph- thalene removal is illustrated in Fig. 1. The plot shows that higher percentage naphthalene removal was attained with low initial naph- thalene concentration as the contact time increased. When the bioad-
sorption was carried out at 40oC and pH 7, the highest percentage
The interaction effect of changing pH and contact time on
percentage naphthalene removal is shown in Fig. 3. This plot demon- strates that both pH and contact time have positive mutual impact on percentage naphthalene removal during the bioadsorption process. At
IJSER © 2015 http://www.ijser.org
International Journal of Scientific & Engineering Research, Volume 6, Issue 2, February-2015 556
ISSN 2229-5518
a fixed initial naphthalene concentration and temperature, it is ob- served that percentage naphthalene removal increased with increase
in pH from 5 to 7 and thereafter decreased as pH increased from 7 to
9. Maximum percentage naphthalene removal of 95.46 percent was obtained at a pH of 7 and contact time of 105 min when bioadsorp- tion process was carried out at a temperature of 40oC using 200 mg/l initial naphthalene concentration.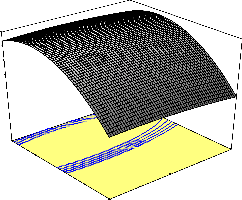
100.383
86.8218
73.2605
59.6992
46.1379
180.00
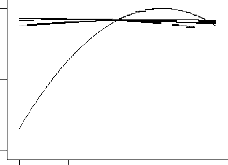
The factor effect function plot (Fig 5) was used to assess the effect of each factor graphically. From the trace plot as shown in
Fig 5, it can be seen that each of the four variables used in the pre- sent study has its individual effect on percentage naphthalene re- moval in the bioadsorption of naphthalene onto WMP. Gradual in- crease in contact time from low level (coded value –1) to a higher level (coded value +1) resulted in higher percentage naphthalene removal. Also, gradual increase in initial concentration, pH and tem- perature from low level (coded value –1) to a medium level (coded value 0) elicited marginal increase in percentage naphthalene remov- al and above the medium level, the percentage naphthalene removal decreased. Moreover, it is also to be noted from Fig 5 that over the range of 30 to 180 min of contact time, percentage naphthalene re- moval changed in a wide range. However, this was not the case for initial concentration, pH and temperature, respectively. This clearly indicates that keeping initial concentration, pH and temperature at
142.50
105.00
7.00
8.00
9.00
the optimum level, a change in contact time will affect the percent-
age naphthalene removal process more severely than done otherwise.
D: Contac t T i me
67.50
30.00
5.00
6.00
B : pH
A D C
C A
B
85. 5594
Fig. 4 shows the 3D response surface plot of the effect of interaction between temperature and contact time. This plot demon- strates that both temperature and contact time has significant indi- vidual impact on percentage naphthalene removal as the individual coefficient of temperature and contact time is positive and their in- teraction effect is positive. The percentage naphthalene removal in- creased with contact time as temperature also increased. At a fixed initial naphthalene concentration (200 mg/l) and pH 7, it is observed
71. 0396
42
D
-1. 000 -0. 500 0. 000 0. 500 1. 000
F ac t or R ange (C oded Value)
that maximum percentage naphthalene removal (95.46 percent) was attained at a temperature of 40oC and higher contact time of 105 min.
100.346
87.4748
74.6032
61.7317
48.8601
180.00
142.50
105.00
40.00
45.00
50.00
The optimum coded and uncoded value was obtained by solving equa-
tion 3 using numerical method. Numerical optimization based on desir- ability function was carried out. In order to provide an ideal case for naphthalene bioadsorption, the goal for initial concentration, pH, tem- perature and contact time was set in range based upon the requirements of the naphthalene bioadsorption and percentage naphthalene removal was set on maximize. The optimum coded and uncoded values of initial naphthalene concentration, pH, temperature and contact time were
found to be 270.20 mg/l, 5.85, 47.45oC and 128.70 min, respectively, to
attain a maximum percentage naphthalene removal of 99.07%. Desira- bility was 1.000 for the experiment (Fig. 6). Nevertheless, series of validation experiments were conducted to determine the optimum per- centage naphthalene removal when the bioadsorption process variables were set at the favourable predicted optimum levels established above, through CCRD and RSM. At these optimum conditions, the percentage
D: Contac t T i me
67.50
30.00
30.00
35.00
C: T emperature
naphthalene removal was observed to be 98.45%. The results clearly indicated that no significant difference was observed.
IJSER © 2015 http://www.ijser.org
International Journal of Scientific & Engineering Research, Volume 6, Issue 2, February-2015 557
ISSN 2229-5518
![]()
100.00 300.00
Initial naphthalene c onc entration = 270.20
![]()
30.00 50.00
T emperature = 47.45
![]()
42 97
% Naphthalene Removal = 99.0749
![]()
5.00 9.00 pH = 5.85
![]()
30.00 180.00
Contact T ime = 128.70
Desirability = 1.000
ic isolates of Muscodor albus, a volatile-antibiotic producing fungus. Microbiology 150: 4023–4031.
8 Azuma, H., Toyota, M., Asakawa, Y., and Kawano, S. (1996).
Naphthalene: A constituent of Magnolia flowers. Phytochemis- try 42: 999–1004.
9 Gassett, J.W., Wiesler, D.P., Baker, A.G., Osborn, D.A., Miller, K.V., Marchinton, R.L., and Novotny, M. (1997). Volatile com- pounds from the forehead region of male white-tailed deer (Odocoileus virginianus). J. Chem. Ecol. 23: 569–578.
10 Chen, J., Henderson, G., Grimm, C.C., Lloyd, S.W., and Laine, R.A. (1998). Naphthalene in Formosan subterranean termite carton nests. J. Agric. Food Chem. 46: 2337–2339.
11 Krauss, M., Wilcke, W., Martius, C., Bandeira, A.G., Garcia,
M.V.B., and Amelung, W. (2005). Atmospheric versus biologi- cal sources of polycyclic aromatic hydrocarbons (PAHs) in a tropical rain forest environment. Environ. Pollut. 135: 143–
154.
12 Amoore, J.E., and Hautala, E. (1983). Odor as an aid to chemi- cal safety: Odor thresholds compared with threshold limit val- ues and volatilities for 214 industrial chemicals in air and water
This study demonstrated that the variables of initial naph-
thalene concentration, pH, temperature and contact time had a strong influence on the naphthalene bioadsorption using water melon peels as bioadsorbent. The percentage naphthalene removal during adsorp- tion treatment was influenced positively by contact time and temper- ature, and negatively by initial naphthalene concentration and pH. The percentage naphthalene removal was influenced positively by interaction of initial naphthalene concentration and contact time, interaction of pH and temperature, interaction of pH and contact time and interaction of temperature and contact time, respectively. The obtained second-order polynomial quadratic regression model for the responses of percentage naphthalene removal was significant. Final- ly, the mathematical model obtained can also be employed to estab- lish better process conditions.
1 Dean, J.A. (1982). Lange’s Handbook of Chemistry, McGraw– Hill, New York, USA, 1982.
2 Eastcott, L., Shiu, W.Y., and Mackay, D. (1988). Environmen- tally relevant physical–chemical properties of hydrocarbons: A review of data and development of simple correlations. Oil Chem. Pollut. 4: 191–216.
3 Franck, H-G. and Stadelhofer, J.W. (1987). Industrielle
Aromatenchemie, Springer–Verlag, Berlin, Germany.
4 Preuss, R., Angerer, R., and Drexler, H. (2003). Naphthalene:
An environmental and occupational toxicant. Int. Arch. Occ. Env. Hea. 76: 556–576.
5 Mueller, J.G., Chapman, P.J., and Pritchard, P.H. (1989). Creo- sote contaminated sites. Environ. Sci. Technol. 23: 1197–1202.
6 Daisy, B.H., Strobel, G.A., Castillo, U., Ezra, D. Sears, J., Weaver, D.K., and Runyon, J.B. (2002). Naphthalene, an insect repellent, is produced by Muscodor vitigenus, a novel endophy- tic fungus. Microbiology 148: 3737–3741.
7 Ezra, D., Hess, W.M., and Strobel, G.A. (2004). New endophyt-
dilution. J. Appl. Toxicol. 3: 272–290.
13 Agency for Toxic Substances and Disease Registry (ATSDR) (1990). Toxicological Profile for Naphthalene and
2Methylnaphthalene, US Public Health Service, US Depart- ment of Health and Human Service, Atlanta, GA, USA.
14 Annadurai, A., Babu, S.R., Mahesh, K.P.O., and Murugesan, T. (2000). Adsorption and biodegradation of phenol by chitosan immobilized Pseudomonas putida (NICM 2174), Bioprocess Biosyst. Eng. 2: 493–501.
15 Gok, A., Ozcan, S., and Ozcan, A. (2008). Adsorption kinetics of naphthalene on to organo-sepiolite from aqueous solutions. Desalination 220: 96–107.
16 Tsai, W.T., Lai, C.W., and Su, T.Y. (2006). Adsorption of bi- sphenol A from aqueous solution onto minerals and carbon ad- sorptions. J. Hazard. Mater. 134: 169–175.
17 Ozcan, A. and Ozcan, A.S. (2005). Adsorption of Acid Red 57
from aqueous solutions onto surfactant modified sepiolite. J. Hazard. Mater. 125: 252–259.
18 Marshall, W.E., Wartelle, L.H., Boler, D.M., and Toles, C.A. (2000). Metal ion adsorption by soybean hulls modified with citric acid: A comparative study. Environ. Technol. 21 (6):.601–607.
19 Annadurai, G., Juang, R.S., and Lee, D.J. (2002). Adsorption of heavy metal from water using banana and orange peels. Water Sci. Technol. 47: 185–190.
20 Li, X., Tang, Y., Cao, X., Lu, D., Luo, F., and Shao, W. (2008).
Preparation and evaluation of orange peel cellulose adsorbents for effective removal of cadmium, zinc, cobalt and nickel, Col- loids Surf. A 317: 512–521.
21 Bayo, J., Esteban, G., and Castillo, J. (2012). The use of native
and protonated grapefruit biomass (Citrus paradisi L.) for cad- mium (II) biosorption: Equilibrium and kinetic modelling. En- viron. Technol. 33: 761–772.
22 Agarry, S. E., Ogunleye, O. O. and Aworanti, O. A. (2013a).
Biosorption equilibrium, kinetic and thermodynamic modelling of naphthalene removal from aqueous solution onto modified spent tea leaves. Environ. Technol. 34 (7): 825-839.
23 Agarry, S. E., Owabor, C. N. and Ajani, A. O. (2013b). Modi-
fied plantain peel as cellulose-based low-cost adsorbent for the removal of 2, 6–dichlorophenol from aqueous solution: adsorp- tion isotherms, kinetic modelling and thermodynamic studies. Chem. Eng. Communicat. 200 (8): 1121-1147.
IJSER © 2015 http://www.ijser.org
International Journal of Scientific & Engineering Research, Volume 6, Issue 2, February-2015 558
ISSN 2229-5518
24 Ogunleye, O.O., Ajala, M.A. and Agarry, S.E. (2014) Evalua-
tion of Biosorptive Capacity of Banana (Musa paradisiaca) Stalk for Lead(II) Removal from Aqueous Solution. Journal of Environmental Protection, 5, 1451-1465.
25 Sarkar, M. and Majumder, P. (2011). Application of response
surface methodology for optimization of heavy metal biosorp- tion using surfactant modified chitosan bead Chemical Eng. J.
175 (15): 376-387.
26 Kumar, K. K., Prasad, M. K., Lakshmi, G. R., and Murthy, Ch
V. R. (2013). Studies on biosorption of cadmium on grape pomace using response surface methodology. Desalination and Water Treatment 51: 5592-5598.
27 Mahmood, N., Ladan, R. and Fereshteh, Z. (2014) Biosorption
of copper (II) on Sargassum angostifolium C.Agardh phae- ophyceae biomass, Chemical Speciation & Bioavailability,
26:3, 176-183
28 Kiran, B., Kaushik, A. and Kaushik, C. P. (2007). Response
surface methodological approach for optimizing removal of Cr (VI) from aqueous solution using immobilized cyanobacte- rium. Chem. Eng. J. 126: 147–153.
29 Fereidouni, M., Daneshi, A., and Younesi, H. (2009). Biosorp-
tion equilibria of binary Cd(II) and Ni(II) systems onto Saccha- romyces cerevisiae and Ralstonia eutropha cells: Application of response surface methodology. J. Hazard. Mater. (168):
1437–1448.
30 Hamad, B. K., Noor, A-Md., and Rahim, A. A. (2011). Remov- al of 4-chloro-2-methoxy phenol from aqueous solution by ad- sorption o oil palm shell activated carbon activated with K2CO3, J. Phys. Sci. 22: 39–55.
31 Tsai, W.T. and Chen, H.R. (2010). Removal of Malachite
Green from aqueous solution using low-cost chlorella-based biomass,J. Hazard. Mater.175: 844–849.
32 Anbia, M. and Moradi, S.E. (2009). Adsorption of naphthalene derived compounds from water by chemically oxidized na- noporous carbon. Chem. Eng. J. 148: 452–458.
33 Qiming, Y. and Kaewsarn P. (1999). A model for pH dependent
equilibrium of heavy metal biosorption. Korean J. Chem. Eng.,
16 (6): 753-757
34 Volesky, B., (2003). Sorption and Biosorption. Quebec, Cana- da, BV Sorbex Inc
35 Montgomery, D. C. (1991). Design and analysis of experiments
3rd ed., Wiley publishers, New York.
IJSER © 2015 http://www.ijser.org