International Journal of Scientific & Engineering Research, Volume 5, Issue 4, April-2014 15
ISSN 2229-5518
Experimental Investigation of GMAW for AISI
1045 Material using Taguchi Method
RAKESH B PRAJAPATI1, DISHA B PATEL2, TUSHAR M PATEL3
Abstract - In this study, the effects of various welding parameters on welding strength in AISI 1045 medium carbon steel having dimensions 200 mm x 75 mm x 6mm, welded by gas metal arc welding were investigated. The welding current, arc voltage and welding speed and gas flow rate were chosen as variable parameters. Ultimate tensile strength was measured for each specimen after the welding operations and the effects of these parameters on strength were researched. A plan of experiments based on Taguchi technique has been used to acquire the data. The experiments were conducted based on a four-factor, Five-level. An Orthogonal array, signal to noise (S/N) ratio are employed to investigate the welding strength of AISI 1045 material. Finally the conformations tests have been carried out to compare the predicated values with the experimental values confirm its effectiveness in the analysis of welding strength.
Keywords— GMAW, AISI 1045, Ultimate Tensile Strength, Taguchi Method (Design of Experiment).
I.INTRODUCTION
GAS-METAL ARC WELDING (GMAW) is an arc welding process that joins metals together by heating them with an electric arc that is established between a consumable electrode (wire) and the workpiece. An externally supplied gas or gas mixture acts to shield the arc and molten weld pool. Although the basic GMAW concept was introduced in the 1920s, it was not commercially available until 1948. At first, it was considered to be fundamentally a high- current-density, small-diameter, bare-metal electrode process using an inert gas for arc shielding. Its primary application was aluminum welding. As a result, it became known as metal-inert gas (MIG) welding, which is still common nomenclature. Subsequent process developments included operation at low current densities and pulsed direct current, application to a broader range of materials, and the use of reactive gases (particularly carbon dioxide) and gas mixtures. The latter development, in which both inert and reactive gases are used, led to the formal acceptance of the term gas-metal arc welding. The GMAW process can be operated in semi-automatic and automatic modes. All commercially important metals, such as carbon steel, high-strength low-alloy steel, stainless steel, aluminum, copper, and nickel alloys can be welded in all positions by this process if appropriate shielding gases, electrodes, and welding parameters are chosen.
In the an arc is established between a continuously fed electrode of filler metal and the workpiece. After proper settings are made by the operator, the arc length is maintained at the set value, despite the reasonable changes that would be expected in the gun-to-work distance during normal operation. This automatic arc regulation is achieved in one of two ways. The most common method is to utilize a constant-speed (but adjustable) electrode feed unit with a variable-current (constant-voltage) power source.As the
————————————————
• 1Rakesh B Prajapati, Master Scholar, KSV University, Gujarat, India. E-mail: rakeshprajapati2409@gmail.com.
• 2Disha B Patel, Assistant Professor, KSV University, Gujarat, India. E-mail:disha.modasa@gmail.com
• 3Tushar M.Patel , Associate Professor, KSV University, Gujarat, India. E-mail:tushar.modasa@gmail.com
gun-to-work relationship changes, which instantaneously
alters the arc length, the power source delivers either more
Fig 1: GMAW Process
current (if the arc length is decreased) or less current (if the arc length is increased). This change in current will cause a corresponding change in the electrode melt-off rate, thus maintaining the desired arc length [6].
Design of Experiment (DOE) and statistical
techniques are widely used for optimization of process
parameters. In the present study the welding process
parameters of GMAW can be optimized to maximize the yield strength of the work piece also reducing the number of experiments without affecting the results. The optimization of process parameters can improve quality of the product and minimize the cost of performing lots of experiments and also reduces the wastage of the resources. The optimal combination of the process parameters can be predicted. This work was concerned with the effects of welding process parameters on the yield strength of AISI
1045 joints.
II. LITERATURE REVIEW
Y.Ruan et.al was perform their experiment on Twin wire MIG (metal inert gas arc welding) arc welding was employed on 6-mm thick 6082-T6 Al-alloy plate partially
IJSER © 2014 http://www.ijser.org
International Journal of Scientific & Engineering Research, Volume 5, Issue 4, April-2014 16
ISSN 2229-5518
with SiO2 activating flux. The micro-structural characteristics of the weld joint were investigated using optical, scanning microscopy and energy dispersive spectroscopy. Mechanical properties were studied with micro-hardness and tensile test. Results show that no obvious difference from the microstructures of the joints prepared with and without SiO2 flux, the joint HAZ (heat affected zone) with SiO2 flux was observed to be slightly wider than the one without the flux. [4].
Erdal Karadeniz et.al In this study, the effects of various welding parameters on welding penetration in Erdemir
6842 steel having 2.5 mm thickness welded by robotic gas
metal arc welding were investigated. The welding current, arc voltage and welding speed were chosen as variable parameters. The depths of penetration were measured for each specimen after the welding operations and the effects of these parameters on penetration were researched.As a result of this study, it can show, welding current increased the depth of penetration. In addition, arc voltage is another parameter in incrimination of penetration. However, its effect is not as much as currents [1].Ehsan Gharibshahiyan
et. al was investigate the effect of welding parameters and
welded microstructure increases and grain boundaries are reduced in the background. Reduction in grain boundaries as locks for movement of dislocations, increases possibility and amount of dislocation movement as line defects in structure. That turns reduction in strength and hardness of welded metal. [5].
DESIGN OF EXPERIMENT (DOE)
Reduced "variance" for the experiment with "optimum settings" of control parameters. So the marriage of Design of Experiments with optimization of control parameters to get best results is achieved in the Taguchi Method "Orthogonal Arrays" provide group of well balanced (least) experiments and Dr. Taguchi's Signal-to-Noise ratios (S/N), they are log functions of desired output, serve as objective functions for optimization, help in data analysis and prediction of optimum results [1].
1. Signal-to-noise ratio:
1.1 Larger the better:
∑n 1
heat input on the HAZ and grain growth in Gas metal arc welding process. The role of grain size on hardness and
toughness of low carbon steel has also been studied. It was

SN = −10log10 �
1.2 Smaller the better:

i=1 yi 2
n �
observed that, at high heat input, coarse grains appear in
𝑁𝑖 = −10𝑙𝑙𝑙10
∑𝑛 2
the HAZ which results in lower hardness values in this zone[3]. Stefano Maggiolino et. al was perform the experiment on comparison of the corrosion resistance of AA6060T5 and AA6082T6 aluminium alloy material. Using joint by Friction Stir Welding (FSW) and Metal Inert Gas (MIG. The test was performing on welded and polished samples in an acid salt solution. The corrosion resistance was detected by morphological analysis of the same material surface. The attack was localized an index referred to the pit density was used for the comparison. By analysis of paper can conclude that joint welded via friction stir is more resistant than that welded by Metal inert gas technique. The welded surfaces were polished with emery paper (Silicon Carbide) and finished with diamond paste till 1µm; the MIG welded samples were first milled and then polished [2]. C.W. Mohd Noor et. al perform their experiment on aluminium and its alloys are which are mostly used in marine applications because of their corrosion resistance and lightweight properties. It was observed that increasing the welding current caused the decreasing in mechanical properties of welded metal. These phenomena can be related to metallurgical behaviour of weld It related when increasing in arc voltage and welding current or reducing in welding speed increases the welding
heat input. With increasing the input energy, grain size in
� 𝑖=1 𝑦𝑖
𝑛
Where, - Signal to Noise(S/N) Ratio,
Yi - its observed value of the response,
n - no. of observations in a trial,
y - Average of observed values (responses)
In the Taguchi Method the term ‘signal’ represents the
desirable value (mean) for the output characteristic and the
term ‘noise’ represents the undesirable value (standard
Deviation) for the output properties. Therefore, the S/N
ratio to the desirable value of the S. D. S/N ratio used to calculate the quality characteristic variable from the desired value.
The S/N ratio S is defined as
S = - 10 𝑙𝑙𝑙10 (Mean of sum square of reciprocal of measured Data)
To get the optimal welding performance, higher the better quality characteristic for penetration must be taken. Regardless of the category of the quality, a greater S/N ratio corresponds to better quality characteristics. Therefore, the optimal level of the process parameters is the level with the greatest S/N ratio.
III. EXPERIMENTAL PROCEDURE
IJSER © 2014 http://www.ijser.org
International Journal of Scientific & Engineering Research, Volume 5, Issue 4, April-2014 17
ISSN 2229-5518
The chemical composition and mechanical properties of the test specimens are shown in Table 1, and that of the
welding electrode are given in Table 2.
Table 1. Chemical Composition of AISI 1045 Material
Table.4. Factor and their level in MIG welding
Carbon | 0.36-0.45 % |
Silicon | 0.10-0.40% |
Manganese | 0.60-1.00% |
Sulphur | 0.050 max. |
Phosphorus | 0.050 max. |
Table. 5. L-25 Orthogonal Array design of Experiment
Table 2. Chemical Composition Of filler wire ER70S-6
Carbon | 0.19 |
Silicon | 0.98 |
Manganese | 1.63 |
Sulphur | 0.025 |
Phosphorus | 0.025 |
In the present work, AISI 1045 specimens was prepare with dimensions of 250 mm×75 mm×6mm of each were used as the workpiece. Optical emission spectroscopy (OES) has been done to find out the chemical composition of the base metal, is shown in Table 1. These specimens were prepared with V Shaped groove as shown in Fig. 2, where groove angle, root face and root gap were 65◦, 1.5 mm and 1.5 mm, respectively.

Fig: 2:Profile of the edge of the V-groove.
The surface of the plates was grind to remove the dust and other foreign particles. In order to obtain a strong bonded joint the properties of the base metal and the welding wire must comply with each other. The type of material of welding wire total depends upon the material that is required to be welded. So ER 70S-6 was selected as welding wire with a diameter of 1.2 mm was selected, shielding gas was 80% carbon and 20% argon use in same experiment.
The effect of the process parameters, viz., voltage, wire speed, welding current and gas flow rate and focusing position on the weld joint yield strength has been investigated. Power source PROSTAR MIG-350 used to join the 6mm plate which has current and voltage range 350 A and 24 V respectively.
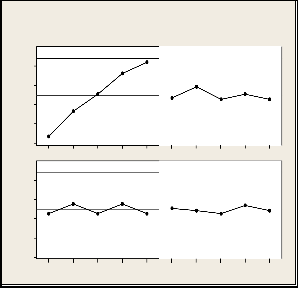
IV.RESULT AND DISCUSSION
Effect of current
In this investigation current was found more effective
parameter in figure 3. Can see that as the welding current increase ultimate tensile strength was also increase result show increase the current increases in the depth of penetration and width of the weld penetration. In this experiment high strength achieve at current 220 Amp.
IJSER © 2014 http://www.ijser.org
International Journal of Scientific & Engineering Research, Volume 5, Issue 4, April-2014 18
ISSN 2229-5518
600
580
560
540
520
Main Effects Plot for Means
Data Means
Current (Amp)
Voltage
Table 7. Response Table for Signal to Noise Ratios
180
190
200
210
220
19.5
20.5
21.5
22.5
23.5
600
580
560
540
520
GFR (L/Min) W.S(mm/Min)
15 16
17 18
19 175
200
225
250
275
Fig: 3: Main effect plot for Mean
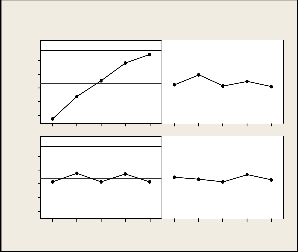
Table 6. Response Table for Means
Main Effects Plot for SN ratios
Data Means
Effect of Voltage
Arc voltage setting vary depending on the material, shielding gas and transfer mode trial runs are necessary to adjust voltage to produce most favourable arc characteristics. In this experiment in fig 3 and fig.4 show the voltage 21.5 V the strength decrease and it further
increase at 22.5 V and achieve maximum strength at 20.5 V.
Effect of gas flow rate
It can be seen in the fig 3 and fig.4 strength is minimum at
15 l/min and its further increases at 16 l/min. highest value
of the strength can achieve at 18 l/min gas flow rate.
Effect of welding speed
Welding speed is linear rate at which the arc is moved
along the weld joint as the travel speed is increases the
thermal energy per unit length of the weld transmitted to the base metal from the arc is first increased because the arc act more directly on the base metal with further increases in welding speed less thermal energy per unit length of weld is imparted to the base metal. It can be observed in figure 3
55.50
55.25
55.00
54.75
54.50
180
190
Current (Amp)
200
210
220
19.5
20.5
Voltage
21.5
22.5
23.5
& 4 minimum strength at 225 m/min welding speed and it
further increases and can achieve highest value at 275 m/min welding speed. From the data, the optimum set of parameters was found current 220 Amp, Voltage 20.5 V, Gas flow rate 18 l/min, welding speed 250 m/min, as shown in Table 6. The optimum value of Ultimate tensile
55.50
55.25
55.00
54.75
54.50
GFR (L/Min) W.S(mm/Min)
strength with the optimum set of parameters is given in
Table 9.
Table 8. Predicted optimum parameter value
15 16
17 18
19 175
200
225
250
275
Signal-to-noise: Larger is better
Fig: 4: Main effect plot for signal to Noise ratio
IJSER © 2014 http://www.ijser.org
International Journal of Scientific & Engineering Research, Volume 5, Issue 4, April-2014 19
ISSN 2229-5518
Table 9. Ultimate tensile strength Predicted value
Mean (Mpa) | S/N Ration |
623.89 | 55.91 |
V. CONCLUSION
i) Experiment show that current has a significant effect on the Ultimate tensile strength.
ii) In these experiment the confirmation
experiment result is 623.89 Mpa in which
input parameter given in table.6
iii) The optimal parameter combination for
maximum UTS was obtained by analysis of the S/N ratio. The optimal parameters for surface roughness were as follows: current 220
Amp, Voltage 20.5 V, Gas flow rate 18 l/min, welding speed 250 m/min.
IV. ACKNOWLEDGEMENT
The authors would like to thank to managing director, Mr. Ragesh Bateriwala of Keepshake Engineering Pvt. Ltd Industries to furnish resources for research work further I
am extend my thanks to their employee for support to conduct the experiment.
VII. REFERENCES
[1]. Erdal Karadeniz , Ugur Ozsarac , Ceyhan Yildiz (2007),”The Effect of Process Parameters on Penetration In Gas Metal Arc Welding Process”, Science Direct , Materials and Design Vol.28, pp. 649–656.
[2]. Stefano Maggiolino, Chiara Schmid(2008),” Corrosion resistance in FSW and in MIG weldingTechniques of AA6XXX”, journal of materials processing technology . Vol.1 9 7. p.p 237–240.
[3]. Ehsan Gharibshahiyan , Abbas Honarbakhsh Raouf , Nader Parvin ,
Mehdi Rahimian (2011),” The effect of microstructure on hardness and toughness of low carbon welded steel using inert gas welding” Materials and Design . vol.32 p.p 2042–2048.
[4]. Ruan Y, Qiu X M, Gong W B, Sun D Q and Li Y P (2012),“Mechanical Properties and Microstructures of 6082-T6 Joint Welded by Twin Wire Metal Inert Gas Arc Welding with the SiO2 Flux”, Materials and Design, Vol. 35, pp. 20-24.
[5]. C.W. Mohd Noor , Khalid Samo , Nurazilla , M. Azlan Musa and Abdul Majeed Muzathik,” The Effect of Arc Voltage and Welding Current on Mechanical and Microstructure Properties of 5083-Aluminium Alloy Joints used in Marine Applications”, Empowering Science, Technology and Innovation Towards a Better Tomorrow p.p 169-178.
[6]. American welding society eight edition welding processes vol-2, august
27, 2000 p.p 109 - 110
IJSER © 2014 http://www.ijser.org