International Journal of Scientific & Engineering Research, Volume 4, Issue 4, April-2013 1096
ISSN 2229-5518
Morteza Chahardahcherik1, Samaneh Poursaman2
Abstract: CO2 injection is a potentially viable method of enhanced oil recovery (EOR) for medium oil reservoirs. This paper compares the ef fect of gas injection strategy (SWAG, WAG, and CGI) on recovery in immiscible, near miscible, and miscible modes of injection. It has been proved that continuous gas injection (CGI) is not the most efficient injection scenario in oil-wet reservoirs.
Miscible and near miscible core flood tests demonstrated high oil recoveries in all injection strategies due to high capillar y numbers achieved as
a result of miscibility. The fluid mechanics of floods were discussed using pressure drop data, different mechanics was obser ved for SWAG, WAG, and CGI and better mobility control of SWAG was proven. Results show that tapering postponed gas breakthrough and less amount of gas was in- jected using this technique, this makes tapering favorable both economically and operationally. Experiments with different ga s to water ratios were performed and the results show that the ultimate oil recovery during SWAG injection is almost independent of gas to water ratio. This makes SWAG injection a promising recovery process especially for reservoirs where continuous and high rate gas injection is not pos sible.
—————————— ——————————
as injection is a major EOR scenario used in the light oil reservoirs. Although the microscopic sweep efficiencies of the gas injection processes is very high the volumetric sweep has always been a cause for concern (Hinderaker, Utseth,Hustad, Kvanvik, & Paulsen, 1996). The mobility ratio, which controls the volumetric sweep between injected and displaced oil bank in gas processes, is typically highly unfavorable in gas floods due to the relatively low viscosity of the injected phase. This makes flood profile control, the biggest concern for the application of gas EOR process.
The Water-alternating-Gas (WAG) process, proposed in
1958 by Caudle and Dyce (Caudle, & Dyes, 1959), has
remained the most widely practiced profile control method in the oil field today. The combination of higher microscopic displacement efficiency of gas, especially in a miscible mode, and the better macroscopic displacement efficiency of gas help significantly to increase oil production (Christensen, Stenby, & Skauge, 1998). Oil recovery can be enhanced by combined injection of water and gas in an alternating (WAG) or simultaneous (SWAG) scheme.
SWAG appears to provide better control of gas mobility than WAG, resulting in improved sweep efficiency in ad- dition to more steady gas production and GOR response. Operational problems of SWAG injection like injection of two-phase fluid through one line and relatively low Field
usage make SWAG less experienced. A new method of SWAG injection has been proposed, in which water is injected at the top of reservoir and gas is injected at the bottom(Algharib, Gharbi, & Malalleh, 2007).The improved gas handling and oil recovery have been reported for SWAG injection at Siri field (Berg, Stensen, Crapez, & Quale, 2002; Quale, Crapez, Stensen, & Berg, 2000). It has been shown that SWAG injection can provide over 3-fold greater vertical gas sweep than can alternate injection (Stone, 2004).
In this study, results of experimental core flooding tests of WAG, SWAG, and CGI processes are presented. The laboratory Experiments aimed the effect of injection pressure (immiscible, near miscible, and miscible) and injection scenario (SWAG, WAG, and CGI) on the recovery of oil from reservoir cores. The effect of injection mode on pressure drop across the core was discussed to understand the mechanics of the floods.
The porous medium used in all experiment was a cylindrical oil-wet carbonate core sample with a length of
15.6 cm and 3.8 cm in diameter. The porosity was14.1% and the absolute permeability to liquid, measured with brine at the reservoir temperature, 70˚C, was 8 mD. Table
1 provides an overview of core sample properties.
————————————————
Corresponding Author: Morteza Chahardahcherik, E-mail: moory2105@gmail.com
Co-Author: Samaneh Poursaman
E-mail: samane.poursaman@gmail.com
IJSER © 2013
The research paper published by IJSER journal is about Experimental Analysis of Secondary Gas Injection Strategies 1097
ISSN 2229-5518
TABLE 1
THE PROPERTIES OF POROUS MEDIA
![]()
Property Value
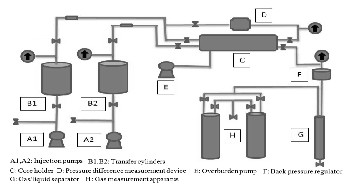
Fig.1 schematic of coreflooding aparatus
SWAG injection test in immiscible mode were performed with reservoir dead oil. All SWAG injection tests above reservoir bubble point were performed with live oil made by recombination of dead oil with a synthetic gas mixture. PVT properties were determined from commercial PVT software using Redlich-Kwang Equation of State , the obtained values from the software were verified experimentally to ensure that the recombined oil represent reservoir oil properly. Minimum miscibility pressures of the recombined oil were determined using the commercial PVT software and the values were verified with slim tube simulation.
A schematic of core flooding apparatus is shown in Fig 1. The core flood apparatus consists of a core holder, injection system, production system, and data acquisition. The injection system consists of two pumps (to inject gas and water) and two transfer cylinders (for fluid storage). The production system utilizes a back pressure regulator to control the core outlet pressure at a set level. During experiment the core effluent was flashed to atmospheric pressure and room temperature. The gas line was connected to an apparatus for gas measurement. The separator fluid was collected in a glass container and the amount of fluids was determined volumetrically.
Porosity measurement was done by evacuation of the core
in a cylinder for more than 24 hours the saturating process was then began by injection of 5000 ppm brine into the cylinder, after pressurization of the cylinder with brine for more than 24 hours above 2000 psi the difference of the core weight was measured precisely and the porosity was calculated.
To measure absolute permeability of the core the brine
saturated core was placed inside a rubber sleeve .The core and the rubber sleeve were assembled into the core flooding rig and the overburden pressure was exerted to seal the assembly. Then brine was injected at different rates into the porous medium to calculate absolute permeability of the core. After this stage brine was replaced by dead oil injection at rate of 0.1 cc/min to reach connate water saturation. High oil saturation consequently low connate water saturation (12.2% to
13.1%) was characteristic of an oil-wet carbonate rock. By
setting value of back pressure regulator to the test pressure the system was pressurized, after this stage the core was connected to the live oil cylinder and it was flooded with live oil to displace the dead oil. To ensure that all of the dead oil was replaced, the live oil injection was carried out until the produced fluid GOR reached the live oil GOR. The core was kept in this condition to age with the reservoir oil for 4 days to restore the initial wettability.
Between experiments the core was place in a soxhlet
apparatus to be washed with toluene to remove any oil from the rock. The core was then washed by methanol to remove residual water and was then dried using air. The core porosity and permeability was re-measured before starting a new experiment in order to ensure that the core properties remained unchanged and results from different experimental runs could be compared against one another without pore structure effect.
The research paper published by IJSER journal is about Experimental Analysis of Secondary Gas Injection Strategies 1098
ISSN 2229-5518
Secondary SWAG and WAG injection were performed by CO2 as injected gas; three series of experiments were carried out for each scenario at 2500 psi, 1850 psi, and 500 psi. Assuming the mentioned pressures immiscible, near miscible and miscible modes of injection were covered.
The prepared setup had two injection inlets; after establishing the live oil into the core, SWAG was started by injection of gas at the top of the core with injection rate of 0.1 cc/min and injection of water at the bottom of the core with injection rate of 0.2 cc/min. In order to obtain reliable results, WAG injections were performed by injecting gas at the bottom of the core with injection rate of 0.2 cc/min and water was injected at the top of the core with injection rate of 0.4 cc/min. To compare SWAG and WAG results with continuous gas injection three gas floods were designed at 2500 psi, 1850 psi, and 500 psi. Injection rate was set to 0.3 cc/min in all gas floods through both injection inlets.
The highest oil recovery was achieved with SWAG injection at
2500 psi by 71.2 % of OOIP. As it can be seen in Figure 2 fluid
production characteristics indicate high displacement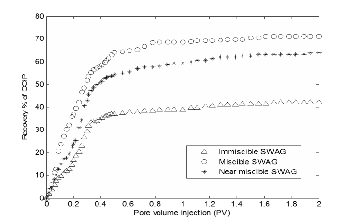
efficiency of miscible SWAG injection, the difference between ultimate recoveries of WAG and SWAG injection at 2500 psi was 3.3 % and SWAG injection accelerates oil production compared to WAG. This behavior is probably because of better mobility control of water phase by gas front in SWAG injection and better vertical sweep efficiency of SWAG.
In immiscible mode, the better mobility control of SWAG was proven by later gas breakthrough, 0.63 PV, compared to this value in WAG injection which occurred at 0.5 PV. In miscible SWAG injection 29.7% more oil was produced as compared to immiscible injection this is probably because of several
parameters such as compositional effects and swelling which are involved in this mode of injection.
Near miscible SWAG injection can lead us to 63.9% of OOIP recovery. Near miscible injection benefits from advantages of immiscible injection and also can partially present behavior of miscible injection at much lower injection pressure; near miscible injection seems to be a promising EOR scenario to alleviate both economical concerns and operational difficulties of high pressure injection.
Figure 3 shows a comparative schematic of SWAG and CGI injection at both miscible and near miscible modes, the differences between recoveries are probably because of relatively low viscosity of gas which resulted in rapid gas breakthrough which occurred at 0.4 PV injected. Also, another reason could be responsible for lower recovery of CGI as compared to SWAG which is due to relatively low density of gas phase which results in upward movement of the flood and leaving behind considerable portion of oil in unswept area at the bottom of the core.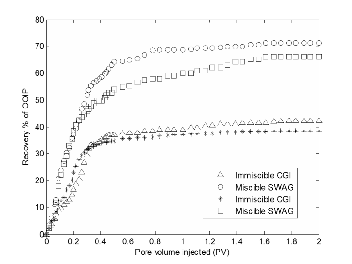
In Figures 4, 5, and 6 pressure drops across the core for immiscible CGI, SWAG, and WAG are shown graphically. In all modes of injection there is a high value region at the early life of flooding process, this behavior suggests single phase oil flow through the core at connate water saturation. At gas breakthrough as a result of lower gas viscosity compares to oil viscosity, the pressure drop reduces considerably.
Pressure drop behavior after this step is different for each injection mode. For CGI after the considerable reduction
IJSER © 2010
The research paper published by IJSER journal is about Experimental Analysis of Secondary Gas Injection Strategies 1099
ISSN 2229-5518
of pressure drop the value is increasing gradually but never gets near the initial value of pressure drop. The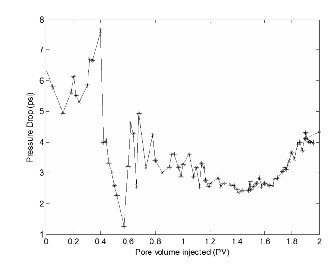
gradual increase is because of injectivity reduction as a result of injection of another phase into the porous media continuously.
In SWAG injection case, after gas breakthrough due to injectivity reduction of two phase injection and the continuous flow of three phases together the measured pressure drop is increasing constantly which is suggesting a relatively stable front inside the porous medium.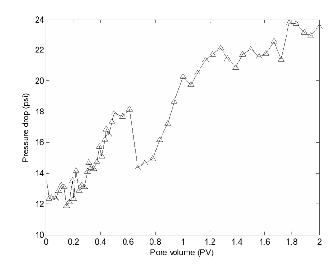
injection
In the case of immiscible WAG injection after gas breakthrough the gradual increase of pressure drop gets to values way over the initial values, this behavior suggests a predominantly three-phase flow phenomena.
The alternation of injected fluid between gas and water resulted in the periodic increases and decreases of the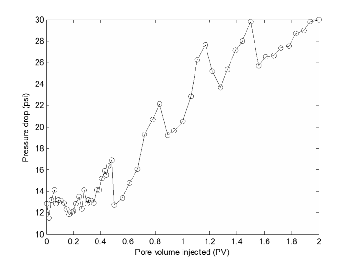
measured pressure drop, this is an unfavorable behavior compared to SWAG injection due to negative influence on the flow mechanics of the flood.
injection
As it has been shown in Figure 7 in miscible continuous gas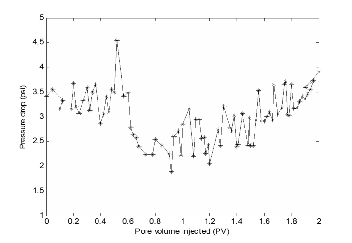
injection the decrease of pressure drop after gas breakthrough is considerably lower than immiscible condition it is probably because of miscibility development which changes the flow from two-phase in immiscible form to one-phase (CO2 and oil) flow. For the same reason, in Figure 8 the pressure drop variance between two following WAG cycles is lower as compared to this value for immiscible condition.
The research paper published by IJSER journal is about Experimental Analysis of Secondary Gas Injection Strategies 1100
ISSN 2229-5518
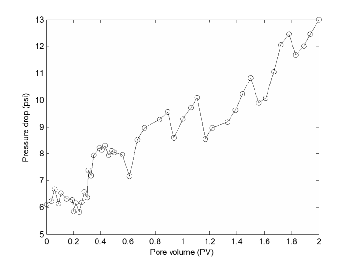
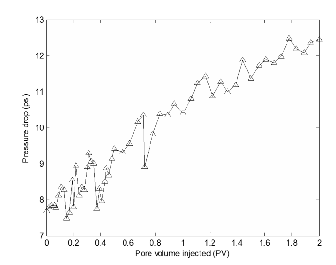
Figure 9 shows that in SWAG injection the increasing rate of pressure drop is lower than immiscible injection; it is because of miscible condition of injected gas which creates one phase with the reservoir oil which results in two-phase flow characteristics inside the porous medium instead of three-phase flow.
In order to investigate the effect of gas to water ratio in WAG and SWAG processes, four core floods were designed with different gas to water ratios in miscible mode. One of the core floods was performed in SWAG mode by gas injection at rate of 0.05 cc/min and water injection at rate of 0.25 cc/min; the same flood was done in
WAG mode by gas injection at rate of 0.1 cc/min and water injection at rate of 0.5 cc/min, both floods were performed
with gas to water ratio of 0.25 %. The other runs were carried out in WAG and SWAG modes similarly with gas to water ratio of 1.
Figure 10 provides data of ultimate oil recoveries with
different gas to water ratio, in SWAG injection the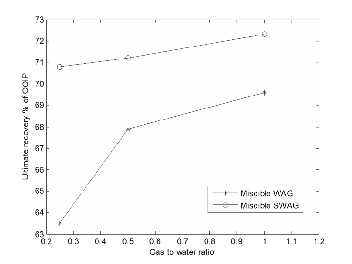
variance of ultimate oil recovery with different gas to water ratios is considerably smaller than the variance for WAG injection. This is due to simultaneous injection of gas and water in SWAG which results in existence of enough gas to maintain a continuous gas path in the porous medium to recover the extracted oil from the pores by compositional effects, and also because of the better vertical sweep efficiency of SWAG as compared to WAG. In WAG injection because of alternating nature of the process the injected gas may recover some oil from small pores but because of the interruption of gas path between cycles injected gas may choose another path in the next cycle and consequently leave behind some recoverable oil zones. SWAG best suits the cases were only little gas is available or some gas is available seasonally.
Tapering is generally done in most of the CO2 and hydrocarbon floods and prevailed even in the earliest WAG trials (Christensen, Stenby, & Skauge, 1998). In this study we wanted to examine this process in SWAG injection. To compare results with previous tests a core flood run was designed, the injection was started by gas injection at the bottom of the core at rate of 0.15 cc/min
IJSER © 2010
The research paper published by IJSER journal is about Experimental Analysis of Secondary Gas Injection Strategies 1101
ISSN 2229-5518
and water injection at the top of the core at rate of 0.15 cc/min. After 0.3 PV injection the tapering process was started by reducing gas injection rate to 0.1 cc/min, to maintain the cumulative injection rate water injection rate was increased to 0.2 cc/min; the same procedure were done at 0.6 PV injection by reducing gas injection rate to
0.05 cc/min and by increasing water injection rate to 0.25
cc/min.
Figure 11 schematically illustrates the comparative results
of this test and SWAG injection with gas to water ratio of
1. The ultimate recovery of flood with tapering is 74.8%
OOIP which is 2.5% higher than ultimate recovery
without tapering, gas breakthrough occurred at 0.64 PV in the flood with tapering which was later than gas breakthrough of the normal flood which occurred at 0.59
PV. These results proved that tapering resulted in better
control on gas mobility and channeling due to later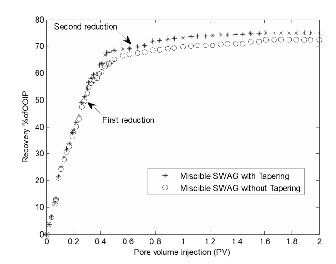
breakthrough of the gas. Relatively low GOR and higher oil recovery are major operational advantages of this process. Tapering is important from economical point of view when the injected gas is expensive and needs recycling.
The results of the experiments presented in this paper, all of which were carries out using the same core plug improved our understanding of fluid mechanics of several gas injection scenarios. The following list summarizes the main observations and conclusions made in the present paper.
1. Among all experimented processes (CGI,WAG, and SWAG), the highest ultimate oil recovery was achieved with miscible SWAG injection. Fluid production characteristics indicate high displacement efficiency of this process.
2. Later gas breakthrough indicates better mobility control of water phase by gas front in SWAG injection as compared to WAG.
3. CGI injection is not recommended in oil-wet reservoirs
due to low recovery and high gas utilization.
4. Near miscible SWAG injection is a promising gas injection scenario due to high displacement efficiency
and considerably lower injection pressure than miscible injection.
5. In fields where gas supply is seasonal or limited, SWAG injection is recommended due to negligible change of ultimate oil recovery as the injection gas to water ratio changes.
6. Tapering is able to postpone gas breakthrough and
decrease the volume of injected gas, so it is more efficient to use this technique both economically and operationally.
EOR : Enhanced oil recovery WAG : Water alternating gas SWAG: Simultaneous water and gas CGI : Continuous gas injection OOIP : Original oil in place
MMP : Minimum miscibility pressure
PV : Pore volume
GOR : Gas oil ratio
Hinderaker, L., Utseth, R.H., Hustad, O.S., Kvanvik, B.A., and Paulsen, J.E.1996.RUTH- A comprehensive Norwe- gian R&D program on IOR. Paper SPE 36844 presented at the European Petroleum Conference, Italy.
Caudle, B.H., and Dyes, A.B.1959.Improving Miscible Displacement by Gas-Water Injection. Transactions of AIME 213:281-284.
Christensen, J.R., Stenby, E.H., and Skauge, A. 1998. Re- view of WAG Field Experience. paper SPE 39883 present- ed at the SPE International Petroleum Conference and Exhibition of Mexico, Mexico.
Algharib, M., Gharbi, R., and Malallah, A. 2007. Paramet-
ric Investigation of a Modified SWAG Injection Tech- nique. Paper SPE 105071 presented at the SPE Middle East Oil & Gas Show and Conference, Bahrain.
Berg, L.I., Stensen, J.A., Crapez, B., and Quale, A. 2002.
SWAG Behavior Based on Siri Field Data. Paper SPE
The research paper published by IJSER journal is about Experimental Analysis of Secondary Gas Injection Strategies 1102
ISSN 2229-5518
75126 presented at SPE/DOE Improved Oil Recovery
Symposium, Oklahoma.
Quale, E.A, Stensen, J.A., Crapez, B., and Berg, L.I. 2000. SWAG Injection On the Siri Field- An Optimized Injection System for Less cost. Paper SPE 65165 presented at SPE European Petroleum Conference.
Stone, H.L. 2004. A Simultaneous Water and Gas Flood Design with Extraordinary Vertical Gas Sweep. Paper SPE 91724 presented at SPE International Petroleum Con- ference, Mexico.
Stoisits, R.F., Krist, G.J., Ma, T.D., Rugen, J.A., Kolpak,
M.M., and Payne, R.L. 1995. Simultaneous Water and Gas Injection Pilot the Kuprak River Field, Surface Line Im- pact. Paper SPE 30645 presented at SPE Annual Technical Conference and Exhibition.
Kulkarni, M.M., and Rao, D.N. 2005. Experimental Inves-
tigation of Miscible Secondary Gas Injection. Paper SPE
95975 presented at SPE Annual Technical and Exhibition,
Texas.
Faisal, A., Bisdom, K., Zhumabek, B., Mojaddam Zadeh,
A., and Rossen, W.R. 2009. Injectivity and Gravity Segre-
gation in WAG and SWAG Enhanced Oil Recovery. Paper SPE 124197 presented at SPE Annual Technical Confer- ence and Exhibition, Louisiana.
Ghanbarnezhad, R. and Lake, L.W. 2010. Simultaneous
Water-Gas-Injection Performance Under Loss of Miscibil-
ity. Paper SPE 129966 presented at SPE Improved Oil Re- covery Symposium, Oklahoma.
IJSER © 2010