Inte rnatio nal Jo urnal o f Sc ie ntific & Eng inee ring Re se arc h Vo lume 3, Issue 3, Marc h -2012 1
ISSN 2229-5518
Evaluation of the Performance of Digital Video Analysis of Human Motion: Dartfish Tracking System
Moataz Eltoukhy, Shihab Asfour, Craig Thompson, Loren Latta
Abs tract—Motion capture has been used to analyze various aspects of human motion. There are tw o basic approaches to analyze motion, tw o dimensional and three dimensional. These approaches are of ten supplemented w ith the use of computer packages in o rder to handle complex calculations. The research perf ormed attempted to determine w hether a modest, p ortable motion analysis tool can provide results comparable to those obtained using 3D motion capturing system (Vicon) during a simple mot ion. The 2 D sof tw are under investigation is called Dartf ish w hich uses digital video as input and is able to generate values f or the location of markers in tw o dimensions. It w as f ound that the magnitudes of the diff erences in the markers’ trajectories betw een Dartf ish and Vicon w ere about ± 5 mm. Based on the statistical analysis, it w as concluded that this 2D method has serious potential f or f uture studies that involves more complex movements.
Inde x Terms— Digital video, human motion, Dartf ish, Tracking. .
—————————— ——————————
1 INTRODUCTION
OTION capture has been used to analyze various as- pects of human motion. The focus of the measurement depends on the context of the motion capture. For instance, a surgeon may want to compare the pre-surgical motion of a
joint or a limb to the post-surgical motion
There are two basic approaches to analyze motion, two di-
mensional (2D) analyses and three dimensional (3D) analyses.
The 3D system uses multiple cameras to track reflective mark-
ers attached to the body. 3D systems are considered to be a c- curate for motion analysis, but tend to be expensive and diffi- cult to use for the average person. Some applications of 2D video based systems can capture the video with an inexpen- sive off the shelf camera. This video can be streamed instantly or loaded on a computer at a later time for analysis.
If a 2D video can be analyzed, and if the data are validated by an accepted laboratory model, this model can be widely used and adopted for many innovative purposes. The data can be used to make informed decisions that can i mprove the treatment of a patient. Athletic performance can be analyzed, refined and potentially mastered. Proper form and technique can be taught by coaches through use of tools that are readily available, a computer and a video camera.
Attempts have been made to provide an affordable and in-
telligent sports training system that will require only a single stationary camera to record the motion of a subject. Wang et al. (2008) set out to examine the performance of such a system compared to a 3D motion based analysis tool.
———— ——— ——— ——— ———
Moataz Eltoukhy is a postdoctoral associate in industrial engineering in
University of Miami, USA. E-mail: meltoukhy@gmail.com
Shihab Asfour is a professor and the associate dean of the college of eng i-
neering in University of Miami, USA. E-mail: sasfour @miami.edu
Craig Thompson earned his M.S. degree in industrial engineering in Uni-
versity of Miami, USA. E-mail: craigthompson305@gmail.com
Loren Latta is a professor in the department of orthopaedics, Miller School
of Medicine, University of Miami, USA. E-mail: LLatta@med.miami.edu
The research performed attempted to determine whether a modest, portable 2D motion analysis tool can provide results comparable to those obtained using state of the art 3D motion capturing system during a simple motion.
The 2D software under investigation is called Dartfish Pro-
Suite 5.5 (Dartfish) which uses digital video as input and is able to generate values for the location of markers in two d i- mensions.
In this work Dartfish generated data were compared to Vi- con generated data and the differences were discussed. In a d- dition to marker positions, knee joint angle, knee joint mo- ment, ankle joint angle and ankle joint moment were also compared as generated separately by the two systems.
Although Dartfish is in widespread use, no studies quanti- fying software performance when compared to a gold stan- dard have been conducted.
There is no intervention to the subject unless markers are placed on them. The makers used in Dartfish do not have to be specialized; they simply must be of a different color than the background.
2 METHODOLOGY
The goal is to prove that Dartfish can provide, with reason- able accuracy and precision, the location of markers in a con- trolled laboratory setting. If it is established a s a reasonable tool to examine simple planar motion, it paves the way for expansion and uses in other applications.
During simultaneous capture of digital video and infrared three dimensional data from Vicon a comparison will be made for the simple squat motion. In other words data will be gen- erated by Vicon and also independently of Vicon using Dart- fish to process digital video acquired during the motion ca p- ture. This will reveal how the two systems differ with regard
IJSER © 2012
http :// www.ijser.org
Inte rnatio nal Jo urnal o f Sc ie ntific & Eng inee ring Re se arc h Vo lume 3, Issue 3, Marc h -2012 2
ISSN 2229-5518
to data generation when measuring the same subject perform- ing the same motion at the same time.
The squat is relatively simple planar activity where the ma- jor motion occurs in two dimensions. The software is used to generate X and Y components of marker location in the sagi t- tal plane. Anatomical measurements can provide the depth component or marker depth in the coronal plane if an estimate is necessary.
The marker’s position is measured in reference to the origin set. The magnitude of the distance traveled in the X or Y direc- tion is calculated based on a reference distance set by the user. This reference distance is specified in the video using a seg- ment attributed to a known length of an object in the video
3.4 Data Collection

The frame rate of the Vicon system cameras was set at 60 frames per second to coincide with the Dartfish rate of 60 frames per second. All cameras were synchronized to the sys- tem via the same sync signal that is sent out by the Ultranet HD device. This ensures that when the trial is initiated the digital video and the infrared video are operating simulta- neously and have the same time stamp associated with the same frame. This allows one frame of Vicon data to also have, at the same instant in time, a Dartfish associated paired mea- surement.
LBHD Yellow marker is
that is in the plane of motion (Fig.1).
RBHD
RFHD LFHD
C7
RSHO RBAK
RUPA
RELB RPSI RASI RFRA RWRB
RWRA
RFIN
LSHO LUPA STRN
LELB T10
LPSI LASI
LFRA LWRA
LWRB
LFIN
placed on the
posterior side of the body.
Red marker
is placed on the frontal part
of the body.
LTHI
RTHI
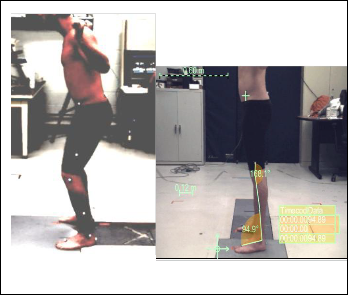
Fig. 1. Snapshot of Dartf ish ProSuite 5.5 video Analyzer
3.1 Set Up
The University of Miami Biomechanics Research Laborato- ry contains Vicon Motion Technology equipment.The hard- ware for the system includes:
(1) 10 Vicon MXF40 infrared cameras (MX cameras)
(2) 4 Basler A602fc digital video cameras (DV cameras)
(3) Vicon MX Ultranet HD to synchroniz the MX and DV cam- eras.
The subject is dressed in compression shorts that fit tightly
to the body. The reflective markers are placed on the body
according to the lower body plug-in-gait model. The model consists of 16 markers: LASI, RASI, LPSI, RPSI, RTHI, LTHI, RKNE, LKNE, RTIB, LTIB, RANK, LANK, RHEE, LHEE, RTOE and LTOE. The entire Plug-in-Gait marker set can be found in Figure 2.
The lower extrimety model that utilizes sixteen markers placed in various locations from the hip bones down to the feet can be found in Figure 3. Anthropometric measurements of the subject are taken such as height, mass, etc.
RKNE
RTIB
RHEE RANK
RTOE
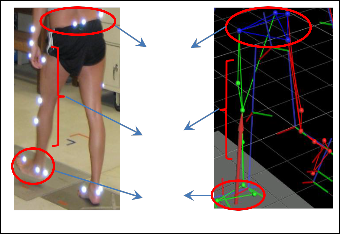
Fig. 2. Full Plug-in-Gait marker set
Upper markers
Middle markers
Lower markers
LKNE
LTIB LHEE
LANK LTOE
Fig. 3. Markers subsets.
IJSER © 2012
http :// www.ijser.org
Inte rnatio nal Jo urnal o f Sc ie ntific & Eng inee ring Re se arc h Vo lume 3, Issue 3, Marc h -2012 3
ISSN 2229-5518
The Vicon data was processes in the NEXUS software package to reconstruct the motion in three dimensions. This is a widely accepted method for performing motion analysis as stated in many papers including Barker et al (Barker et al.
2006). Dartfish ProSuite 5.5 was used to extract data for each marker, and recorded these values via tables. After the pos i- tion data were collected of each marker in the horizontal and vertical directions, the knee joint and ankle joint angles were determined using the marker tracking capability on three markers. One marker was tracked as the apex of the angle and one marker was tracked for each of the two legs of the angle. A developed macro was used to create equations for the knee and joint angles with time.
The next step in processing the marker data was to code a program to calculate knee and ankle joint moments in MAT- LAB R2010b (Matlab). The equations for marker position and joint angles were input to Matlab, and the appropriate deriva- tions to get velocity and acceleration equations were per- formed. The equations for moments were taken from (Win- ter, 1990).
4 STATISTICAL ANALYSIS
The presented work yielded two sets of data with the same number of points, one from the three dimensional Vicon sys- tem and one from the two dimensional analysis tool Dartfish ProSuite 5.5.
The null hypothesis was that the rudimentary calculations
made with Dartfish positional data will be statistically differ- ent from the Vicon three dimensional reconstructions for a simple squatting motion with an alpha of 0.05. Paired t-tests on the data were conducted. In the study pertaining to com- paring data generated by the two motion capture systems, Vicon and Dartfish, the sample size was, N=187.
The null hypothesis was rejected in 38 out of 40 tests, and the tests failed to reject the hypothesis in the other two cases. The parameters in which the test failed to reject the null hyp o- thesis were the right knee horizontal component and the left heel vertical component (Tables 1 and 2).
5 RES ULTS AND DIS CUSSION
The magnitudes of the differences in marker positions be- tween the two systems were between -10 and 20 mm overall. The magnitude of the relative difference between the markers tends to remain closer to a certain value and fluctuate above and below that value.
In other words if at time 0 a marker is offset by 15 mm, the
difference between the two systems will be between 15 plus or
minus 5 mm. It was much higher for some markers such as the
LPSI marker which was approximately offset at time 0 by
5mm and the difference was plus or minus 10 mm.
The magnitude of the differences in marker positions of the two systems was smaller in the horizontal direction in general. The magnitudes of the differences are roughly plus or minus 5 mm. There could be multiple reasons for this.
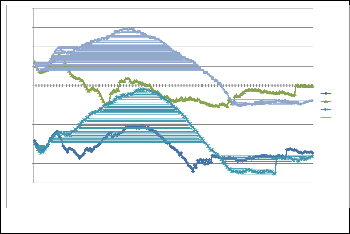
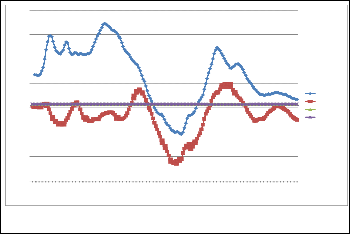
5.1 Upper Ma rker s Trajectories Horizontal Component
Difference s
Figure 4 shows the horizontal component of the upper marker subset. In general, the hip markers travel at higher speed and over larger distances than the other markers. The lines on this graph seem to reflect the same magnitude of dif- ference on both sides. The values obtained from the camera view and video of the right side are centered on the zero line, whereas the values obtained from the left camera view are shifted below the zero line. With the origin at the edge of the force plate, the hip markers are far from it throughout the squat in the vertical but are close to crossing it in the horizon- tal component.
TABLE 1
Paired t-test P-values generated for marker positions with
Minitab

Mraker | P-Value | Mraker | P-Value |
LASI Y | 0.000 | LHEE Y | 0.000 |
LASI Z | 0.000 | LHEE Z | 0.175 |
RASI Y | 0.000 | LTOE Y | 0.000 |
RASI Z | 0.000 | LTOE Z | 0.000 |
LPSI Y | 0.000 | RTHI Y | 0.000 |
LPSI Z | 0.000 | RTHI Z | 0.000 |
RPSI Y | 0.000 | RKNE Y | 0.340 |
RPSI Z | 0.000 | RKNE Z | 0.000 |
LTHI Y | 0.000 | RTIB Y | 0.000 |
LTHI Z | 0.000 | RTIB Z | 0.005 |
LKNE Y | 0.000 | RANK Y | 0.000 |
LKNE Z | 0.000 | RANK Z | 0.000 |
LTIB Y | 0.000 | RHEE Y | 0.000 |
LTIB Z | 0.000 | RHEE Z | 0.000 |
LANK Y | 0.000 | RTOE Y | 0.000 |
LANK Z | 0.000 | RTOE Z | 0.000 |

TABLE 2

Paired t-test P-values and confidence intervals generated for joint angles and moments with Minitab
Joint Angle or Moment | P-Value |
Lef t Knee Angle | 0.000 |
Right Knee Angle | 0.000 |
Lef t Knee Moment | 0.000 |
Right Knee Moment | 0.000 |

5.2 Middle Markers Trajectories Ho rizontal Component
Difference s
Figure 5 shows the horizontal component differences in mm of the middle markers. The middle markers are the thigh, knee and tibia markers. The left side markers are almost en- tirely shifted below the zero line, and the right side markers are almost entirely shifted above the z ero line.
In most of the examinations of the differences it appears
that the reference distance and origin play a huge role in the generation of data. There seems to be a distinct difference in the left and right data as generated by the different videos, and they seem to be grouped with each other somewhat.
5.3 Lower Markers Trajectories Ho rizontal Component
Difference s
The lower markers include the ankle, heel and toe markers. These markers remained essentially motionless throu ghout the squat motion (Fig.6). During the Dartfish tracking it was
IJSER © 2012
http :// www.ijser.org
Inte rnatio nal Jo urnal o f Sc ie ntific & Eng inee ring Re se arc h Vo lume 3, Issue 3, Marc h -2012 4
ISSN 2229-5518
noticed that the software would attempt to follow a moving marker even if the marker was not moving. In other words the Dartfish tracking would float around the tracked region poss i- bly to test for changes in the contrast.
way that the two systems measure joint angles will be dis- cussed later. The differences are minor in the case of the knee angles but are drastic in the case of the ankle angles (Figure 8).
20 200
15 180
160
10
140
5
0
-5
-10
LASI Y RASI Y LPSI Y RPSI Y
120
100
80
60
Vlknee Dlknee Vrknee Drknee
-15 40
-20 20
-25 0
Frame number
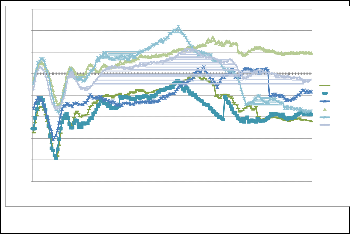
Fig. 4. Diff erence in mm betw een measurements made by Dartf ish and Vicon motion systems.
Frame number
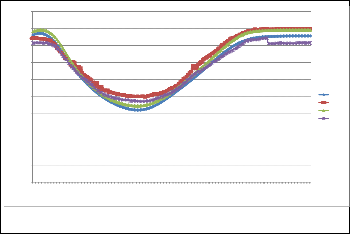
Fig. 7. Values f or lef t and right knee joint angles measured by the tw o systems.
15
10
5
0
-5
-10
-15
-20
-25
Frame number
LTHI Y
LKNE Y
LTIB Y
RTHI Y
RKNE Y RTIB Y
5.5 Ankle Joint Angles
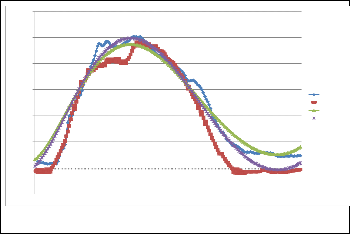
At first glance on Fig. 8, one would assume that the values for ankle angle are way off. This comes down again to the way in which the two systems measure the angle. The left ankle angle differed between the two systems by an average of
13.1%. The right ankle angle differed as measured by the two
systems by a rather large 19.1%. It appears that both ankle angles are offset by approximately 12 degrees, with the Vicon angle being about 12 degrees more narrow. In measuring the angles with Dartfish, the user must track 3 markers simulta- neously; the error involved in tracking one marker will be multiplied across 3 markers.
When examining the angles for knee and ankle it appears
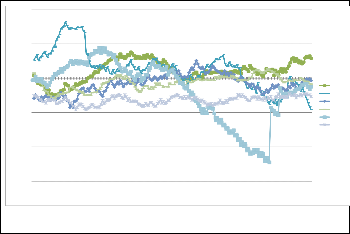
Fig. 5. Diff erence in mm betw een measurements made by Dartf ish and Vicon motion systems.
10
5
that the values are typically within plus or minus 10 degrees.
Comparing the joint angles between the two systems was
not a straightforward task. In Vicon Nexus will take all of the marker data and process it with an internal model.
Basically the internal model will generate positions of limb
segments and then find the angle between these segments, which are reported as joint angles.
0
LANK Y LHEE Y LTOE Y RANK Y
-5
RHEE Y
RTOE Y
120
100
80
-10
-15
60
Frame number 40
Vrankle Drankle Vlankle Dlankle
Fig. 6. Diff erence in mm betw een measurements made by Dartf ish
and Vicon motion systems.
20
5.4 Knee Joint Angles
The right knee angle averages 4.7% difference between the Dartfish and Vicon systems. The left knee angle has an aver- age value of 6.9% for the percentage difference between the angle measurement techniques (Figure 7 ). Differences in the
0
Frame number
Fig. 8. Values f or lef t and right ankle joint angles measured by the tw o systems
For instance using the toe, ankle and heel markers a seg-
IJSER © 2012
http :// www.ijser.org
Inte rnatio nal Jo urnal o f Sc ie ntific & Eng inee ring Re se arc h Vo lume 3, Issue 3, Marc h -2012 5
ISSN 2229-5518
ment location is found for the foot (Fig.9). The tibia, knee and thigh markers are used to create a segment location for the shank and thigh. The ankle angle is then calculated as the angle between the foot segment and the shank segment. On the other hand, in Dartfish the angle is measured from the toe marker, ankle marker and tibia marker, not through the seg- ments.
Toe marker
Heel marker
Ankle marker
5.7 Moment Compariso n s
This is one of the most interesting aspects of this study. Vi- con generates values for joint moments using force plate data when the force plates are active. When the force plates are not active it is claimed that the system uses mathematical equa- tions from Winter (1990). Some interesting points will be ex- plored as it relates to Vicon and its moment values.
In order to calculate moments from Dartfish data a few as-
Fig. 9. Right and lef t ankle angle view ed in Nexus w ith Vicon marker positions and Vicon limb segments
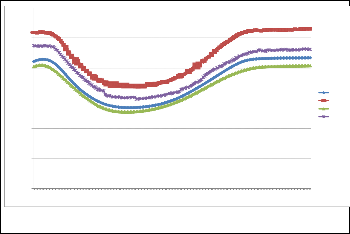
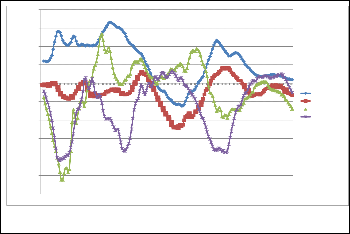
5.6 Ankle and Knee Moments
Figures 10 and 11 deoicts ankle and knee moments respectiv- ley, comparing the two motion capturing systems studied.
35
30
25
20
sumptions were made. The first assumption is that the ground reaction force was applied 4 cm anterior to the ankle joint and did not move. In reality the joint reaction force will move based on the center of gravity of the subject during the motion. The second assumption made was that the reaction force was distributed evenly between the two legs.
In reality this was not the case and weight can shift from side to side to a certain degree which will have change the moments on each leg. Even though the reaction force was split between the two legs evenly, the moments were not equal. They were calculated based on the marker location, accelera- tion, angular acceleration and other data generated with Dart-
15
10
5
0
Frame number
VLAMoment VRAMoment DLAMoment DRAMoment
fish.
In order to calculate the moments about the ends of the segments, the center of mass of the segments must be used. Based on anthropometric tables the center of mass of the shank for example, is 0.433 from the proximal end (Winter
1990).
Fig. 10. Ankle moments measured w ith Vicon and calculated w ith
Matlab
120
100
80
60
Using the Dartfish marker data, equations for the position of the center of masses of the needed segments were devel- oped. Using these equations in conjunction with the angle eq- uations, the subsequent derivations of the position equ ations, values were obtained for ankle and knee moments.
From Figure 12, it can be noted that the moments differ by
as much as 27 N*m in the worst case as exhibited by the left knee moment. The value for the right ankle moment never
40
20
0
-20
Frame number
VLKMoment VRKMoment DLKMoment DRKMoment
differed from the Vicon generated value using force plates by
more than 12 N*m.
It looks as though the equations used from (Winter, 1990) yielded rather good results for ankle moment. The source of variation between these measurements is not in the angle va l- ue (i.e. angular acceleration of the foot) which has a small ef-
Fig. 11. Knee moments measured w ith Vicon and calculated w ith
Matlab
fect on the joint moment. The source of variation is from the
movement of the ground reaction force.
As the ground reaction force moves toward the ankle joint,
IJSER © 2012
http :// www.ijser.org
Inte rnatio nal Jo urnal o f Sc ie ntific & Eng inee ring Re se arc h Vo lume 3, Issue 3, Marc h -2012 6
ISSN 2229-5518
as shown in Figure 13 during the squat the moment arm is reduced, and therefore the ankle moment is reduced. This could be remedied with the use of a floating ground reaction force model based on tracking of the subject center of mass.
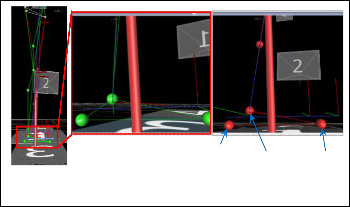
In order to examine the assumption that the ground rea c-
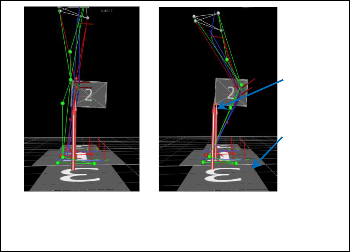
tion force is stationary, change in the ground reaction force with time according to Vicon was examined.
This was done by first looking at the standing subject and the location of the ground reaction force (Fig.13.a). It looks as if the assumption of the ground rea ction force at 4 cm anterior to the ankle joint was spot on . However during the midpoint of the squat, the ground reaction force is in a different location (Fig.13.b). From the figure one can see that the ground rea ction force is located much closer, about 1 cm in front of the ankle joint.
20.00
15.00
10.00
It is likely that Dartfish could generate higher quality va l- ues if the amount of markers tracked is minimized. Only markers that will be used to describe motion should be tracked. Markers could be directly placed on the center of mass locations for the limb segments. This would give direct measurements for center of mass location instead of relying on mathematical methods applied using the difference of two points. Using two tracked points will increase the amount of error associated with marker tracking.
Finally, the overall center of mass of the subject should be tracked. This can be done by tracking the center of mass of the limbs and the head and torso. Anthropometric measurements can be used and programmed so that calculation for estima- tion of the overall center of mass is possible. This way an equ- ation for a floating reaction force could be developed that would be less of an approximation than the currently coded moment equations. This technique may be developed and possibly explored examining more complex movemens.
5.00
0.00
-5.00
-10.00
-15.00
-20.00
-25.00
-30.00
Frame Number
LAnkleMoment RAnkleMoment LKneeMoment RKneeMoment
7 REFERENCES
[1] S.P. Barker, R.L. Craik, W. Freedman, H. Hillstrom, and N. Herrmann, “Accuracy, reliability, and validity of a spatiotemporal gait analysis system,” Medical Engineering and Physics, Vol. 28, no. 5, pp. 460-467, 2009.
[2] Systems Vicon Motion Product Guide-Foundation Notes, http://bdml.stanford.edu/twiki/pub/Haptics/MotionDisplayKAUST/Vic onHardwareReference.pdf. 2009.
[3] R. Wang, W. Leow, and H. Leong, “3D-2D Spatiotemporal Registration for
Fig. 12. Diff erence in N*m betw een moment values generated by
Dartf ish and Vicon motion systems .
Sports MotionAnalysis,” Proc. IEEE Conference on Computer Vision and Pattern
Recognition. June 2008.
[4] D. Winter, Biomechanics and Motor Control of Human Movement, New York : JohnWiley, 1990.
Ground Reaction Force
Kistler
Force plate
(a) (b)
Fig. 13. (a) Location of ground reaction f orce as measured by Vicon standing.(b) Location of the ground reaction f orce during the squat motion, it is closer to the ankle joint.
6 CONCLUSIONS
It was concluded that this method has serious potential. The moment calculations were rather close to the 3D motion capturing system (Vicon) measured values.
There are a lot of estimations involved with the current me-
thod for moment calculation, and in future work some of these estimations should be directly measured. This would be the case with the center of mass.
IJSER © 2012
http :// www.ijser.org