Estimation of a House Price Index in Albania
Artiola Agalliu
Abstract—Prices are the key component of the market economy playing a crucial role on the society as whole. In a pure market economy, this factor represents the equilibrium between the demand and supply, reflecting a variety of characteristics for those markets such as level of competition, market actor’s behavior, the development stage of the economy etc. Among dif- ferent types of prices, starting from price of goods to bonds interest rate, house prices is considered of particular interest by dif- ferent researchers and by the economy as well. This factor represents a key element for the economic situation of a country and also the major component of the consumer wealth. It also is related to many other micro and macro variables such as GDP growth, consumer and saving rates, lending growth rate etc., therefore a change in this factor will impact those variables as well.
This paper main objective is to estimate the house price change in Albania calculating the House Price Index for a de-
fined time period. Conditioned by the available data, the latter is restricted in what is considered the beginning of the “crisis”
period in Albania, starting from the pre-crisis year, namely year 2007, up to year 2012.
The data consist of primary data collected from bank’s external appraisers, using different properties appraisals dis-
tributed within the country. The methodology used for calculating the index is based on the comparison of the price with the reference year. Regarding the house price calculation the average price method is used.
Index Terms— Albanian economy, Appraisal price, Credit risk, Economic indicator, House price, House price index, Mortgage lending.
—————————— ——————————
INTRODUCTION
In the today world there is a price for almost everything. Prices are determining everybody’s life: we use prices in the
daily transactions (buying goods, clothes, services etc.), we constantly hear in different media sources and mass commu- nication channels about prices of goods, prices of commodi- ties, increase of prices etc. Moreover, the cost of our living is measured by a price too, the so-called Consumer Price Index.
Prices are the key component of the market economy play- ing a crucial role on the society as whole. In a free market economy this factor represents the equilibrium between the demand and supply meaning that it is settled at the level where the quantity being supplied is equal to the one being demanded. As such, prices reflect a variety of market charac- teristics such as level of competition, the behavior of the mar- ket actors, the development stage of the economy etc.
Among different types of prices, starting from prices of goods to bonds interest rate, house price is considered of par- ticular interest by different researchers and by the economy as well. This factor represents a key element for the economic situation of a country, being also the major component of the consumer wealth. It also is related to many other micro and macro variables such as GDP growth, consumer and saving rates, lending growth rate etc., therefore a change in this factor will impact those variables as well.
————————————————

Artiola Agalliu is currently pursuing PhD studies in Aleksandër Moisiu University, Faculty of Business, Durrës, Albania. She works in Alpha Bank Albania, Risk Management Department. E-mail: aralimadhi@gmail.com or aagalliu@alpha.gr
Similar to the Consumer Price Index, which is usually one of the main indicators of the economy, high interest should be paid toward the House Price Index (HPI). Unfortunately, this expectation does not resulted to be true, at least during the research on such topic. The official statistics institution of Al- bania, INSTAT, make available to the public regular statistics on (information can be found at www.instat.gov.al):
Consumer Price Index,
Producer Price Index,
Construction Cost Index.
The latter considers, as per respective methodology pub- lished by INSTAT, “the price development of the production factors raw materials, labour, machinery, transports, energy and other costs that are used in the building projects”. Still, this index does not represent the house price development within the country.
Alternative source of information for different economic indicators can be obtained by Bank of Albania, the Central Bank of the country. Consulting different reports and re- searches, it can be found that information on House Price In- dex has been depicted in a dedicated sub-chapter in the Finan- cial Stability Report (published two times a year) and also some informative paragraph in the Monetary Policy Report (published four times a year). Both reports refer to the House Prices Index for Tirana only, being restricted in the city area for the time period 2006 up to the end of 2012.
Considering the above problematic, this paper objective is a moderate attempt to estimate a house price index for the whole country. The data used and methodology applied is described below in the respective sections, followed by the obtained outputs, their analysis and conclusions.
IJSER © 2013
http://www.ijser.org
CHARACTERISTICS OF THE ALBANIAN HOUSE MARKET
House market represents an important element not only for the Albanian economy, but also from the cultural point of view. Albanian families usually consider the proprietorship of a house as one of the primary and initial needs. Unlike to western countries, Albanian new couples have a clear objec- tive in their mind since the first moment they create a family:
“The need to buy their own house in a short or medium term period, getting rid of the house rent as soon as possible”
The house market has been continuously evolving in the free market economy starting in the last decade of the last cen- tury. In the beginning, there was high differentiation among urban and rural area, with not high distinctions among differ- ent regions within the country. Nowadays, the first tendency still remains the same, while the second one has been continu- ously evolved in the opposite direction. Today there are clear- ly higher preferences for houses located in the capital, Tirana, and other industrial or touristic locations such as Durres, Fieri, Vlora, Shkodra, Saranda etc. Indeed, the prices in such re- gions, representing as said above the equilibrium between the demand and supply, are considerably higher compared to other less preferred regions. Furthermore, among most part of the high-income families have a second house in the seaside or touristic locations, apart from the one in the city where they live and work.
In order to satisfy the high demand in these areas, there has been constructed a lot of houses, mainly high-floor buildings from different construction companies, but also private villas or houses from companies and families as well. The construc- tion sector had high expansion in the last decades and alt- hough it has been hit from the last year’s crisis, it still remains one of the key sectors in the country.
Another particular characteristic of the Albanian house market is that the price usually is agreed and exchanged in euro. Turning back to the past, it was a phase in the Albanian economy when initially the house prices were transacted in USD currency, known as the “dollarization” phase of our economy. Later on, after the introduction of the EUR currency, the Eurozone countries became the main trade partners for Albanian economy and the house prices were converted in euro. From that period and on, the houses in the majority of the country have been sold and bought in EUR currency. This does not happen with most of the other goods and services transacted in the market.
Concluding the specific characteristics of the Albanian house market there should be mentioned certain problematic issues which will not be analyzed in details since it will re- quire a separate paper. Some of the issues are included below:
The proprietorship rights not clearly defined between “old” owners deprived from the communist regime and the new ones currently occupying the property,
Legalization issue of the constructed buildings without a proper local authorities permission,
Mortgage registration, mortgage lending and mortgage execution process which are particularly related also with the banking practice and legal framework in the country.
OVERVIEW ON DIFFERENT METHODS USED TO ESTIMATE THE HOUSE PRICE
Before giving an overview of the different methods used to estimate house price, short paragraphs on the need of such statistics and the some difficulties being faces are presented below.
As mentioned above, the house price is an important factor determining the characteristic of the Albanian economy, and the House Price Index is a widely used indicator from differ- ent actors. Such indicators can be harmonized with the Con- sumer Price Index reflecting a broader picture of the economy. The importance of this indicator is highlighted also in the Eu- ropean legislation being partly integrated in the concept of “Harmonized Index of Consumer Prices”. The interconnected effects of this indicator with other economic and/or social in- dicators (macro and/or micro level) raise the need for such statistics as well.
Being driven from the user’s point of view, such indicator is needed, among others, from the below listed users:
Central and local government: The house price index is used as one of the main economic indicators for the country, for fiscal treatment purposes, regional devel- opment issues etc.,
Banks, other financial institutions and real estate agen- cies: The House Price Index is an important indicator while financing mortgage loans and other mortgage- secured loans, settling the financed amount, the inter- est rates, the collateral values etc.,
Households: The house prices are used from house- holds in order to make decision on buying a new prop- erty and/or selling an existing one.
Difficulties faced while assessing the house price There are certain difficulties related to the process of devel- opment and implementation of different methods for House
Price Index. The main reason behind such difficulties is related
with the specific nature of the house characteristics itself and
the house market issues as well. More specifically:
Each house, apartment or villa has its own characteris- tics which distinguishes it from the other ones, like dif- ferent size (the number of rooms may be of high im- portance for the specific situation of a family compared to another one), different locations (sometimes even 10 meters make the difference), different conditions, fea-
tures etc., while this is not the case for the price of “common” goods having unique characteristics among them.
The frequency of house or property transacting is con- siderably lower compared to the other goods transac- tions frequency. This may make the life of a statistician much more difficult due to less data possession.
Evolution of house price, type of houses or volumes transacted varies in time. For the purpose of price comparison or evolution this may present an issue since this should be done using the same or at least similar goods characteristics.
House prices can be widely used for reference purpos- es and they do not represent the exact price of the property. As mentioned, the price for each property varies depending on numerous characteristics. Fur- thermore, most of the methods consider or are driven by the average traded price of the house, being not al- ways right for those which are not yet traded in the market.
House price index is a calculated indicator that tracks changes of the price of a property relative to its price in a reference pe- riod in time. To calculate such indicator, the time series of av- erage house prices in some defined intervals of time (for ex- ample price through years) is used. Changes in time series represent increases of decreases of the house price.
This part reviews four methods used to estimate the House Price Indices, namely Mix-adjustment with Stratification Ma- trix method, Hedonic Regression method, Repeated Sales Measure method and Sale Price Appraisal Ratio method.
ix-adjustment with a Stratification Matrix method The basis of this method is the stratification of the houses, meaning dividing the sample of houses under study in some
groups of similar characteristics, called as strata. The stratifica-
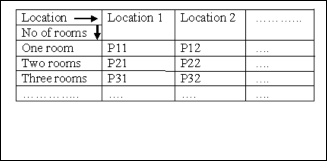
tion can be elaborated into groups and further subgroups, where the characteristics, prices and volumes transacted are expected to be the same or approximate to each other. An ex- ample of the stratification may be a two-level matrix by con- sidering the number of rooms in one dimension and the loca- tion in the other one (schematically presented in the figure 1 below).
Fig. 1. Schematics of a two-dimension’ stratification matrix. The first dimension indicates the number of rooms of the house and the other its location.
It is evident that the average price will vary in each cell of the matrix, avoiding in this way the phenomena of comparing different type of transactions performed in the same time. Sub- indices may be also established while the market House Price Index can be calculated and the average of the sub-indices prices.
Hedonic Regression method
This method consists in using a standard statistical technique, the so-called hedonic regression model, widely used for esti- mating the demand or value and specially used as a pricing method. It decomposes the house price into its constituent characteristics obtaining an estimate of the contributory value of each characteristic. In other words such model measures the weigh or impacts in the total price of certain features of the house, like for example the location of the house, number of bathrooms, the presence of a garden etc. It is clear that those characteristics add value to the property but this value cannot be traded separately, so that can be directly measured. The contribution of each of them in the total price can be measured using the hedonic regression model. The house price can be further calculated by combining different “added values” of different characteristics belonging to the considered house. As a consequence, this can result a very efficient method in defin- ing the price of “unique” houses, meaning those house which have not traded any time during the period. Along with this advantage, the method requires many data and property fea- tures which make it difficult to implement it properly in prac- tice. Consulting the literature, some versions of this method is used by the Spanish Statistical Institute and the German Statis- tical Institute.
Repeat Sales method
As can be understood by the name, this method, initially pro- posed by Bailey, Muth and Nourse in 1963, consists in com- paring the latest price of the house with the previous one, if it is sold more than one time. The difference between the two consecutive selling prices (although they relate to different time intervals) is used to calculate the House Price Index (for the related time interval). It is understandable that this meth- od does not require too many data and properties (such as number of rooms, location, size etc.) since the same house is transacted.
The main disadvantage of the method is that it leaves out
of the sample new houses or “one-time” transacted ones. It is
also difficult to estimate a total House Price Index since indi-
vidual house index may vary on time (for a house it is calcu- lated the 5 year price index while another one may correspond to the 20 years period…and time value make a big difference). This method is used in the United States of America.
ale Price Appraisal Ratio method
This method uses the appraisal values in order to produce the
House Price Index. The appraisers usually consider different aspects of the property characteristics including also location, future developments, environmental or tax issues etc. The in- dex is calculated by comparing the selling price with the ap- praisal value per square meter, using the latter as a reference point. A general formula is given below:
which should be carefully completed:
The price per square meter (input). In the template the price is an input to be filled in euro using the respective end of year exchange rate (in case there are some ap- praisals in Albania currency, called LEK),
The surface of the house (input),
The house valuation (calculation: 1*2).
An instruction sheet and an explanatory email were also delivered indicating the procedure to be followed:
Pr iceIndex =

Selling Appraisal
price value
(1)
The information should be based on the appraiser’s best knowledge and experience referring to the period
Quantitative or qualitative aspects should be considered in case of property feature’s changing during the period from the appraisal to the selling finalization. This method has been used in the 1960s in New Zealand and later adopted in Swe- den, Netherlands and Denmark.
ESTIMATION OF A HOUSE PRICE INDEX IN ALBANIA
While trying to estimate the House Price Index for Albania, firstly it should be noted the missing of publically available statistics on this area. There are not available, as mentioned above, any methodology or statistics by INSTAT and also the number or volumes being transacted cannot be found. It is understandable that further stratification by different charac- teristics is not available.
Considering this situation, such efforts may succeed only by collecting information directly from the market. In fact, this paper consists of primary data collected through a basic tem- plate distributed to different bank appraisers within the coun- try. The time period being focused is a five year period 2007- 2012, starting from the pre-crisis year of the house prices up to the last year.
| | |
Kucove Distribution by regions 1% Lushnje Korce 3% Fier 4% 7%
Devoll Diber 1% 3% Berat 6% Vlore Tirana 13% 51%
Tepelene 1% Sarande Gjirokast P1e%rmetKukes Diber er 1% 2% 3% 3% |
Fig. 2. Distribution of sample received by regions. |
|
Reasoning, development and delivery of the template The house price and house evaluations are widely used from the Albanian banks for the purpose of crediting the economy
(mortgage loans or mortgage-secured loans). The external ap-
praisers are active actors in such area providing a professional service to the banks within the whole country. As a conse- quence, it is decided to estimate the house price by distrib- uting the template to different banks external appraisers.
A total number of 100 houses have been decided to be con-
sidered in the study. The distribution of this sample among different regions has been based on the weight of the popula- tion of each region to the country population (using the 2001 statistics published by INSTAT). Tirana region has the main share, 36 cases out of 100.
The designed template has been delivered to different ap- praiser’s indicating the number of houses corresponding to each region. The template includes the below information
2007 – 2012. Subject to the evaluation are residential
mortgages (houses) which should be selected in differ-
ent area of the region (in case when more than one
house should be appraised).
In order to be more objective in the appraisers, for each
required house there should be followed the below
steps:
Firstly, a specific property being appraised in these years should be selected,
Secondly, the appraisers were asked to make and ap- praisal of the same property for the remaining years of the defined period.
For the appraisal for the remaining years there should be used the average prices during each year. In case they have noticed significant differences (the prices have fluctuated significantly within the year) the ap- praisers will note it specifically.
Average house price and House Price Index calculation
013
er.org
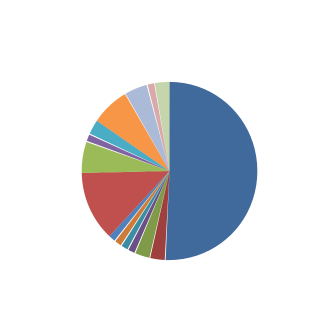
Following different attempts, from the total sample of 100 houses, there were collected back only 71 templates completed by the appraisers. Finally, these responses were used to esti- mate the paper results on house price. The number of apprais- als per regions and the final weight (calculated on the deliv- ered sample) are presented by the chart in Figure 2:
TABLE 1
Year_Albania | 2007 | 2008 | 2009 | 2010 | 2011 | 2012 |
Price* | 666.76 | 688.81 | 686.6 | 684.46 | 671.1 | 653.45 |
Change** | - | 3.31% | -0.3% | -0.31% | -1.95% | -2.63% |
ALBANIA AVERAGE HOUSE PRICE BY YEAR
The average house price for each year is calculated as the average of the delivered sample in that year. No significant prices fluctuations within the year were reported. Apart from Tirana, average price by regions cannot be retrieved since few numbers of sub-categories can be obtained.
The calculation of the House Price Index is done using a slightly simplified version of the fourth method described above, the Sale price Appraisal Ratio method. Practically, the yearly indices have been calculated using the 2007 appraisal value per square meter as a reference period (2007 = 100), put- ting the ratio of the respective value to the reference period. For example, the 2012 House Price Index is calculated using the below formula:
Source: Author calculation
*Average price expressed in euro
**Yearly change expressed in percentage.
The results (in EUR currency) and year-to year changes (in percentages) are presented in the Table 1 below:
TABLE 2
Year_Tirana | 2007 | 2008 | 2009 | 2010 | 2011 | 2012 |
Price* | 927.64 | 954.58 | 939.86 | 925.97 | 895.83 | 866.67 |
Change** | - | 2.90% | -1.54% | -1.5% | -3.25% | -3.26% |
TIRANA REGIOS AVERAGE HOUSE PRICE BY YEAR
House Pr iceIndex _ 2012 =
Appraisal Value _ 2012

Appraisal Value _ 2007
Source: Author calculation
*Average price expressed in euro
The deviation from the cited method consists in using the
appraisal value and not the selling price in the latter period.
The difference should not be significant since the appraiser’s
value include different market information such as similar
property selling prices, property initial characteristics and po- tential changes (there are not high expectations that the selling price may differ significantly from the market price used in the appraiser reports).
Limitation of the methodology
There are different limitation of the methodology, data pro- cessed and the produced results in this paper. Some of them are listed below:
Limited number of sample: Finally, only 71 templates were delivered back from the appraisers.
Urban area coverage: The sample used corresponds to the urban area only. This is due to the fact that the bank appraisers were selected to collaborate with, as a consequence being focused in the urban area since it is the only area were banks are active in crediting.
Only based on appraisal value: There is a deviation from the methodology by using only the appraisal value since no information on possible selling price is available.
No stratification: Considering the difficulty in apply- ing the more sophisticated methods due to many data required as well as the higher risk of non-response if more data were requested, this paper was limited to the house prices in the whole country.
The outcome of the house price estimation methodology
Considering the completed and delivered template and the abovementioned methodology, there have been calculated the average house price for Albania during the period 2007 – 2012.
**Yearly change expressed in percentage.
The average prices for Tirana region and year-to year changes are presented in the Table 2 showed below:
Analyzing the results, it is noted the “peak” year is reached in year 2008, corresponding to the higher average house price for the country and Tirana specifically. This is a result also from the very high demand and the credit boom happening before this period. It also reflects a delayed effect of the finan- cial crisis in the country, considering that 2008 has been cited as the starting year of the crisis in Europe.
Analyzing the yearly changes, it is noted that after 2008 those indicators have constantly increased. In other words, the decreasing trend has been increased in the following years. This trend is more evident in Tirana compared to the whole country, mainly related with the higher transactions, not only banking ones, being concentrated in the capital. More specifi-
TABLE 3
HOUSE PRICE INDEX (HPI) FOR ALBANIA AND TIRANA BY YEAR
Year_Tirana | 2007 | 2008 | 2009 | 2010 | 2011 | 2012 |
Price_Alb.* | 666.76 | 688.81 | 686.57 | 684.46 | 671.08 | 653.45 |
HPI_Alb* | 100% | 103% | 103% | 103% | 101% | 98% |
Price_TR** | 927.64 | 954.58 | 939.86 | 925.97 | 895.83 | 866.67 |
HPI_TR** | 100% | 103% | 101% | 100% | 97% | 93% |
Source: Author calculation
*Abbreviation for Albania
**Abbreviation for Tirana
cally, during 2012, the average house price has declined with 2.63% in the country and 3.26% in Tirana.
The House Price Index for whole country and for Tirana is presented in the Table 3 depicted below (2007 = 100):
ing with Alpha Bank Albania which completed the template used to estimate the House Price Index in Albania.
The 98% indicator for the country for the year 2012 means that the ratio of 2012 average price to the reference period (year 2007) is 98%, showing a lower level. If the index would have been calculated using the “peak” year as a reference pe- riod (meaning year 2008), the House Price Index would have decreased to 94.87%. The deepening of the decreasing trend in Tirana compared to the whole country can be retrieved by the analysis of the House Price Index too.
CONCLUSIONS
House prices and house price index can be considered as high- ly important micro and macro indicator in economics. Such indicator is even more important considering the specific eco- nomic and social factors in Albania. The time series of this index, based on best practices, is needed to be calculated from a competent institution in the country and then to be publical- ly available to different market actors. As mentioned, up to now no such time series is published, except the one from Bank of Albania including only Tirana city data. The whole country House Price Index and further stratification need to be calculated.
This paper may be considered as an effort to estimate the House Price Index in Albania during the period 2007 -2012, using a simplified version of the Sale Price Appraisal Ratio method applied in a sample of 71 properties being evaluated by the bank’s external appraisers.
Analyzing the outcome, it is noted the “peak” year is reached in year 2008, corresponding to the higher average house price for the whole country and Tirana specifically. This is a result also from the very high demand and the credit boom happening before this period. It also reflects a delayed effect of the financial crisis in the country, considering that years 2007-2008 have been cited as the starting years of the crisis in Europe. Analyzing the yearly changes, it is noted that after 2008 the decreasing trend has constantly increased, meaning that the prices later on have decreased continuously. The same result can be retrieved analyzing the calculated house price index too. The decreasing trend is higher in Tirana region compared to the whole country, reflecting the higher numbers as well as high concentration of transacted volumes in the capital.
Further studies on more detailed stratification based on lo- cation, different properties characteristics, reviewing the sale price and other factors may be elaborated in the future.
ACKNOWLEDGMENT
The author wishes to thank the external appraisers collaborat-
REFERENCES
[1] Bank of Albania, “Financial Stability Report – 2012 H2” available at http://www.bankofalbania.org/web/Financial_Stability_Report_34 33_2.php?kc=0,22,16,0,0
[2] Bank of Albania, “Monetary Policy Report 2012 Q3” available at http://www.bankofalbania.org/web/MPR_2012_6600_2.php
[3] H. Guidimeda, “Hedonic Pricing Method - A Concept Note” Centre of Excellence in Environmental Economics, Madras School of Economics.
[4] M.J. Bailey, R.F. Muth, H.O. Nourse “A Regression Method for Real Estate
Price Index Construction” Journal of the American Statistical Association, 58, 993- 942, 1963
[5] Office for National Statistics, “Official House price Statistics ex- plained”, 2013.
[6] Official Journal of the European Union, Commission Regulation, No.
93/2013
[7] P. Vries, J. Haan, G. Mariën. and E. Van der Wal, “A House Price Index Based on the SPAR Method”, The Cambridge – UNC Charlotte, Sym- posium on Real Estate Risk Management, 16-17 June 2007, Lisbon Portugal.
[8] S.C. Bourassa, Martin Hoesli, Jian Sun, “A simple alternative House Price Index method”, Journal of Housing Economics 15, pp.80-97, 2006.
[9] Website of Bank of Albania: www.bankofalbania.org
[10] Website of Institute of Statistics of Republic of Albania: www.instat.gov.al
[11] Website of Office for National Statistics (United Kingdom):
http://www.ons.gov.uk