International Journal of Scientific & Engineering Research Volume 3, Issue 7, June-2012 1
ISSN 2229-5518
Estimation of Wastes Generated from Obsolete
Personal Computers in India
Pamela Chawla, Neelu Jain
Abstract: - The objective of this paper is to characterize future trends in obsolete computer generation in India in the next fifteen yea rs using logistic model based approach. The amount of various toxic and non-toxic components generated from these computers as well as precious metals recoverable from the obsolete computers by 2025 is also estimated. In this model, the historical sales data and an assumed f irst lifespan distribution of desktop and laptop computers are used to estimate future computer penetration rate and subsequently obsolete PCs to be generated in India . The estimation carried out in this study will serve as a guideline for government & planning bodies to setup collection, recycling and disposal facilities for the different types of toxic and non-toxic waste generated from obsolete computers in the next 15 years. This would also help regulatory authorities in formulatin g policies to mitigate impacts of informal recycling.
Index Terms: - End-of-life computers, First life span, Penetration rate, Toxic waste, Hazardous waste, Obsolete computers, Recycling
content of precious metals and high demand for used machines in developing countries like India, obsolete PCs are
Electronic waste or e-waste is the collective name for discarded electronic devices that enter the waste stream from various sources. E-waste includes household electronic appliances, toys, electrical and electronic tools, medical devices, mobile phones, monitoring and control instruments, automatic dispensers, information telecomunication and telecom equipment and consumer electronic items. Because of huge population and the changing consumption patterns, India is generating huge volumes of e-waste, which moves into the informal waste trade and recycling processes. The recycling of e-waste is proving to be a highly lucrative business as valuable metals like gold, silver, copper and lead are recovered from this waste. Apart from these, e-waste contains significant concentration of substances that are highly toxic and are hazardous to human health and the environment. Management of e-waste has become critical issue for almost all major cities in India. According to the latest annual report of the Union Ministry of Environment and Forest (MoEF), by the end of 2012, India would have generated a whopping eight lakh tones of e-waste which is up eight times in the past seven years. Environmentalists point out that an additional 50,000 tonnes is imported from developed countries despite a ban,as in [1].
Computer waste is the most significant of all the e-waste categories owing to the large volume generated and the fast rate at which it is generated. This can be attributed to a number of factors. The rapid growth of technology has led to reduction in lifespan of PC/Desktop as it is more economical and convenient to buy a new PC vis-à-vis its upgradation. Computers that cannot be upgraded increasingly become waste, of which a part is recycled and a large proportion ends up in landfills.
A personal computer contains different types of elements,
including valuable components (gold, silver, platinum, etc.) as well as hazardous materials (cadmium, mercury, lead, brominated flame-retardants, plastics etc.). Due to high
attractive to informal recyclers. The recycling of computers in an environmentally sound manner requires sophisticated technology and processes, which are not only very expensive, but also need specific skills and training for the operation. Most of the recyclers currently engaged in recycling activities do not have this expensive technology to handle the waste. When computer waste is landfilled or incinerated, it poses significant contamination problems. Landfills leach toxins into groundwater and incinerators emit dioxins which are toxic air pollutants. Even with all toxics removed recycling will cause impacts due to emissions while extracting valuable materials [2].
The objective of this study is to characterize long-term
trends in generation of obsolete computers in India as it will provide a roadmap to both government and private setups in developing an appropriate formal recycling infrastructure. We estimate the volume of obsolete PCs mainly desktops and notebooks and quantities of the toxic and non-toxic components likely to be generated from them.
Table 1 & Table 2 give the composition of desktop and
notebook PCs respectively in terms of toxic and non-toxic components/metals recoverable from an obsolete personal computer.
The objective of this paper is to estimate long term future trends of various hazardous and non-hazardous components generated from computer waste in India. For this purpose logistic function based model proposed by Yang and Williams [3], [4] has been used. This model uses data on historical stock and historical sales to forecast PC sales and generation of obsolete PCs over next fifteen years.
The logistic function growth curve displays an S-shaped
behavior and has been found to empirically describe
IJSER © 2012 http://www.ijser.org
International Journal of Scientific & Engineering Research Volume 3, Issue 7, June-2012 2
ISSN 2229-5518
technology diffusion processes like computer adoption or penetration rate and at the same time display their typical
phases of growth, inflection and saturation. Frank [5] used the logistic model to forecast diffusion in wireless communication in Finland. Research papers by [3], [4], [6], [7] address and translate this technology diffusion into WEEE prediction. Combining the logistic model with material flow analysis(MFA)
TABLE 1
COMPOSITION OF DESKTOP COMPUTERS
(Average weight: 27.2 kg) | ||
Toxic Components | ||
Description | Content %age of total weight | Weight of material |
Plastic | 22.99 % | 7.24 kg |
Lead | 6.2988 % | 1.98 kg |
Mercury | 0.022 % | 0.693 gm. |
Arsenic | 0.0013 % | 0.4095g m. |
Cadmium | 0.0094% | 2.961 gm. |
Chromium | 0.0063 % | 1.98 gm. |
Barium | 0.0315% | 9.92 gm. |
Beryllium | 0.0157% | 4.92 gm. |
Non-toxic Components | ||
Aluminum | 14.1723 | 3.86 kg. |
Iron | 20.4712 | 5.58 kg. |
Copper | 6.9287 | 1.91 kg. |
Gold | 0.0016 | <0.1 kg. |
Silver | 0.0189 | <0.1 kg. |
Source: http://svtc.igc.org/hightech_prod/desktop.html
TABLE 2
COMPOSITION OF NOTEBOOK COMPUTERS
![]()
(Average weight 2.85 Kg.)
adoption rate which is constant for a logistic model, K
represents the carrying capacity or average number of PCs a
person is likely to posses. The rate of adoption ‘r’ is a constant
for logistic model.
The solution of (1) at time t is given as
Nt= K/ [1+e-(rt+c)] (2)
At time t=0, initial penetration rate is denoted by N0.
N0= K/ 1+ e-c (3)
... c =ln(N0/K-N0) (4)
Yang and Williams [4] proposed the bounding approach to determine the maximum and minimum possible values of K should be worked out from statistical fits of historical time- series penetration rates, but for case of PCs this data set is yet in initial stages. In the context of India also, the approach proposed by [4] in which instead of using historical computer penetration rate data, a time-series of computer penetration rates are recreated based on estimates of stock, historical sales and assumptions on lifespan.
A lifespan is defined as the time between initial purchase of
a computer and the time it is ready for End of Life (EoL) management. It generally includes three stages: First usage, storage and possible second usage. EoL disposition options are recycling, incineration and depositing into a landfill. Since the storage time-span for a computer before next use stage varies a lot from case to case [8]), the approach given by [9] using initial lifetime or first span lifespan of computer is used for our study. Some researches assume an average 3 year use of new computers for both business users and home users [10] whereas some other studies assume a 4 year use [11]. Accuracy of any computer waste forecasting model depends on accuracy of lifespan estimation [12]. Instead of using a uniform lifespan [13] have proposed multiple lifespan for estimation of obsolete PCs. In our study, the assumed lifespan
Description Content %age of total weight
![]()
![]()
Toxic Components
Weightof material (kg)
probability distributions are shown in Table 3.
TABLE 3
Glass 134.4 0.382
PCB 15.8 0.450
ASSUMED LIFE SPAN DISTRIBUTION OF COMPUTERS.
Battery/Transformer/ Capacitors
9.58 0.273
![]()
![]()
Average life span
Years in use
Plastic parts 26.66 0.760
![]()
![]()
Non-Toxic Component
![]()
Upper line
in years 5 4 3 2
Metals 34.49 0.983
![]()
Source: AEA Technology (WEEE & Hazardous waste Part 2) for
DEFRA.
enables estimation of discarded / obsolete devices [4].
The general logistic equation for computer penetration rate which has been modeled by [3], [4] is expressed in conventional logistic form as:
dN/dt = r N(1-N/K) (1)
where N represents number of computers owned per capita
(penetration rate of PCs), r is the intrinsic growth rate or
Desktop 4 25% 50% 25% Notebook 3.5 20% 20% 50% 10% Base line
![]()
Desktop | 3.5 | 20% | 20% | 50% | 10% |
Notebook | 3.0 | 20% | 50% | 30% | |
Lower line |
![]()
Desktop 3.0 25% 50% 25% Notebook 2.5 50% 50%
![]()
Due to lack of data in used computer market, reused computers are not included in this study.
IJSER © 2012 http://www.ijser.org
International Journal of Scientific & Engineering Research Volume 3, Issue 7, June-2012 3
ISSN 2229-5518
The procedure followed was to assume a lifespan distribution Lj where ‘j’ represents the year after which the
computer becomes obsolete and using the historical sales Si we estimate the annual obsolete quantities (Oi) for a given year ‘i’ from the expression:
Oi=∑ *Sales in the year (i-j)*Percentage of computers
that become obsolete after ‘j’ years+
=∑Si-jLj (5)
Assuming that computers enter the national stock after being purchased, we estimate the possession amount or stocks in use (Sti) in year ‘i’ is estimated as:
Sti = Stocks in use in year (i -1)+ Sales in year i’-
Obsolete stock in year i’
=Sti-1 + Si-Oi (6)
The penetration rate Ni in year ‘i’ is computed from the
infancy hence penetration rate was unavailable. Fig.1 and
Fig. 2, shows these plots.
For this study, value of lower bound carrying capacity is assumed as 0.0336 and upper bound carrying capacity estimation to be of 1.027 computers per capita [16]. A lower bound on carrying capacity is set by assuming that in commercial sector all IT employees’ posses a computer at their workplace and from domestic sector it is assumed that all wealthy Indians families posses a computer. For the upper bound parameter estimation it is assumed that all employed persons own a computer at work and every person aged 15 to
64 years has a computer at home. Table 4 gives estimated
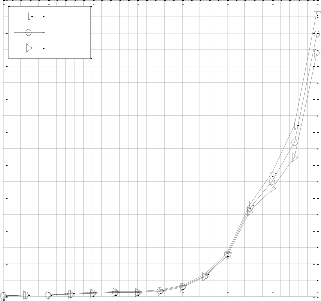
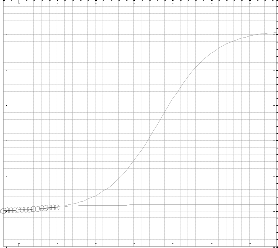
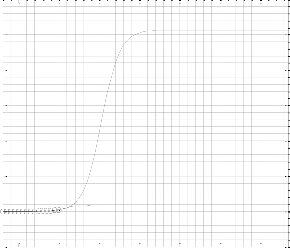
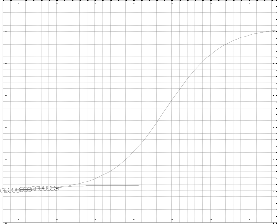
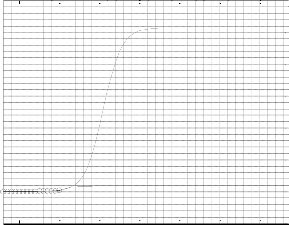
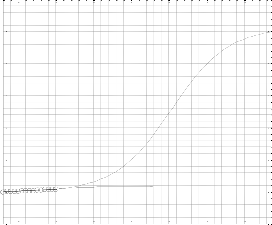
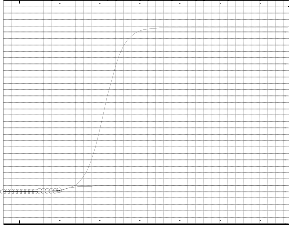
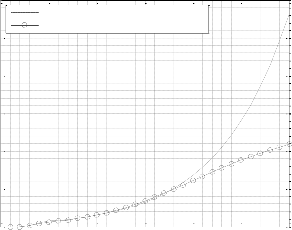
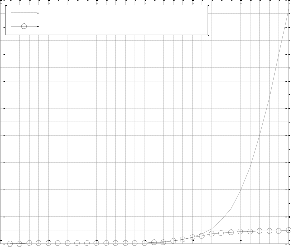
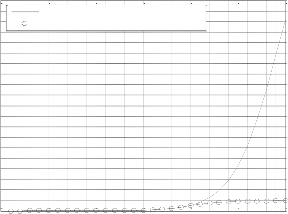
computer penetration rate in year 2025. Fig. 3 to Fig. 8 give plots of forecasted penetration rates for desktop and notebook computers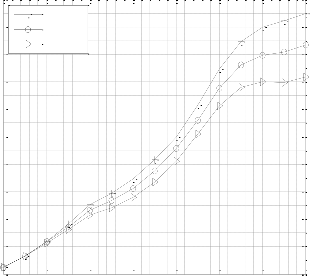
0.02
upper line
relationship:
Ni = Sti/ Qi (7)
where Qi is the population in year ‘i’.
Statistical fits are performed on the generated time-series historical penetration rate in order to identify the parameter values r and N0 of the logistic model. The approach here was to separately identify these parameters for both the upper and lower bound carrying capacity.
The computer penetration rates from the logistic curve are translated to their corresponding sales using (7). The forecasted sales figures of notebook and desktops coupled
0.018
0.016
0.014
0.012
0.01
0.008
0.006
base line lower line
with their respective first lifespan distribution are utilized to generate forecasted obsolete numbers of computers and subsequently the weight to each toxic component and metals etc to be generated.
The present study has been done using actual population data of India for years 2001 and 2011 given by Census of India 2001
& 2011 survey and projected population data from Census of India 2011[14]. Historical sales data of desktop and notebook computers for India are from the annual report of MAIT (Manufacturing Association of IT) [15].
Our analysis gives desktop penetration rate for year 2006 to
be 0.012, 0.013, 0.015 for lower line, base line and upper line respectively. The assumptions of first lifespan distribution used to calculate computer penetration rate in years 1996 to
2010 are corroborated by report by [16], according to which
penetration rate of computers is 0.012 in year 2006. This
empirical data is same for lower line case of our study. For baseline and upper line case the reasons for higher values of penetration rate could be due to unavailability of sales data before 1996 as market for personal computers was in its
0.004
0.002
0
1996 1998 2000 2002 2004 2006 2008 2010
Year
Fig. 1 Historical Desktop Penetration Rate
IJSER © 2012 http://www.ijser.org
International Journal of Scientific & Engineering Research Volume 3, Issue 7, June-2012 4
ISSN 2229-5518
-3
x 10
9
8
7
upper line base line lower line
6
5
4
3
2
1
0
1996 1998 2000 2002 2004 2006 2008 2010
Year
Fig. 2 Historical Notebook Penetration Rate
For the case of lower line, the estimated desktop penetration rate in the year 2025 will be 0.04 & 0.12 per capita for lower bound & upper bound cases respectively & the estimated notebook penetration rate in year 2025 will be 0.04
& 0.86 for lower bound and upper bound cases respectively.
IJSER © 2012 http://www.ijser.org
International Journal of Scientific & Engineering Research Volume 3, Issue 7, June-2012 5
ISSN 2229-5518
desktop-upperline peneteration rate
1
notebook-upperline peneteration rate
1
0.8
0.6
0.4
0.2
0
-0.2
0.8
0.6
0.4
0.2
0
-0.2
Fig. 3 Desktop Upper Line Penetration Rate Forecast
desktop-baseline peneteration rate
1
Fig. 6 Notebook Upper Line Penetration Rate Forecast
notebook-baseline peneteration rate
1
0.8
0.6
0.4
0.2
0
-0.2
0.8
0.6
0.4
0.2
0
-0.2
Fig. 4 Desktop Baseline Penetration Rate Forecast
desktop-lowerline peneteration rate
1
Fig. 7 Notebook Baseline Penetration Rate Forecast
notebook-lowerline peneteration rate
1
0.8
0.6
0.4
0.2
0
-0.2
0.8
0.6
0.4
0.2
0
-0.2
Fig. 5 Desktop Lower line Penetration Rate Forecast
IJSER © 2012 http://www.ijser.org
Fig. 8 Notebook Lower Line Penetration Rate Forecast
International Journal of Scientific & Engineering Research Volume 3, Issue 7, June-2012 6
ISSN 2229-5518
IJSER lb) 2012
htt p://www .'lser.ora
International Journal of Scientific & Engineering Research Volume 3, Issue 7, June-2012 7
ISSN 2229-5518
TABLE 4
ESTIMATED COMPUTER PENETRATION RATE![]()
(YEAR 2025)![]()
Desktop Notebook
TABLE 5
ESTIMATED VOLUME OF OBSOLETE DESKTOP AND
NOTEBOOK COMPUTERS (YEAR 2025) IN MILLIONS![]()
Upper
Lower
Upper
Lower
![]()
Upper bound (K=1.027) Lower bound (K=0.0336)
bound
bound
bound
bound
Lifespan Desktop
Notebook
Desktop Notebook
Upper line 0.16 0.04 0.90 0.04
(million)
(million)
Baseline 0.14 0.04 0.88 0.04
![]()
Lower line 0.12 0.04 0.86 0.04
Upper line 138 860 45 50
Baseline 126 900 44 50
Lower line 112 920 43 50
![]()
TABLE 6
ESTIMATES OF TOXIC AND NON-TOXIC MATERIAL GENERATED FROM OBSOLETE DESKTOP COMPUTERS.![]()
Upper line (Metric Tonnes) Baseline (Metric Tonnes) Lower line (Metric Tonnes)
Toxics/ Year 2015 2020 2025 2015 2020 2025 2015 2020 2025
Plastic 223 481 1006 212 448 922 196 405 816
Lead 61 131 275 58 122 252 53 110 223
Mercury 0.021 0.046 0.096 0.020 0.040 0.088 0.018 0.038 0.078
Arsenic 0.012 0.027 0.056 0.012 0.025 0.052 0.011 0.022 0.046
Cadmium 0.091 0.196 0.411 0.086 0.183 0.377 0.080 0.165 0.333
Chromium 0.061 0.131 0.275 0.058 0.122 0.252 0.053 0.110 0.223
Barium 0.305 0.659 1.379 0.290 0.614 1 0.269 0.555 1.118
Beryllium 0.151 0.326 0.684 0.144 0.304 0.627 0.133 0.275 0.554
![]()
Non Toxic
![]()
Aluminum 118 256 536 113 239 491 104 216 435
Iron 171 370 775 163 345 711 151 312 629
Copper 58.8 126 265 55 118 243 518 106 215. Gold 0.011 0.025 0.052 0.011 0.023 0.048 0.010 0.021 0.042
![]()
Silver 0.135 0.292 0.611 0.128 0.272 0.560 0.119 0.246 0.496
TABLE 7
ESTIMATES OF TOXIC AND NON-TOXIC MATERIAL GENERATED FROM OBSOLETE NOTEBOOK COMPUTERS![]()
![]()
Upper line (Metric Tonnes) Baseline (Metric Tonnes) Lower line (Metric Tonnes) Toxics/Year 2015 2020 2025 2015 2020 2025 2015 2020 2025
Glass 8.46 73.75 329.94 2.76 5.94 12.6 10.4 85 354E+03
PCB 9.96 86.89 388.67 3.25 6.99 14.9 12.2 100 417 E+03
Battery/Transformer/Capacitor 6.04 52.70 235.79 1.97 4.24 9.02 7.42 60.7 253 E+03
![]()
Plastic parts 16.8 146.72 656.42 5.49 11.8 25.1 20.6 169 704 E+03
![]()
Non Toxic
![]()
Metal 21 189 849 7.11 15.3 32.5 26.7 219 911E+03
Long term equilibrium on penetration rate can be achieved sometime in year 2044 i.e from 32 years from now giving a
penetration rate of 1.0269. Yu. et al. [6] have also reported that Asia pacific region will reach a long-term equilibrium in penetration rate in 30-60 years, which is confirmed by our results. The eleventh Five year plan (2007-2012) report prepared by Department of Information Technology, Government of India cites a penetration rate of 0.0325 computers per capita which is very close to the value predicted by our analysis of 0.0244 computers per capita.
Our results summarized in Table 4 & Table 5 estimate that obsolete desktop generation at end of 2025 to be 44 million
units for lower bound and 126 million units for upper bound values of carrying capacity. Obsolete notebook computers generation at the end of 2025 is estimated to be 50 million units for lower bound and 900 million units for upper bound values of carrying capacity. Fig. 9 to Fig. 14 show plots for above results.
Table 6 & Table 7 estimate the weight (in metric tonnes) of
various toxic and non-toxic materials generated from the
IJSER © 2012 http://www.ijser.org
International Journal of Scientific & Engineering Research Vo lume 3, Issue 7, June-2012 8
ISSN 2229-5518
obsolete computers. Results indicate that the amount of waste material generated is increasing at an alarming rate i.e. doubles every five years for desktop PCs, whereas for notebook PCs, the increase is eightfold.
IJSER lb)2012
htt p://www .'lser.ora
International Journal of Scientific & Engineering Research Volume 3, Issue 7, June-2012 9
ISSN 2229-5518
7
x 10

14
Projected Obsolete Quantity
7
x 10
12
Projected Obsolete Quantity
Estimated obsolete quantity (Upper bound) Estimated obsolete quantity (Lower bound)
12
Estimated obsolete quantity (Upper bound) Estimated obsolete quantity (Lower bound)
10
10 8
8
6
6
4
4
2
2
0
1995 2000 2005 2010 2015 2020 2025
year
0
1995 2000 2005 2010 2015 2020 2025
year
Fig. 11 Desktop Projected obsolete Volume (Lower Line)
8
Fig. 9 Desktop Projected obsolete Volume (Upper Line)
x 10
9
Projected Obsolete Quantity
7
x 10

14
Projected Obsolete Quantity
Estimated obsolete quantity (Upper bound)
8 Estimated obsolete quantity (Lower bound)
Estimated obsolete quantity (Upper bound) 7
Estimated obsolete quantity (Lower bound)
12
6
10 5
8 4
6 3
4 2
2 1
0
1995 2000 2005 2010 2015 2020 2025
year
Fig. 10 Desktop Projected obsolete Volume (Base line)
0
1995 2000 2005 2010 2015 2020 2025
year
Fig. 12 Notebook Projected obsolete Volume (Upper Line)
8
x 10
10
Projected Obsolete Quantity
Estimated obsolete quantity (Upper bound)
9 Estimated obsolete quantity (Lower bound)
8
7
6
5
4
3
2
1
0
1995 2000 2005 2010 2015 2020 2025
year
Fig.13 Notebook Projected obsolete Volume (BaseLine)
IJSER © 2012 http://www.ijser.org
International Journal of Scientific & Engineering Research Volume 3, Issue 7, June-2012 10
ISSN 2229-5518
8
x 10

10
Projected Obsolete Quantity
[3] Y.Yang, E.Williams, ‚Forecasting sales and generation of obsolete computers in the US‛. Proceedings of IEEE Symposium on Electronics and the Environment. 2008.
Estimated obsolete quantity (Upper bound)
9 Estimated obsolete quantity (Lower bound)
8
7
6
5
4
3
2
1
0
1995 2000 2005 2010 2015 2020 2025
year
Fig. 14 Notebook Projected obsolete Volume (Lower Line)
This paper presents an approach to estimate the number of obsolete desktop and notebook computers and the amount of various toxic and non-toxic components generated from these computers in India. The results of the study indicate that the obsolete PCs will continue to increase exponentially with time on account to large population trend in India, better social- economic conditions and increased technology awareness in both rural and urban India. With favorable government policies, it may take 30 years more to achieve a penetration rate of 1 computer per capita.
Management of e-waste is a global concern and has to be tackled by using a holistic approach. Effective collection and recycling programs have to be developed once the necessary legal and regulatory instruments are in place. The estimation carried out in this study will serve as a guideline to government authorizes to setup collection, recycling and disposal facilities for the different types of toxic waste and also the recoverable metals or non-toxic waste generated from these obsolete computers in the coming 15 years.
These are preliminary results and within the context of our
modeling framework. Our analysis covers only first life of computers. The period for which computers are stored in reuse and recycling systems affects their handling, this needs to be considered in future work.
[1] B.Viju, ‚India’s e-waste output jumps 8 times in 7 years,‛ Times of India, April 4, 2012.
[2] E.Williams, R. Kahhat, B. Allenby, E. Kavazanjian, J. Kim, M. Xu,
‚Environmental, social and economic implications of global reuse and recycling of personal computers,‛ Environ. Sci. Technol., 42 (17), pp. 6446– 6454. 2008.
[4] Y.Yang, E. Williams, ‚Logistic model-based forecast of sales and generation of obsolete computers in the U.S,‛ Technol. Forecast. Soc. Change. 2009, 79 (8), pp. 1105– 1114, 2009.
[5] L.Frank, ‚An analysis of the effect of the economic situation on
modeling and forecasting the diffusion of wireless communication in Finland,‛ Technol, Forecast Soc. Change, 71, pp.
391-403, 2004.
[6] Jinglei Yu, E. William, M.Ju, Y.Yang., ‚Forecasting global generation of obsolete personal computers,‛ Environmental Science & Technology Vol. 2010, 44, pp. 3233-3237. 2010.
[7] X.Liu, M. Tanka, Y. Matsui, ‚Generation amount prediction and material flow analysis of electronic waste: a case study in Beijing, China. Waste Management and research 24, pp. 434-445. 2006.
[8] H.Scott Mathew, H. Deanna, Mathews, ‚Information Technology
Products and the Environment,‛ in Kuchr, R and Williams E. Eds
2003 Computes and Environment Dordrecht, the Netherland. Kluwer
Academic Publishers, pp.41-72, 2003.
[9] H.Scott Mathew, C. Francis McMichael, T. Chris Hendrickson,
‚Disposition and end-of-life options for personal computers,‛ Green design initiatives technical report, Carnegic Mellon University, pp. 97-100. July 7, 1999.
[10] E.Williams, ‚Energy Intensity of computer manufacturing hybrid assessment combining process and economic input-output methods,‛ Environmental Science technology, 38, pp.6166-6174,
2004.
[11] E.Williams, ‚Residential computer usage patterns, reuse and lifecycle energy consumption‛ in Japan 2005.
[12] N.G.Leigh, M.Realff, N.Ai, S. French, C.Ross, B.Bras. ‚Modeling
obsolete computer stock under regional data constraints: An
Atlanta case study,‛ Resources, Conservation & recycling (51), 847-
869. 2007.
[13] H.Y.Kang, J.M.Schoenung, ‚Estimation of future outflows and infrastructure needed to recycle personal computer systems in California‛. Journal of Hazardous Materials 137, pp. 1165–1174,
2006,.
[14] Census of India. 2001, 2011. www.censusindia.gov.in/2011- common/CensusDataSummary.html
[15] MAIT, 2005–10. India IT industry performance annual reviews. http://www.mait.com/industry-statistics.php
[16] M Dwivedi, R.K Mittal, ‚Future trends in computer waste generation in India,‛ Waste Management 30(2010), pp. 2265-2277.
2010.
![]()
![]() Pamela Chawla is currently pursuing her Ph.D.in Electronics Engineering. She is working as Associate Professor in Electronics & Communication Engg. at Baddi University of Emerging Sciences & Technology, Baddi, India. She has over 28 years of teaching, research and industrial experience in various organizations in India. Her major research area is e-waste management. E-mail : pamela_chawla@yahoo.com
Pamela Chawla is currently pursuing her Ph.D.in Electronics Engineering. She is working as Associate Professor in Electronics & Communication Engg. at Baddi University of Emerging Sciences & Technology, Baddi, India. She has over 28 years of teaching, research and industrial experience in various organizations in India. Her major research area is e-waste management. E-mail : pamela_chawla@yahoo.com
![]() Dr. Neelu Jain is working as Assistant Professor in the Electronics & Electrical Communication department at the PEC University of technology, Chandigarh, India. She has an experience of 28 years in teaching , research and industry. Her research interests are Digital Signal processing, Image Processing and E-Waste Management. She
Dr. Neelu Jain is working as Assistant Professor in the Electronics & Electrical Communication department at the PEC University of technology, Chandigarh, India. She has an experience of 28 years in teaching , research and industry. Her research interests are Digital Signal processing, Image Processing and E-Waste Management. She
IJSER © 2012 http://www.ijser.org
International Journal of Scientific & Engineering Research Volume 3, Issue 7, June-2012 11
ISSN 2229-5518
has published about 28 papers in international and national journals and conferences. E-mail :neelujn@hotmail.com
IJSER lb)2012
htt p://www .'lser.ora