International Journal of Scientific & Engineering Research, Volume 3, Issue 10, October-2012 1
ISSN 2229-5518
Estimation of Solutes in Orange Peel
Extract for Pectin Production
Tekeste Yeshitla Gebre
—————————— ——————————
ectin is a complex polysaccharide composed of a α-1,4-linked D-galacturonic acid(GalA) backbone (so-called homogalacturonan) and segments consisting of alternating sequences of α- (1,2)-linked L-rhamnosyl and α-1,4-linked D- galacturonosyl residues ramified with side chains of Arabians, arabinogalactans and galactans (branched rhamnogalacturonans). The homogalacturonan sections are called ‘smooth’ and the rhamnogalacturonic regions are called ‘hairy’ [
1]. Neutral sugars are also present as side chains in different amounts depending on the pectin source and on the extraction method used.
Depending on their degree of methoxylation (DM), pectins are referred to as high methoxy pectin (HMP) (DM ≥ 50) or low methoxy pectins (LMP) (DM < 50). HMP forms gels in an acidic medium (pH 2.0–3.5) if sucrose is present at a concentration higher than 55 wt %. LMP can gel over a larger pH range (2.0–6.0) in the presence of a divalent ion, such as calcium. In this case, the presence of sucrose is not necessary for forming the gel [2]. These applications account for the substantial
consumption of pectin worldwide.
Dried lemon or orange peel, citrus albedo and apple pomace are the main raw materials that have been utilized in pectin production all around the world [3].
Pectin can be extracted from fruits using mineral acid (HCl or HNO3) or chelating agents (ammonium oxalate or sodium hexametaphosphate). Extraction using mineral acid seems to be the most widely used method [ 4]. Mineral acids gave higher yields as compared to organic acids irrespective of concentration used. This could be due to their higher dissociation constants and consequently more hydrolyzing capacity [5]. An extraction process is the most important operation to obtain pectin from vegetal tissue. It is mainly influenced by factors like temperature, pH and time.
Pectins extracted from several plant by-products are widely used in the food industry as gelling agents e.g. jam, jelly, emulsion stabilizer and thickener in sauces [6]. It can also be used in medicine as a fiber source, a supplement to lower cholesterol and increase immunity or as dentistry adhesive [4].
IJSER © 2012 http://www.ijser.org
International Journal of Scientific & Engineering Research, Volume 3, Issue 10, October-2012 2
ISSN 2229-5518
The objectives of this paper was to estimate the solutes in orange peel-liquid extract used for pectin production based on the optimum extraction conditions. The raw material, orange peel, was obtained as a byproduct from hotels and restaurants in Addis Ababa city. This waste can entail a serious environmental problems unless it is disposed properly or changed into some useful products. Therefore, utilization of this waste for the production of useful products such as pectin will have economical and environmental benefits.
Fresh orange waste consisting of peel and pulp was collected from restaurants, hotels, pastries and juice processing houses in Addis Ababa city. The fresh peel was then sorted, washed, dried, milled and packed in airtight, moisture-proof bag at room temperature until required for the extraction process.
A central composite design was used to determine the effect of the two extraction variables, pH and temperature, on the solutes yield of the orange peel powder. The center point of the design and the variables range were selected according to the literature (Table 1).The complete design consisted of 13 experiments including four factorial experiments (levels ±1), four axial experiments (levels ± α), and five replicates at the centre point (Table 2). The star arm (α), known as the arm length of the axial experiments from the center point, was 1.414. The Experiment at the centre point of the design was repeated to get a good estimate of experimental error (pure error). All the experiments were carried out at random in order
to minimize the effect of unexplained variability in
the observed responses due to systematic errors. In this work the response variable measured was the solutes yield of orange peel powder.
Table 1. Experimental and coded levels of two variables employed for solutes extraction
Variables | Level | ||||
Variables | -α | -1 | 0 | +1 | +α |
pH | 1.793 | 2.0 | 2.5 | 3.0 | 3.207 |
Temperature (0C) | 60.86 | 65.0 | 75.0 | 85.0 | 89.14 |
Table 2. The complete design points for the selected experimental design (CCD)
Design Point | pH | Temperature |
1 | -1 | -1 |
2 | -1 | 1 |
3 | 1 | -1 |
4 | 1 | 1 |
5 | -α | 0 |
6 | α | 0 |
7 | 0 | -α |
8 | 0 | α |
9 | 0 | 0 |
10 | 0 | 0 |
11 | 0 | 0 |
12 | 0 | 0 |
13 | 0 | 0 |
Extraction of the solutes was carried out according to the method described by Aravantinos- Zafaris and Orepoulou [7]. In this work a mass of 5.0g orange peel and pulp powder was subjected to extraction using water as a solvent medium. The extraction process was carried out in a water and oil bath for different pH and temperature combinations of the peel and pulp powder to water solution. The possible pH and temperature
combinations known as the design points were
IJSER © 2012 http://www.ijser.org
International Journal of Scientific & Engineering Research, Volume 3, Issue 10, October-2012 3
ISSN 2229-5518
obtained from the selected experimental design of the work (Table 2). The pH of the powder and water solution was adjusted using a 65 % (V/V) HNO3.
For a given design point, at a specific pH and temperature, the extraction of a 5.0g orange peel and pulp powder was ongoing by using 200ml of solvent. The concentration of the solution was checked by a hand held refractometer within a five minutes interval. Each time data were taken until the concentration of the solution reached its equilibrium point. Then for the same design point, the experiment was repeated with 300,400,500 and
600ml of solvent. Similarly, the experiment was carried out for the rest of all design points of the experimental design.
All statistical calculations and graphics both in the extraction and optimization processes of the solutes were analyzed by using Design Expert 8.0.4 software. In the analysis, the regression coefficients for the response variable terms were determined by using multiple linear regressions, and tested for significance using students t-test at a significance level of p= 0.05. The estimated regression was then tested for the adequacy of fit using the F-test at a significance level of P=0.05.
During the extraction process soluble solutes largely pectin, diffuse from the orange peel and pulp powder into the solvent until the concentration of solutes both in the peel and solvent become in equilibrium. At equilibrium, the total mass of solutes in the solvent was obtained by
multiplying the total mass of the solution (solutes
+ solvent) and actual concentration reading, both at equilibrium.
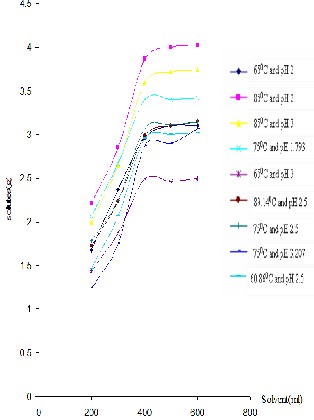
For all design points (Figure 1), the total mass of solutes in the solvent at equilibrium were significantly increased for the volume of solvent used in the range 200 to 400ml. However, for the volume of solvent used in the range 400ml and above, the changes were very insignificant compared to the preceding changes. Therefore, approximations for the total solutes in the solvents at equilibrium were taken based on the assumptions that the changes of total solutes in the solvents right after the 400ml volume of solvent used were negligible (Table 3). This was basically because the given mass of peel and pulp powder had obtained the appropriate amount of solvent to leach its soluble constituents at max. Therefore, this assumption was used to select the approximate volume of solvent used to extract dissolved solutes from a given mass of peel and pulp powder. Based on this assumption, the approximate volume of solvent (water) used for about 5.0g of dried and milled orange peel and pulp powder sample was 400ml.
IJSER © 2012 http://www.ijser.org
International Journal of Scientific & Engineering Research, Volume 3, Issue 10, October-2012 4
ISSN 2229-5518
Table 3. Mass of Solutes in the Solvent at
Equilibrium
Figure 1. Total Mass of Solutes in the Solvent at
Equilibrium for different pH and Temperature
IJSER © 2012 http://www.ijser.org
International Journal of Scientific & Engineering Research, Volume 3, Issue 10, October-2012 5
ISSN 2229-5518
From the above table (Table 3) one could see that the highest mass of solutes in the solvent was obtained at 850C and pH 2.0. The corresponding actual solutes concentration of this design point was 0.719 g of solutes per 100g of solution.
A regression analysis was conducted for the data in Table 3. The regression equation derived for the mass, M, of the extracted solutes was
𝑀 = +3.13 − 0.2� + 0.21� − 0.25�� + 0.21� (1)
where A and B are coded values of pH and
temperature.
Based on (1), it was evident that in the examined range of variables an increase of temperature and a decrease of pH would result in an increase of the
mass of solutes in the solvent.
Table 4. Analysis of variance for the solutes yield of orange peel and pulp powder
R2= 0.9664, R2adj =0.9496
From the F-Value of the F-test (Table 4) the selected model was significant, and the estimated regression had insignificant lack of fit for the adequacy of the fit test at a significance level of p=0.05. Insignificant lack of fit is good since the model is required to fit the data. Alternatively, the adequacy of the fit test of the model could be evaluated just by looking at the determination coefficients (R2) and adjusted R2 (R2adj). Accordingly, the value of the determination coefficient (R2= 0.9664) was very good and indicated that 96.64% of the variability in the
response could be explained by the model.
IJSER © 2012 http://www.ijser.org
International Journal of Scientific & Engineering Research, Volume 3, Issue 10, October-2012 6
ISSN 2229-5518
Furthermore, the value of the adjusted determination coefficient (R2adj =0.9496) was also higher to emphasize the significance of the model.
In the process of optimization goals or criteria were set for the extraction variables, and their relative importance were also considered. Accordingly, in the examined range of variables, the pH had to be minimized and temperature had to be maximized in order to get maximum solutes yield. The maximization and minimization of the extraction variables were performed by a Numerical optimization technique incorporated in the Design Expert 8.0.4 software. Thus, the optimum extraction conditions were found at pH
2.0 and temperature 850C with the corresponding actual solutes concentration 0.72 g of solutes per
100 g of solution.
Compared to the data obtained in literature, the optimum extraction conditions of the solutes lie in the accepted limits of citrus peel extraction conditions for pectin as suggested by Seymour and Knox [8]. According to this researcher, HM pectins are extracted from pomace or peels in hot diluted mineral acid in the pH and temperature ranges of
1-3 and 50-900C, respectively, during 3 to 12 hours of extraction time.
The extraction method used was efficient in estimating the yield of solutes for pectin production from the source. For all design points, the final product was estimated based on the total dissolved solutes concentration of the extract at equilibrium. The results of analysis of variance showed that the effects of the two variables, pH and temperature, on the yield of the extracted
solutes were found to be significant. The
interaction of pH and temperature was also found to be significant, however to a lower extent. The response surface elaborated from the regression model showed that an increase in the yield of solutes was observed when the variables pH and temperature were used at the levels -1 (pH=2.0) and 1 (850C), respectively. However, from the regression equation one could see that, in the examined range of variables an increase of temperature and a decrease of pH would result in an increase of the solutes yield. So it would be possible to maximize the solutes yield in the examined range of variables using appropriate optimization techniques. Under these circumstances, the optimum extraction conditions were found at pH 2.0 and temperature 850C with the corresponding actual solutes concentration
0.72g of solutes per 100 g of solution.
Moreover, it was also more efficient in approximating the appropriate volume of solvent used to extract a given mass of peel and pulp powder efficiently. Based on the results of the experiment, the approximate volume of solvent (water) used for about 1kg of orange peel and pulp powder was 80 liters.
These results demonstrate the successful extraction of solutes for pectin production with nitric acid, providing potential benefits to industrial extraction of pectin, from an economic as well as an environmental point of view.
[1] S. Guillotin, “Studies on the Intra- and
Intermolecular Distributions of Substituents in
IJSER © 2012 http://www.ijser.org
International Journal of Scientific & Engineering Research, Volume 3, Issue 10, October-2012 7
ISSN 2229-5518
Commercial Pectins,” PhD dissertation, Research School FLAG., Wageningen Univ., The Netherlands.,2005.
[2] E. Kliemann, K. Simas, S. Amante, E.
Prudencio, R. Teofilo, M. Ferreira and R. Amboni, “Optimization of pectin acid extraction from passion fruit peel (Passiflora edulis flavicarpa) using response surface methodology,” International Journal of Food Science and Technology, vol. 44, no.3, pp. 476–
483, 2009.
[3] P.Y. Tang, C.J. Wong and K.K. Woo, “Optimization of Pectin Extraction from Peel of Dragon Fruit (Hylocereus polyrhizus),” Asian Journal of Biological Sciences, vol. 4, no.2, pp. 189-195, 2011.
[4] D. Boonrod, K. Reanma and H. Niamsup, “Extraction and Physicochemical Characteristics of Acid-Soluble Pectin from Raw Papaya (Carica papaya) Peel”, Chiang Mai J. Sci., vol. 33, no. 1, pp.129-135, 2006.
[5] D.V. Sudhakar and S.B. Maini, “Isolation and Characterization of Mango Peel Pectins”, Journal of Food Processing and Preservation, vol.24, no. 3, pp. 209–227, 2000.
[6] C. D. May, “Industrial Pectins: Sources, Production and Applications. Carbohydrate Polymers”, Elsevier Journal, vol.12, no.1, pp.79-
99,1990.
[7] G.A. Zafaris and V. Orepoulou, “The effect of Nitric Acid Extraction Variables on Orange Pectin”, Journal of the Science of Food and Agriculture, vol.60, no.1, pp.127-129,1992.
[8] G. B. Seymour and J. P. Knox, Pectins and Their Manipulation. Edinburgh, United Kingdom: Blackwell Publishing Ltd, pp. 222-239,2002.
IJSER © 2012 http://www.ijser.org