International Journal of Scientific & Engineering Research, Volume 4, Issue 4, April-2013 1244
ISSN 2229-5518
Equilibrium, Kinetic and Thermodynamic studies of biosorption of Methylene Blue dye using plant biomass as biosorbent: Optimization using Response Surface Methodology (RSM).
Kalpana Polipalli, King Pulipati
Abstract—The use of low cost and eco-friendly biosorbent was investigated as an ideal alternative to the current expensive methods of removing dyes from wastewater. In this study, the sorption of Methylene Blue (MB) on Bauhinia purpurea L. (BPL) biomass was investigated in a batch system. The rate of biosorption was investigated under various parameters such as temperature, biosorbent dosage, pH, contact time and initial dye concentration on the sorption of MB. Response surface methodology (RSM) was used to optimizing the process parameters. BPL was characterized by using scanning electron microscope (SEM) and Fourier Transfer for infrared spectrophotometer (FTIR). Equilibrium isotherm was analyzed using the Langmuir, Freundlich and Temkin isotherm models. The characteristic parameters for each model have been determined. The sorption kinetics of MB onto BPL was described by pseudo-second
order kinetic equation. Thermodynamic activation parameters such as ΔG 0, ΔS0 and ΔH0 were also calculated.
Index Terms— Response surface methodology, Bauhinia purpurea, methylene blue , biosorption, kinetics, isotherms, thermodynamic studies.
—————————— ——————————
Concern about environmental protection has in- creased over the years from a global view point. Today, rapid- ly changing technologies, industrial products and practices generate waste that if improperly managed, could threaten public health and the environment. Therefore, elimination of heavy metals and synthetic compounds are attempted by many researchers.
Effluents from industries such as dyestuff, textiles, leather,
paper, printing, plastic and food contain various dyestuffs. Dye, a highly coloured and synthetic substance contains at least one chromophores (colur bearing group) and auxo- chromes (colour helpers) which impart intense colors to them
and are undesirable and disgusting in wastewater. There are various conventional methods of removing dyes from waters. Among these methods, adsorption is by far the most versatile and widely used method because of its low cost and eases of operation. A number of agricultural waste and by-products of cellulose origin have been studied for their capacity to remove dyes and heavy metals from aqueous solutions, such as pea- nut hulls [1], maize bran [2], sawdust [3], sugar beet pulp [4], crab shell [5], cornstarch [6], rice husk [7], chitin [8], orange waste [9], Araucaria cookii bark [10] and aqua cultural shell powders [11].
————————————————
P. Kalpana is currently pursuing PhD in chemical engineering, Andhra University, Associate Professor, GMRIT – Rajam, India, PH-09392677008. E-mail: kalpanamtech@yahoo.com
Dr. P.King, Professor, Department of Chemical Engineering, Andhra Universi-
ty, India, PH-09440191017. E-mail: p_king@ rediffmaill.com.
The aim of the present study is to investigate the in-
fluence of pH, contact time, dosage, initial dye concentration and temperature on the biosorption of MB by the BPL. Differ- ent isotherms were used to derive the adsorption parameters. The process optimization was also studied. The materials were characterized by FTIR and SEM techniques.
A cationic dye, MB, having molecular formula C16H18N3SCl.3H2O was chosen as adsorbate. MB (Basic Blue 9) was purchased from Fischer inorganics and Aromatics Ltd. Chennai, India. The MB was chosen in this study because of its known strong adsorption onto solids. The dye stock solution was prepared by dissolving accurately weighted MB in dis- tilled water to the concentration of 1000 mg/L. The experi- mental solutions were obtained by diluting the dye stock solu- tion in accurate proportions to required initial concentrations.
The BPL was collected from GMR Institute of Technology campus of Rajam, Andhra Pradesh, India. Leaves were washed with deionized water several times to remove dirt and sun dried. Then the dried leaves were powdered using domestic grinder to the powder size of 81-212 μm and used as biosorbent without any pretreatment for MB adsorption. Infrared (IR) spectra of the BPL samples were recorded in the region 4000 to 500
IJSER © 2013
International Journal of Scientific & Engineering Research, Volume 4, Issue 4, April-2013 1245
ISSN 2229-5518
cm-1 on a spectrum – 100 FTIR spectrometer. SEM analy- sis was carried out on the BPL to study its surface tex- ture before and after MB adsorption.
Batch biosorption experiments were carried out at room temperature. The stock solution of MB (1000 mg/L) was prepared and suitably diluted to the required initial concentrations (20 –100 mg/L). The experiments were carried out in 250 ml flasks containing 30 ml of synthetic dye solution. The flasks were agitated on a shaker at constant speed of agitation for 60 min. The final equilib- rium concentrations were measured spectrophotometri- cally at 665 nm using UV spectrophotometer. Various experimental conditions such as initial dye concentra- tions, dosage, pH and contact time were studied. The percentage removal of dye and amount adsorbed (mg/g) were calculated using the following relation- ships:
% color removal = ------------- (1) Dye uptake, q = ------------- (2)
Where Ci is the initial sorbent concentration (mg/L), Cf is the final sorbent concentration (mg/L), v is the vol- ume of the solution (L) and m is the mass of the bio- sorbent (g).
The aim of RSM is to find out the optimum operating conditions for a given system, or the way in which a par- ticular response is affected by a set of variables. The quadratic response surface model over some specific region of interest was fitted to the following equation:
Y =b0+b1X1 +b2X2 +b3X3 +b4X4 +b11X12 +b22 X22
+b33X32 +b44X42 +b12X1X2 +b13X1X3 +b14X1X4
+b23X2X3 +b24X2X4 + b34X3X4 ------------(3)
Where Y is the predicted response ; X1, X2, X3, and X4 are independent variables; b0 is an offset term; b1, b2, b3 and b4 are linear effects; b11, b22, b33 and b44 are squared
effects; and b12, b13,b14, b23, b24 and b34 are interaction terms.
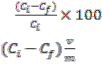
The ‘‘Design Expert’’ software (statistical package STA- TISTICA 6.0 ( Stat Soft Inc.) was used for regression and graphical analysis of the data obtained. The operational conditions were independence variables which were X1 (temperature), X2 (pH ), X3 ( dosage) and X4 ( initial dye concentration). The intervals of reaction parameters were selected as 30 – 500C for temperature, 8 -12 for pH,
0.02 to 0.1 for dosage and 20 -100 mg/L for initial dye concentration. The experimental range and levels of the independent variables are indicated Table 1.
Table.1: Levels of different process variables used in
CCD for removal of MB dye.
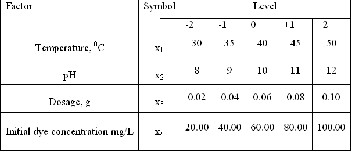
The FTIR spectra(Fig.1a) of BPL showed peaks at
3298, 2900, 2350, 1610, 1317, 1242, 1149, 1052, 779, 648,
594 cm–1 which may be assigned to the OH group, CH
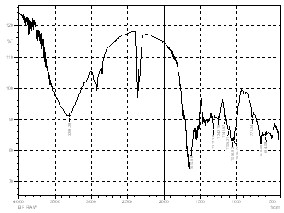
stretching, CH2 group, C= O stretching, NO2 aromatic nitro compound, C – O stretching, C- N stretching, CH bendng vibrations(aromatics) respectively [12] . The in- tensity of the peaks were either minimized or shifted slightly in case of adsorbed BPL (Fig. 1b). These results are similar to the ones reported earlier [13,14].
Fig. 2 shows the SEM micrographs of BPL sample before
and after dye adsorption. It is clear that BPL has consid-
erable numbers of heterogeneous layer of pores where there is a good possibility for dye to be adsorbed. The surface of dye-loaded adsorbent, however, clearly shows that the surface of BPL is covered with dye molecules (Fig. 2b).
Figure.1a.FTIR Spectra BPL before adsorption
IJSER © 2013
International Journal of Scientific & Engineering Research, Volume 4, Issue 4, April-2013 1246
ISSN 2229-5518
equilibrium and the adsorption did not change significantly with further increase in contact time. Therefore, the uptake and un -adsorbed MB concentrations at the end of 20 min are given as the equilibrium values (qe, mg/g; Ce , mg/L), respec- tively (Fig.3) and the other adsorption experiments were con- ducted at this contact time. A large number of vacant surface sites are available for adsorption during the initial stage, and after a lapse of time, the remaining vacant surface sites are difficult to be occupied due to repulsive forces between the solute molecules on the solid and bulk phases [15, 16, 17]. This results in the slowing down of the adsorption during the later period of adsorption [18].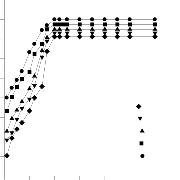
98
Figure. 1b FTIR Spectra BPL after MB adsorption 96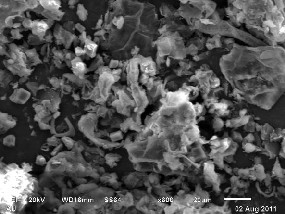
94
92
90
88
100 ppm
86 80 ppm
60 ppm
84
40 ppm
82 20 ppm
80
0 10 20 30 40 50 60 70
Contact time, min
Figure.3. Effect of contact time
Figure.2a. SEM OF BPL before adsorption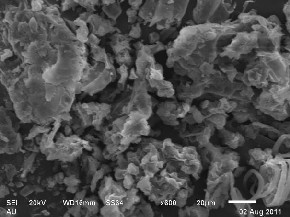
98
97
96
95
94
93
0 20 40 60 80 100 120
Concentration
Figure.2b. SEM of BPL after MB adsorption
The data obtained from the biosorption of MB on the BPL
showed that a contact time of 20 min was sufficient to achieve
Figure.4. Effect of initial dye concentration
IJSER © 2013
International Journal of Scientific & Engineering Research, Volume 4, Issue 4, April-2013 1247
ISSN 2229-5518
Fig. 4 shows the effect of initial dye concentration on the adsorption of MB by BPL. The percentage removal of dye is highly dependent on the initial amount of dye concentra- tion. The data shows that the percentage of dye removal de- creases with an increase in the initial dye concentration, which may be due to the saturation of adsorption sites on the adsor- bent surface. At a low concentration there will be unoccupied active sites on the adsorbent surface, and when the initial dye concentration increases, the active sites required for adsorp- tion of the dye molecules will lack [19]. On the other hand the increase in initial dye concentration will cause an increase in
The decrease in adsorption with increasing temperature sug- gests weak adsorption interaction between biomass surface and the dye.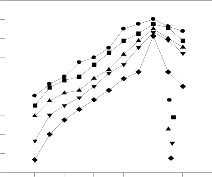
98
96
94
92
90
20 ppm
the loading capacity of the adsorbent and this may be due to 86
the high driving force for mass transfer at a high initial dye 84
40 ppm
60 ppm
80 ppm
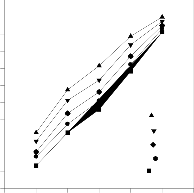
MB is a cationic dye, which exists in the aqueous solution in the form of positively charged ions. As a charged species, the degree of its adsorption onto the adsorbent surface is primari- ly influenced by the surface charge on the adsorbent, which in turn is influenced by the solution pH [21]. Fig. 5 shows the effect of pH on the BPL adsorption capacity of MB. It was found that, the removal of MB increased with the increase of pH. Lower adsorption of MB at low pH is probably due to the presence of H+ ions competing with the cations groups on the dye for adsorption sites [22]. As surface charge density de- crease with an increase in the solution pH, the electrostatic repulsion between the positively charged MB and the surface of the BPL is lowered, this may result in an increase in the rate of adsorption. The maximum percentage of biosorption was observed at pH 10. Above this point, adsorption of MB on BPL decreases. Similar trends were reported in the literature for the adsorption of basic dyes, methylene blue onto jute fiber car- bon. [23].
The adsorption of the dyes on BPL biomass was studied by
varying the sorbent dosage (0.02 to 0.1 g in 30 mL). The per-
centage of adsorption was increased as the adsorbent concen-
tration increased shown in Fig.6. This increase is due to the
availability of larger surface area with more active functional groups at higher adsorbent dosages.
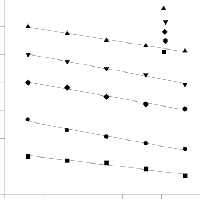
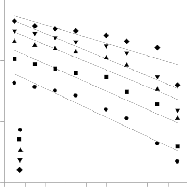
Fig.7 shows the effect of temperature on the biosorption kinet- ics of BPL at a pH of 10. It was observed that with increasing temperature from 30 to 500C the adsorption capacity of BPL decreased. This indicates that adsorption of dyes onto BPL is controlled by exothermic process and the maximum adsorp- tion is nearly 96% at 20 min at 300C. Results shows that tem- perature plays an important role on the dye adsorption capaci- ty of BPL. At high temperatures, the thickness of the boundary layer decreases, due to the increased tendency of the dye to escape from the biomass surface to the solution phase, which results in a decrease in temperature as temperature increases.
IJSER © 2013
100 ppm
80
0 2 4 6 8 10 12 14 pH
Figure.5 . Effect of pH
Figure.6. Effect of biosorbent dosage
98
96
94
92
90
88
20 ppm
40 ppm
60 ppm
80
80 ppm
78 100 ppm
76
0.00 0.02 0.04 0.06 0.08 0.10 0.12
Adsorbent dosage,gm
International Journal of Scientific & Engineering Research, Volume 4, Issue 4, April-2013 1248
ISSN 2229-5518
Figure.7. Effect of Temperature
98
96
94
92
90
303 K
308 K
313 K
318 K
323 K
where kf is the Freundlich constant (mg/g (mg/L)n) and 1/n is the heterogeneity factor. The slope 1/n ranging between 0 and 1 is a measure of adsorption intensity or surface heteroge-
zero [26]. The plot of lnqe versus lnCe, (Fig. 9), gives straight lines with slope 1/n. Accordingly, Freundlich constants were calculated and recorded in Table 2.
Temkin isotherm [27] is represented by the following equa- tion:
88
86
84
300 305 310 315 320 325
Temperature, K
![]()
------------- (6)
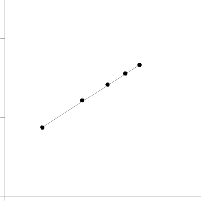
The adsorption data were analyzed according to Eq. (6). A plot of qe versus lnCe , Fig. 10, enables the determination of the isotherm constants KT and A. KT is the equilibrium binding constant (L mg−1) corresponding to the maximum binding en- ergy and constant A is related to the heat of adsorption. The values of the parameters are given in Table 2, indicating that the Freundlich isotherm model yielded the best fit with the highest r2 value (0.9994) compared to the Langmuir and Tem- kin models.
In order to indicate the adsorption behavior and to estimate the adsorption capacity, adsorption isotherms were studied. The analysis of the isotherm data through fitting with different isotherm models is an important step in finding the suitable model that can be used for design purpose. The isotherm data were fitted to the Langmuir, Freundlich and Temkin iso- therms. Langmuir isotherm [24] is represented by the follow- ing linear equation:
![]() ------------- (4)
------------- (4)
where qm and b are Langmuir constants related to adsorption capacity and rate of adsorption, respectively (Fig. 8). The
Langmuir constants b and qm were calculated from this iso- therm and their values are listed in Table 2.
Figure.8. Langmuir isotherm for adsorption of MB on BPL
0.21
0.20
0.19
0.18
0.17
0.16
0.15
0.14
Figure.9 Freundlich isotherm for adsorption of MB on BPL
5
4
3
2
1
0
-1 0 1 2 3 ln Ce
0.13
0 1 2 3 4 5 6
Ce
The Freundlich model can take the following form [25]: ![]() -------------- (5)
-------------- (5)
IJSER © 2013
International Journal of Scientific & Engineering Research, Volume 4, Issue 4, April-2013 1249
ISSN 2229-5518
Figure.10. Temkin isotherm for adsorption of MB on BPL
model.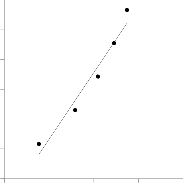
30
Figure.11. Pseudo first order kinetic model
25
2
20
1
15
0
10
-1
5
0
-1 0 1 2 3 lnCe
-2
20 ppm
40 ppm
-3 60 ppm
80 ppm
100 ppm
-4
0 2 4 6 8 10 12 14 16 18
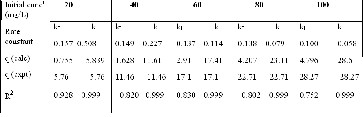
Table.2: Adsorption isotherms and corresponding parameters
for MB binding by BPL.
time (t), min
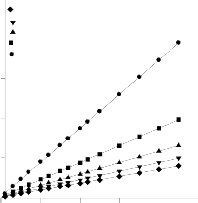
The pseudo-second-order equation
If the rate of sorption is a second-order mechanism,
the pseudo-second-order chemisorption kinetic rate equation
is expressed as [29]: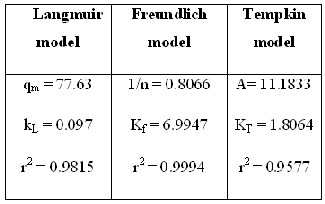
t 1
![]()
![]()
2
![]()
1 t
qt kqe qe
---------- (8)
In order to examine the controlling mechanism of ad-
where t is the contact time (min), qe(mg/g) and qt (mg/g) are the amount of the solute adsorbed at equilibrium. Eq. (10) does not have the problem of assigning an effective qe. If pseudo-second-order kinetics is applicable, the graph t/qt against t of Eq. (8) should give a linear relationship, from which qe and k can be determined from the slope and intercept of the plot (Fig. 12) and there is no need to know any parame- ter beforehand.
The pseudo-second-order rate constant k, the calcu-
lated qe value and the corresponding linear regression correla-
2
tion coefficient value 2 are given in Table 3. At an initial MB
concentration of 20 mg/L, the linear regression correlation
sorption processes such as mass transfer and chemical reac-
tion, several kinetic models were used to test experimental
2
coefficient 2
value was higher. The higher
2
2 value con-
data [28]. The experimental data were also analyzed using the pseudo-first and pseudo-second-order adsorption kinetic models. These models correlate solute uptake, which is im- portant in predicting the reactor volume. These models are explained below
The pseudo-first-order equation
The linear form of pseudo-first-order equation of
Lagergren is generally expressed as follows:
ln(qe – q) = ln(qe) - kI t ---------(7) The pseudo-first-order rate constant kI can be ob-
tained from the slope of the graph between log(qe −q) versus
time, t (Fig.11). The calculated kI values and their correspond- ing linear regression correlation coefficient values are shown
in Table 3. Based on the q calculated and experimental values this model cannot be applied to predict the adsorption kinetic
firms that the adsorption data were well represented by pseu-
do-second order kinetic model.
A comparison of the maximum capacity qm of BPL
with those of some other adsorbents reported in literature is
given in Table 4. Differences of dye uptake are due to the properties of each adsorbent such as structure, functional groups and surface area.
IJSER © 2013
International Journal of Scientific & Engineering Research, Volume 4, Issue 4, April-2013 1250
ISSN 2229-5518
Figure.12. Pseudo second order kinetic model
10
100 ppm
80 ppm
60 ppm
8 40 ppm
20 ppm
6
4
2
0
0 10 20 30 40 50
t,min
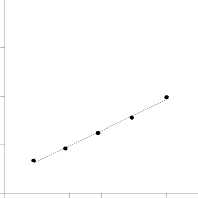
Figure.13. Van't Hoff plot for the adsorption of MB onto BPL
4
2
1
0
0.003 0.003 0.003 0.003 0.003 0.003 0.003
1/T
The application of the RSM based on the estimates of parame- ters indicated an empirical relationship between the response and the input variables expressed by the following fitted se- cond order polynomial equation
Y = -560.33 + 5.02 X1+ 95.16 X2+ 1225.81 X3 +1.22
X4 – 0.07X12 – 4.34 X 2
– 5963.62 X 2
– 0.01 X42 -
Table.3: Parameters of pseudo first order and pseudo second order kinetic model.
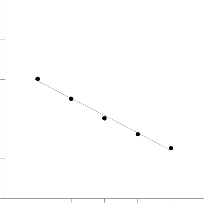
In order to gain an insight into the mechanism involved in the adsorption process, thermodynamic parameters for the pre- sent system were calculated. The adsorption free energy (ΔG0), adsorption enthalpy (ΔH0) and adsorption entropy (ΔS0) were determined from the slope and intercept of the van’t Hoff plot of ln K versus 1/T(Fig.13 ) [ 39, 40].
It was observed that all ΔG0 values are negative indicates that the biosorption process is feasible and the adsorption process is spontaneous in nature. ΔH0 and ΔS0 were calculated as -
52.628 KJ/mol and -157.66 J/mol, respectively. The negative value of adsorption enthalpy shows that the adsorption pro-
cess is exothermic.
0.01 X1X2 – 0.03 X1X3 – 0.01 X1X4 -19.42 X2 X3 –
0.06 X2X4+ 0.31X3X4 ------ (9)
The student t- distribution and the corresponding p-values,
along with the parameter estimates, are listed in Table-5. The
significance of each parameter was determined via p-values
and the student t- test. A larger t-value and smaller p-value identifies the effect that appears to be very important [41, 42]. For our data, it was observed that the first order main effects of variables, namely pH (X2), Dosage (X3) and Concentration (X4) and their second order main effects X22, X32 are highly significant since their respective p-values are very small. The quantities X1, X2, X3 and X4 have positive influence while X12, X22, X13, X14 , X33 etc. shows a negative influence on adsorption. In order to determine whether or not the second order poly- nomial equation was significant to fit with experimental re- sult, it is necessary to conduct an analysis of variance (ANO- VA). The ANOVA indicates that the equation represents ade- quately the actual relationship between the response and the significant variables. The coefficient of determination (R2) is found to be 0.97 which is very high and has advocated high correlation between the observed and the predicted value [43].
IJSER © 2013
International Journal of Scientific & Engineering Research, Volume 4, Issue 4, April-2013 1251
ISSN 2229-5518
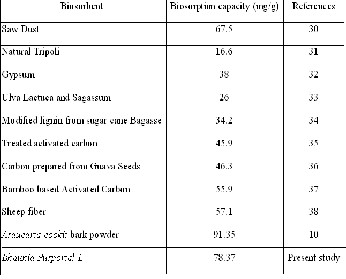
sorbent for removal of MB from aqueous solution. Removal of MB dye is pH dependent and maximum removal was attained at pH 10. The equilibrium adsorption is achieved through a contact time of 20min. The percentage removal of dye is also a function of dosage, dye concentration and temperature. The adsorption kinetics could be quite successfully fitted by a pseudo-second order kinetic model. The equilibrium data were well described by the Freundlich model with adsorption capacity of 78.37 mg g-1. The determination of thermodynam- ic parameters indicates the spontaneous and exothermic na- ture of the adsorption process. RSM results showed that the optimum values of the process variables were an initial MB concentration of 35.34 mg/L, a pH value of 10.48, a dosage of
0.085g and a temperature of 31.8 ºC.
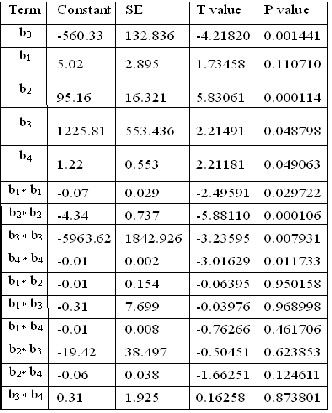
Table.5 : Response surface regression of percentage color re- moval of MB dye.
The present study confirmed that the BP has an effective bio-
[1] Singh, K.K., M. Talat and S.H. Hasan, Removal of lead from aqueous solu- tions by agricultural waste maize bran., Bioresource Technol., 97(16), 2124-2130 (2006).
[2] Taty-Costodes, V.C., H. Fauduet, C. Porte and A. Delacroix, Removal of Cd(II)
and Pb(II) ions, from aqueous solutions, by adsorption onto sawdust of Pinus sylvestris. J. Hazard. Mater., 105 (1-3), 121-142 (2003).
[3] Reddad, Z., C. Gerente, Y. Andres and P. LeCloirec, Adsorption of several metal ions onto a low-cost biosorbent: Kinetic and equilibrium studies. Envi- ron. Sci. Technol., 36(9), 2067-2073 (2002).
[4] Vijayaraghavan, K., K. Palanivelu and M. Velan, Biosorption of copper(II) and cobalt(II) from aqueous solutions by crab shell particles. Bioresource Technol.,
97(12), 1411-1419 (2006).
[5] Kweon, D.K., J.K. Choi, E.K. Kim and S.T. Lim, Adsorption of divalent metal ions by succinylayted and oxidized corn starch. Carbohyd. Polym., 46(2), 171-
177 (2001).
[6] Kumar, U. and M. Bandyopadhyay, Sorption of cadmium from aqueous solution using pretreated rice husk., Bioresource Technol., 97(1), 104-109 (2006).
[7] Ghimire, K.N., K. Inoue, T. Miyajima, K. Yoshizuka and T. Shoji, Adsorption
of some metal ions and mineral acids on chitin. Chitin Chitosan Res., 7(2), 61-
68 (2001).
[8] Dhakal, R.P., K.N. Ghimire, K. Inoue, M. Yano and K. Makino, Acidic poly- saccharide gels for selective adsorption of lead(II) ion. Sep. Purif.Technol.,
42(3), 219-225 (2005).
[9] P.Kalpana, P.King,v removal of methylene blue from aqueous solution onto a new cheap adsorbent (Araucaria cookii bark powder), International Journal of waste water Treatment and Green Chemistry, Vol 2. No1,2011,pg no 31-43.
[10] Tsai, W.T., H.R. Chen, K.C. Kuo, C.Y. Lai, T.C. Su, Y.M. Chang and J.M. Yang, The adsorption of Methylene Blue from aqueous solution using waste aqua- cultural shell powders. J. Environ. Eng. Manage., 19(3), 165-172 (2009).
[11] B.H. Hameed∗ , R.R. Krishni, S.A. Sata, A novel agricultural waste adsorbent
for the removal of cationic dye from aqueous solutions, Journal of Hazardous
Materials 162 (2009) 305–311.
[12] G. F. Huang, Q. T. Wu, J. W. C. Wong, B. B. Nagar, Transformation of organic matter during co-composting of pig manure with sawdust, Bioresource Technology, 35, 132–137 (2005).
[13] Olugbenga Solomon Bello, Oladipo Mary Adelaide, misbaudeen abdul hammed, olalekan abdul muiz popoola, kinetic and equilibrium studies of methylene blue removal From aqueous solution by adsorption on treated sawdust, Macedonian Journal of Chemistry and Chemical Engineering, Vol.
29, No. 1, pp. 77–85 (2010).
IJSER © 2013
International Journal of Scientific & Engineering Research, Volume 4, Issue 4, April-2013 1252
ISSN 2229-5518
[14] B.K. Nandi, A. Goswami, M.K. Purkait, Adsorption characteristics of Brilliant
Green dye on kaolin, J. Hazard. Mater. 161 (2009) 387–395.
[15] M.H. Kalavathy, L.R.Miranda, Comparison of copper adsorption fromaque- ous solution using modified and unmodified Hevea brasiliensis saw dust, Desalin. 255 (2010) 165–174.
[16] V.C. Srivastava, I.D. Mall, I.M. Mishra, Removal of cadmium(II) and zinc(II) metal ions from binary aqueous solution by rice husk ash, Colloids Surf A: Physicochem Colloids Surf. Physicochem. Eng. Aspects 312 (2008) 172–184.
[17] V.C. Srivastava, I.D. Mall, I.M. Mishra, Characterization of mesoporous rice husk ash (RHA) and adsorption kinetics of metal ions from aqueous solution onto RHA, J. Hazard. Mater. B134 (2006) 257–267.
[18] N. Kannan, M.M. Sundaram, Kinetics and mechanism of removal of meth- ylene blue by adsorption on various carbons—a comparative study, J. Dyes Pig. 51 (2001) 25–40.
[19] Y. Bulut, H. AydIn, A kinetics and thermodynamics study of methylene blue
adsorption on wheat shells, Desalination 194 (2006) 259–267.
[20] M. El-Guendi, Homogeneous surface diffusion model of basic dyestuffs onto natural clay in batch adsorbers, Adsorpt. Sci. Technol. 8 (2) (1991) 217–225.
[21] B. Yasemin, A. Haluk, A kinetics and thermodynamics study of methylene
blue adsorption on wheat shells, Desalination 194 (2006) 259–267.
[22] Mansoor Anbia, Saba Asl Hariri, Removal of methylene blue from aqueous solution using nanoporous SBA-3, Desalination 261 (2010) 61–66.
[23] S. Senthilkumaar, P. R. varadarajab, K. Porkodi, C. V. Subbhuraam (2005).
Adsorption of methylene blue onto jute fiber carbon: kinetics and equilibrium studies. Journal of Colloid Interface Science, 284:78-82.
[24] I. Langmuir, Adsorption of gases on plain surfaces of glass mica platinum, J.
Am. Chem. Soc. 40 (1918) 136–403.
[25] H.M.F. Freundlich, over the adsorption in solution, J. Phys. Chem. 57 (1906)
385–470.
[26] F. Haghseresht, G. Lu, Adsorption characteristics ophenolic compounds onto coal reject derived adsorbents, Energy Fuels 12 (1998) 1100–1107.
[27] M.J. Tempkin, V. Pyzhev, Acta Physiochim. USSR 12 (1940) 217–222.
[28] Zeynep Eren, Filiz Nuran Acar, Adsorption of Reactive Black 5 from an aqueous solution: equilibrium and kinetic studies, Desalination 194 (2006) 1–
10.
[29] Ho YS, McKay G. Pseudo-second order model for sorption processes. Process
Biochem 1999; 34:451 - 465.
[30] Olugbenga Solomon Bello, Oladipo Mary Adelaide, Misbaudeen Abdul Hammed, Olalekan Abdul muiz popoola, Kinetic And Equilibrium Studies Of Methylene Blue Removal From Aquous Solutionby Adsorption On Treat- ed Saw Dust, Macedonian Journal of Chemistry and Chemical Engineering, Vol. 29, No. 1, pp. 77–85 (2010)
[31] Atef S.ALzaydien, Adsorption Of Methylene Blue From Aquous Solution On
To A Low-Cost Natural Jordanian Tripoli, American Journal of Environmen- tal Sciences 5 (3): 197-208, 2009
[32] Muhammad A.Rauf, I.Shehadeh, Amal Ahmed, and Ahmed Al-Zamly, Removal Of Methylene Blue From Aqueous Solution By Using Gypsum As A Low Cost Adsorbent , World Academy of Science, Engineering and Tech- nology (55) ) 608 – 613 (2009).
[33] Casmir E.Gimba, Odike Ocholi, Peter A.Egwaikhide, Turouti Muyiwa, and Emmanuel E.Akporhonor, New raw material for activated carbon. I.methylene blue adsorption on activated carbon prepared from khaya sene- galensis fruits, Cien. Inv. Agr. 36(1):107-114. 2009
[34] N.Consolin Filho, E.C.Venancio.M.F.Barriquello, A.A.W.Hechenleitner, E.A.G.Pineda, Letica quimica, outubro-dezembro, Methylene Blue Adsorp- tion Onto Modified Lignin From Sugar Cane Bagasse, ELECTICA, Vol
32,no4-2007 63- 70
[35] Yamin Yasin, Mohad Zobir Hussein and Faujan Hj Ahmad, Adsorption Of
Methylene Blue On To Treated Activated Carbon, The Malaysian Journal of
Analytical Sciences, Vol 11, No 11 (2007): 400 – 406
[36] Collin G.Joseph, Awang Bono, Duduku Krishnaiah, kok onn soon , Sorption Studies Of Methylene Blue Dye In Aqueous Solution By Optmized Carbon Prepared From Guava Seeds , Material Science (MEDZIAGOTYRA).vol.
13,No. 1. 2007 83-87.
[37] B.H.Hameed, A.T.M.Din, A.L.Ahmad, Adsorption Of Methylene Blue Onto Bamboo Based Activated Carbon Kinetics And Equilibrium Studies, Journal of hazardous Material, vol 141 no 3 819-825 (2007)
[38] A.Rasheed khan, Hajira Tahir, Fahim Uddin; Uzma Hameed Adsorption Of Methylene Blue From Aqueous Solution On The Surface Of Wool Fiber And Cotton Fiber, Appl. Sci. Environ. Mgt. 2005 Vol. 9 (2) 29 - 3539.
[39] Y. O¨ nal, Kinetics of adsorption of dyes from aqueous solution using activat- ed carbon prepared from waste apricot, J. Hazard. Mater. 137 (2006) 1719–
1728.
[40] S. Karaca, A. Gu¨ rses, M. Acıkyıldız, M. Ejder, Adsorption of cationic dye from aqueous solutions by activated carbon Korucu, Microporous Mesopo- rous Mater. 115 (2008) 376–382.
[41] Perry R h & Green W D, Perrys chemical Engineers Handbook,7th edn (Mc
Graw Hil International Editions), 1998.
[42] Elibol M, Response surface methodological approach for inclusion of per- fluorocarbon in actinorhodin fermentation medium, Process Biochemistry, 38 (2002) 667-673.
[43] Marban G, Valdes-Soils T & Fuertes A B, Chem Eng Sci, 61(7) (2006) 4762-
4772.
IJSER © 2013